| Param | Original file | Final file |
|---|---|---|
| Filename | modeM0/AS1A06_006T01_9000005860_43225cztM0_level2.fits | modeM0/AS1A06_006T01_9000005860_43225cztM0_level2_quad_clean.evt |
| Size (bytes) | 345,136,320 | 91,699,200 |
| Size | 329.1 MB | 87.5 MB |
| Events in quadrant A | 3,577,333 | 600,709 |
| Events in quadrant B | 2,431,753 | 639,409 |
| Events in quadrant C | 2,856,603 | 601,793 |
| Events in quadrant D | 3,474,730 | 543,674 |
| Mode SS | |||
|---|---|---|---|
| Quadrant | BADHDUFLAG | Total packets | Discarded packets |
| A | 0 | 114 | 0 |
| B | 0 | 114 | 0 |
| C | 0 | 114 | 0 |
| D | 0 | 114 | 0 |
| Mode M9 | |||
|---|---|---|---|
| Quadrant | BADHDUFLAG | Total packets | Discarded packets |
| A | 0 | 32 | 0 |
| B | 0 | 33 | 0 |
| C | 0 | 33 | 0 |
| D | 0 | 33 | 0 |
| Mode M0 | |||
|---|---|---|---|
| Quadrant | BADHDUFLAG | Total packets | Discarded packets |
| A | 0 | 14110 | 3 |
| B | 0 | 11345 | 2 |
| C | 0 | 11978 | 2 |
| D | 0 | 14274 | 2 |
| Quadrant | Total seconds | Saturated seconds | Saturation percentage |
|---|---|---|---|
| A | 5589 | 151 | 2.701736% |
| B | 5589 | 9 | 0.161031% |
| C | 5589 | 69 | 1.234568% |
| D | 5589 | 161 | 2.880658% |
Noise dominated data is calculated using 1-second bins in cleaned event files. If a bin has >2000 counts, and if more than 50% of those come from <1% of pixels, then it is considered to be noise-dominated and hence unusable.
| Quadrant | # 1 sec bins | Bins with >0 counts | Bins with >2000 counts | High rate bins dominated by noise | Noise dominated (total time) | Noise dominated (detector-on time) | Marked lightcurve |
|---|---|---|---|---|---|---|---|
| A | 7413 | 5590 | 145 | 145 | 1.96% | 2.59% | 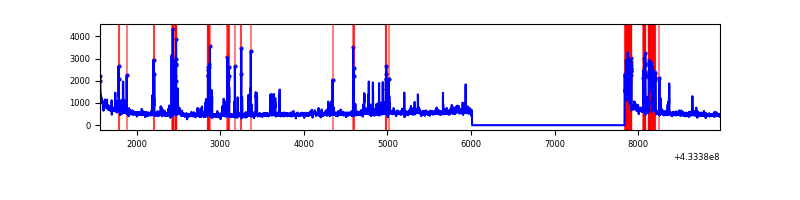 |
| B | 7413 | 5590 | 7 | 7 | 0.09% | 0.13% | 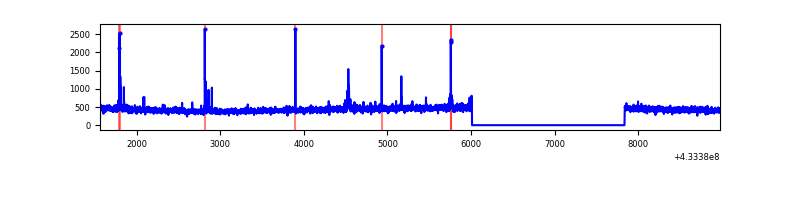 |
| C | 7413 | 5590 | 67 | 67 | 0.90% | 1.20% | 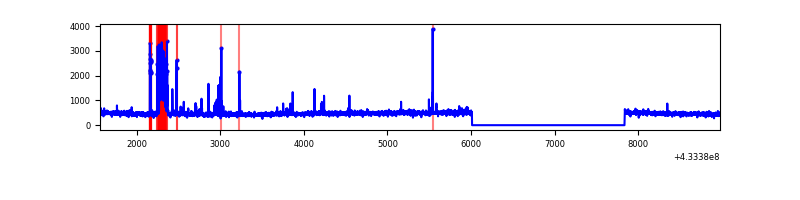 |
| D | 7413 | 5590 | 135 | 135 | 1.82% | 2.42% | 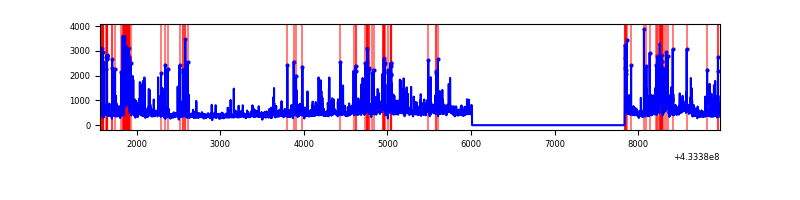 |
Top three noisy pixels from each quadrant. If the there are fewer than three noisy pixels in the level2.evt file, extra rows are filled as -1
| Pixel properties | Quadrant properties | ||||||
|---|---|---|---|---|---|---|---|
| Quadrant | DetID | PixID | Counts | Sigma | Mean | Median | Sigma |
| A | 10 | 83 | 584671 | 4732.72 | 595 | 583 | 123.4 |
| A | 15 | 237 | 445649 | 3606.26 | 595 | 583 | 123.4 |
| A | 13 | 248 | 122584 | 988.54 | 595 | 583 | 123.4 |
| B | 5 | 255 | 33400 | 278.98 | 601 | 584 | 117.6 |
| B | 5 | 172 | 29560 | 246.33 | 601 | 584 | 117.6 |
| B | 12 | 111 | 14522 | 118.49 | 601 | 584 | 117.6 |
| C | 14 | 254 | 291927 | 2094.33 | 594 | 597 | 139.1 |
| C | 15 | 214 | 232724 | 1668.73 | 594 | 597 | 139.1 |
| C | 3 | 233 | 6928 | 45.51 | 594 | 597 | 139.1 |
| D | 1 | 52 | 396809 | 2774.77 | 585 | 568 | 142.8 |
| D | 13 | 249 | 362621 | 2535.36 | 585 | 568 | 142.8 |
| D | 12 | 16 | 200517 | 1400.19 | 585 | 568 | 142.8 |
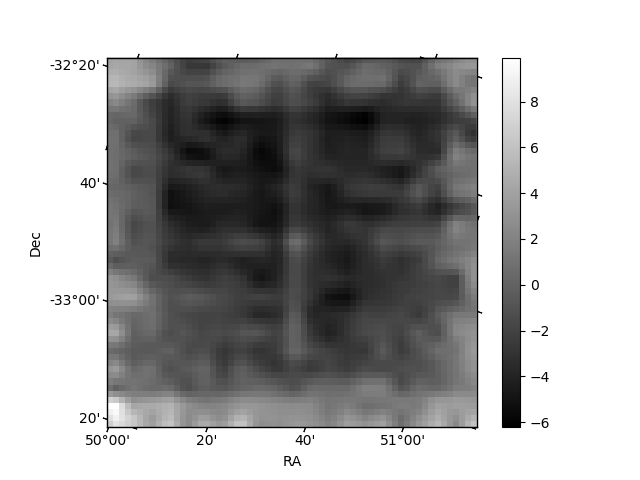
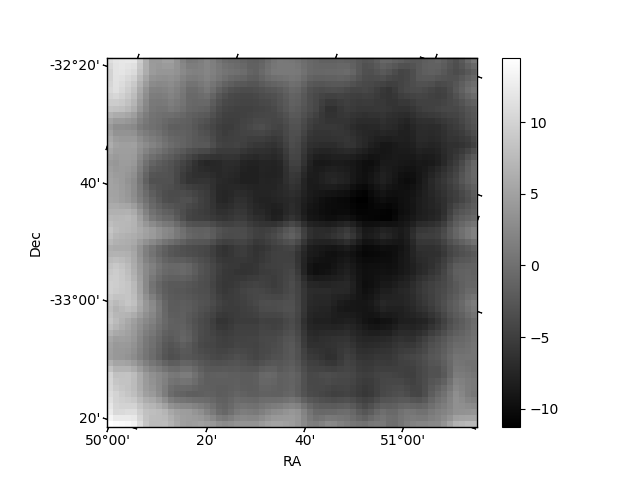
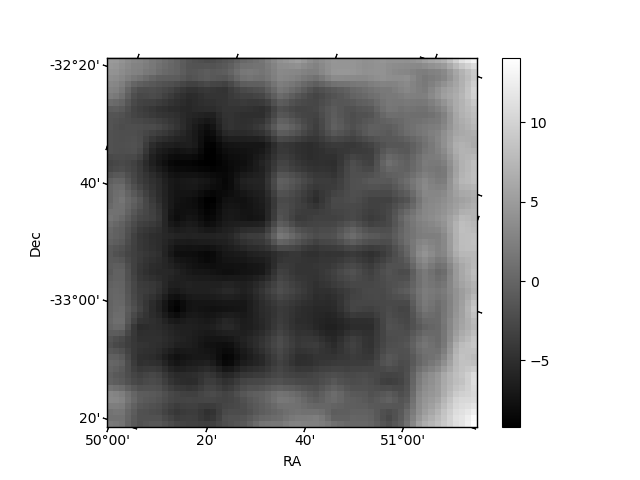
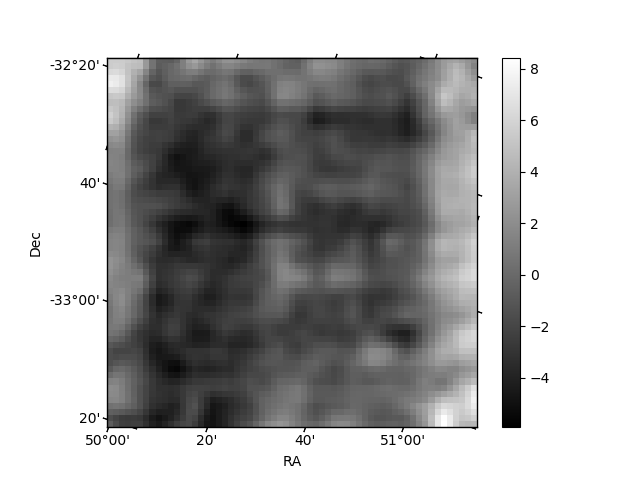
Histogram calculated using DETX and DETY for each event in the final _common_clean file
| Quadrant A | 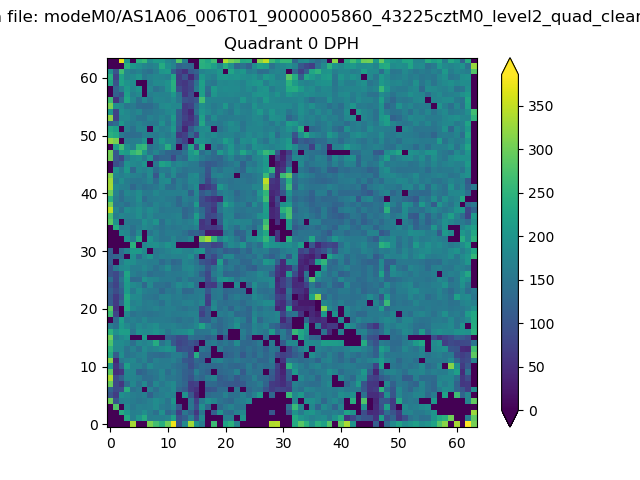 |
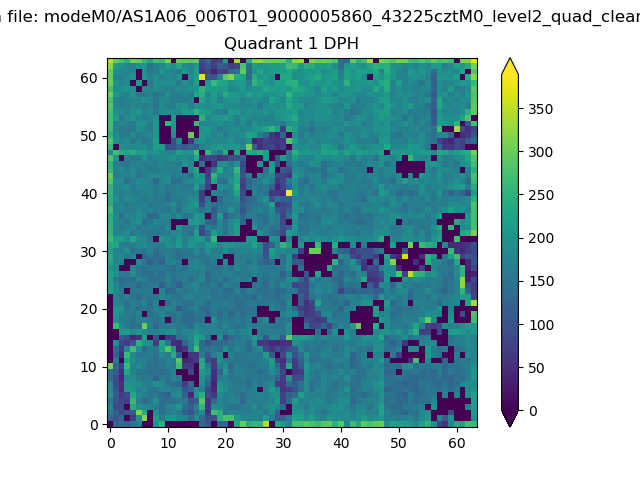 |
Quadrant B |
|---|---|---|---|
| Quadrant D | 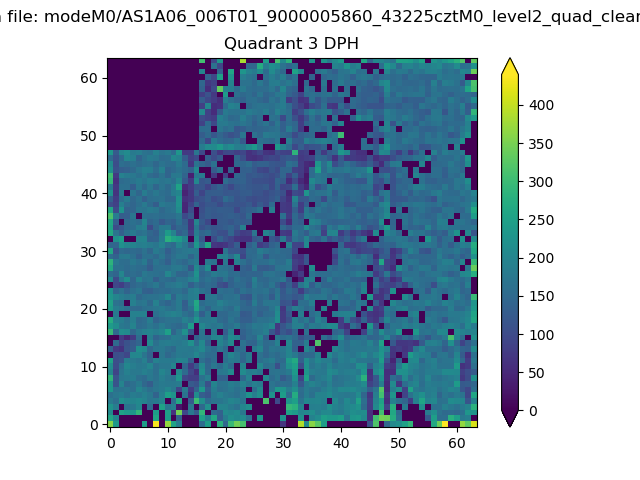 |
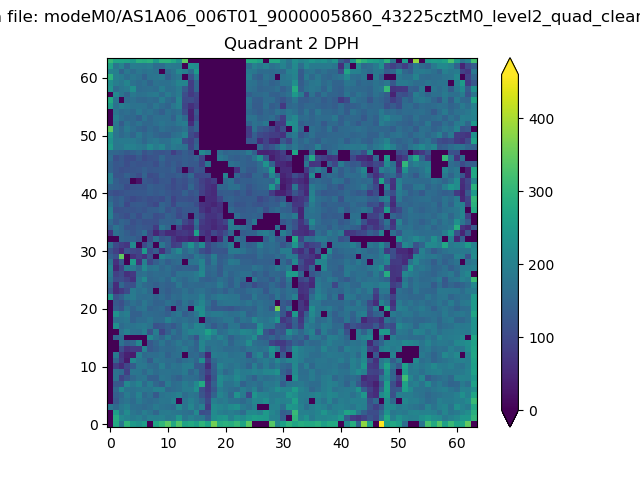 |
Quadrant C |
| Plot type | Count rate plots | Images |
|---|---|---|
| Comparison with Poisson distribution Blue bars denote a histogram of data divided into 1 sec bins. Red curve is a Poisson curve with rate = median count rate of data. |
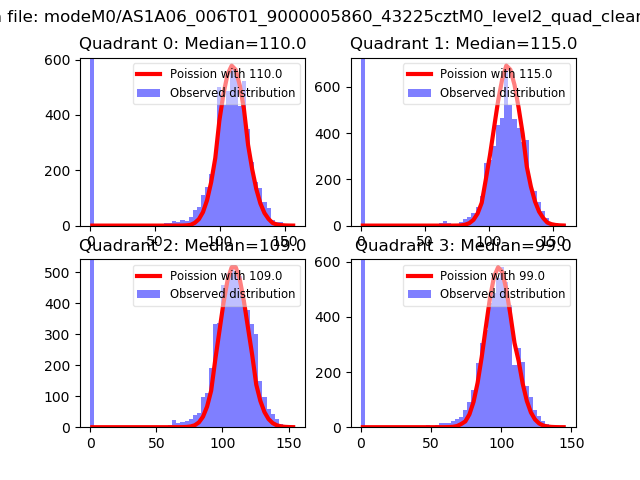 |
 |
| Quadrant-wise count rates Data is divided into 100 sec bins |
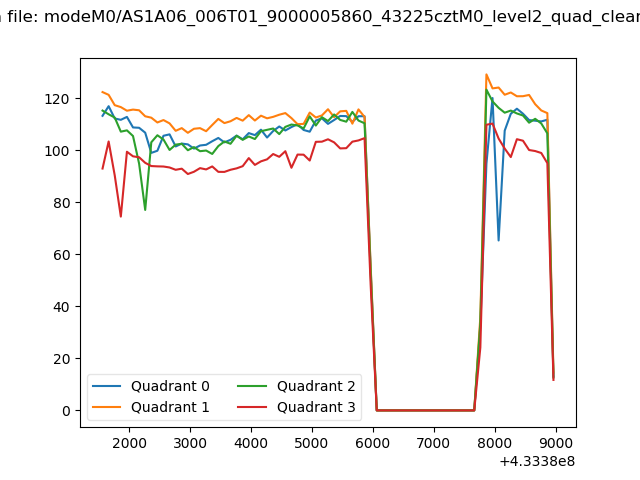 |
|
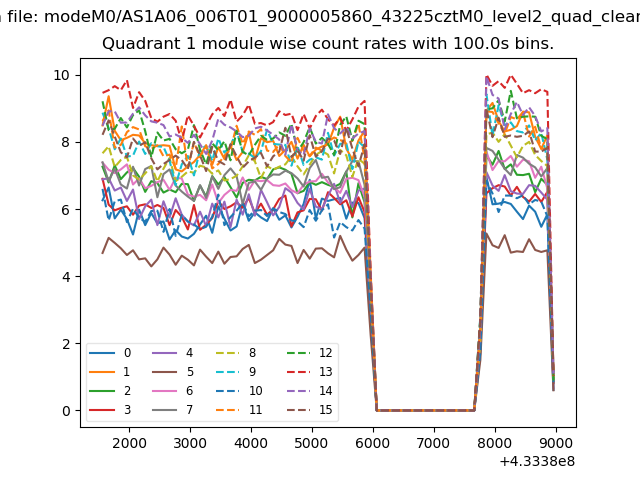
| Module-wise count rates for Quadrant A Data is divided into 100 sec bins |
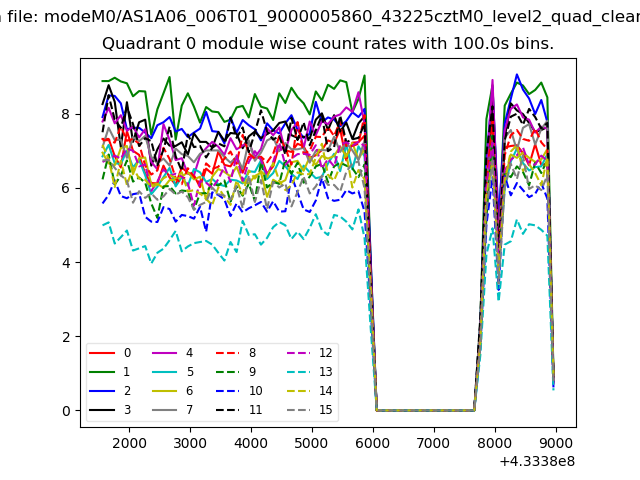 |
 |
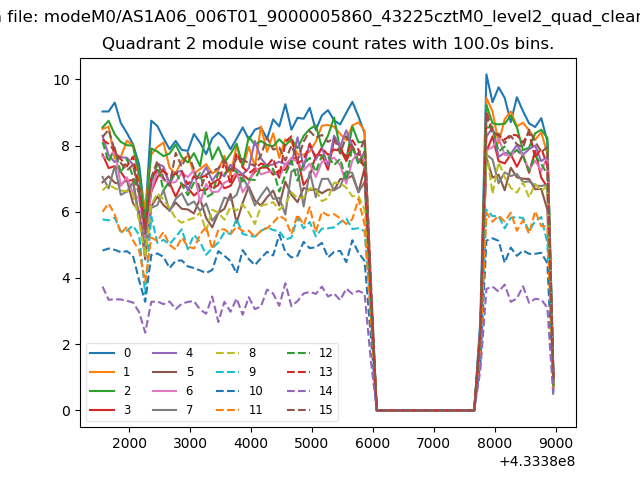
| Module-wise count rates for Quadrant B Data is divided into 100 sec bins |
 |
 |
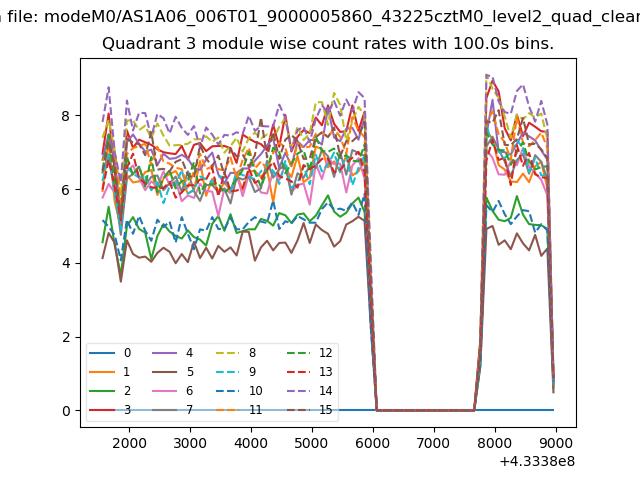
| Module-wise count rates for Quadrant C Data is divided into 100 sec bins |
 |
 |
| Module-wise count rates for Quadrant D Data is divided into 100 sec bins |
 |
 |
| Parameter | Plot |
|---|---|
| CZT HV Monitor | 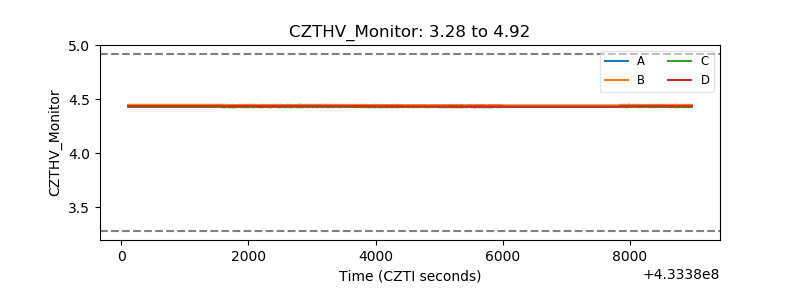 |
| D_VDD | 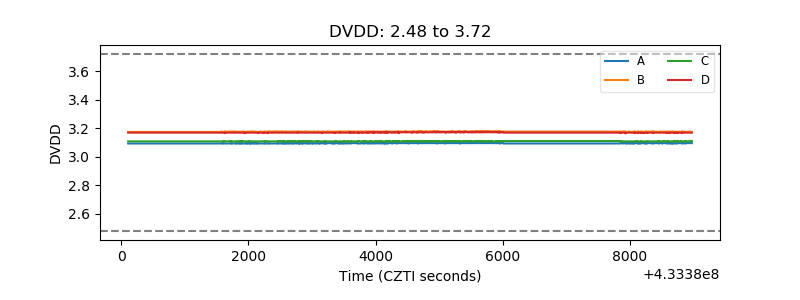 |
| Temperature 1 | 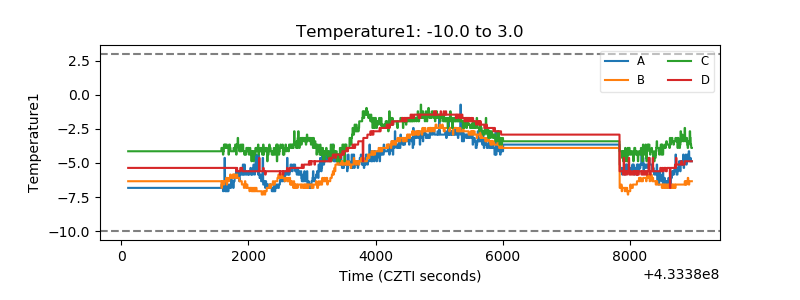 |
| Veto HV Monitor | 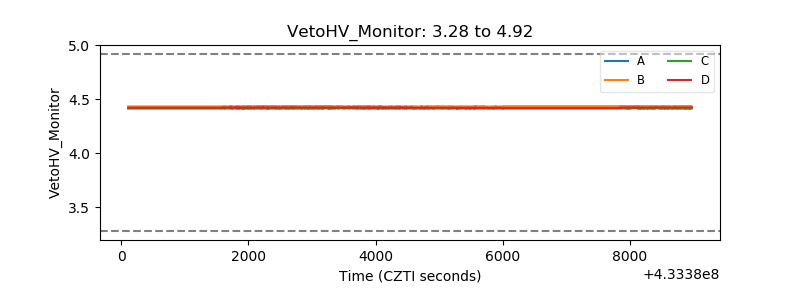 |
| Veto LLD | 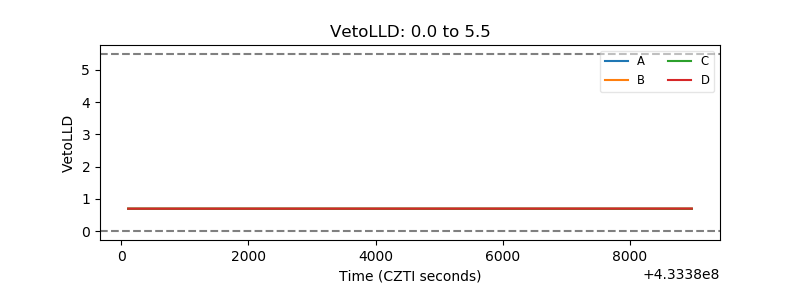 |
| Alpha Counter | 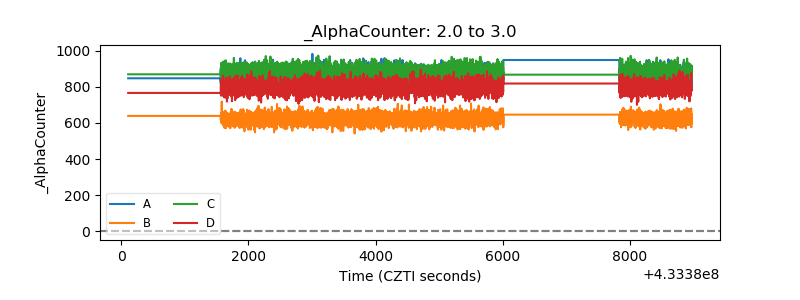 |
| _CPM_Rate | 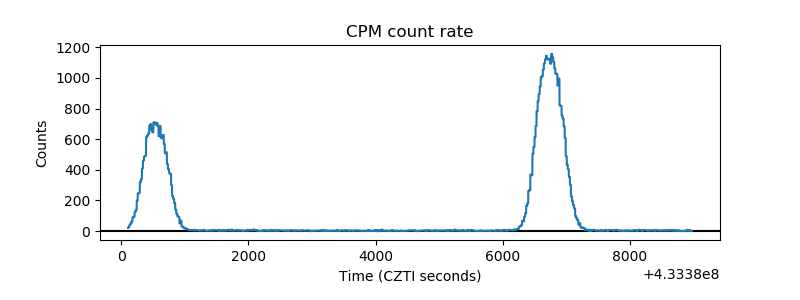 |
| CZT Counter | 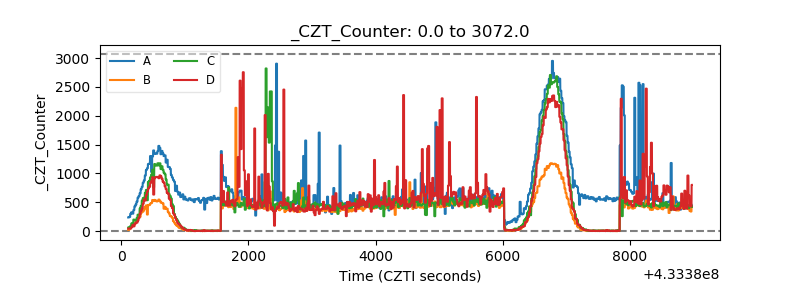 |
| +2.5 Volts monitor | 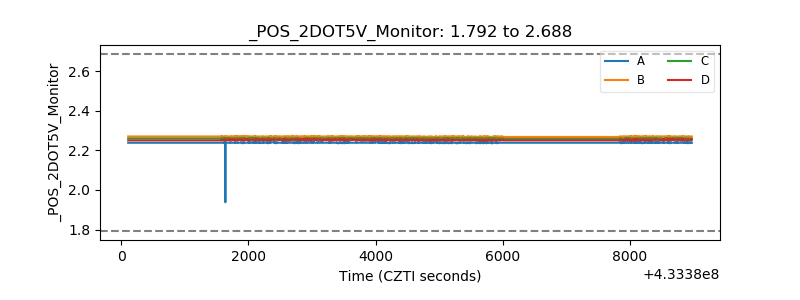 |
| +5 Volts monitor | 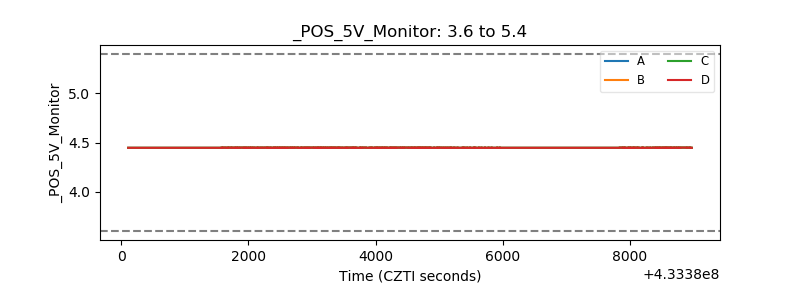 |
| _ROLL_ROT | 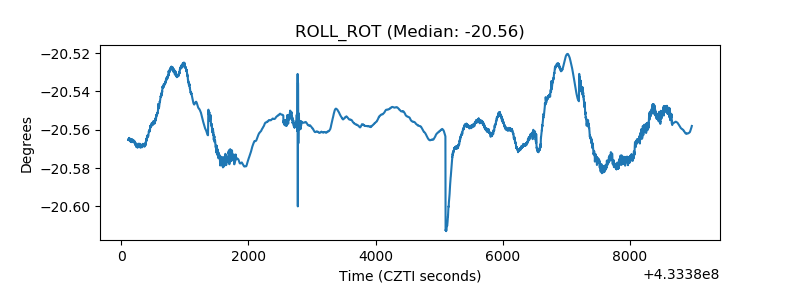 |
| _Roll_DEC | 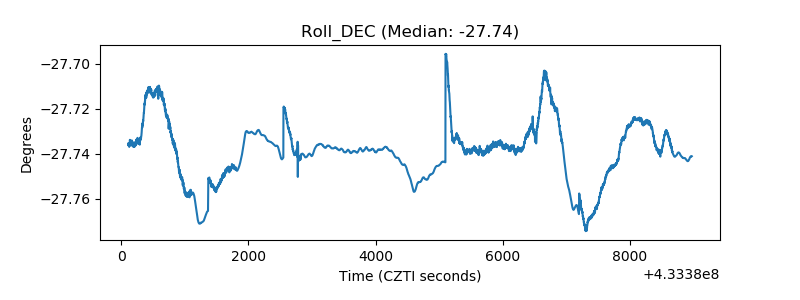 |
| _Roll_RA |  |
| Veto Counter | 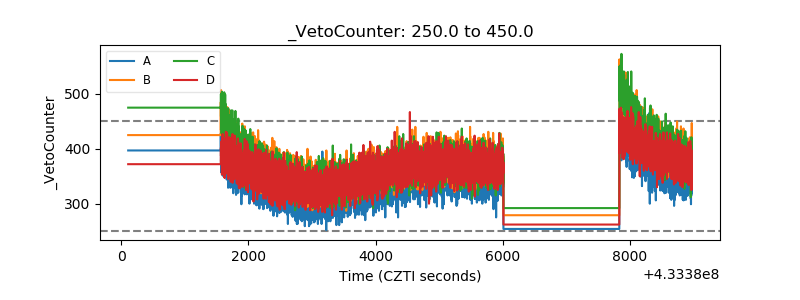 |