| Param | Original file | Final file |
|---|---|---|
| Filename | modeM0/AS1A06_006T01_9000005860_43226cztM0_level2.fits | modeM0/AS1A06_006T01_9000005860_43226cztM0_level2_quad_clean.evt |
| Size (bytes) | 332,562,240 | 91,270,080 |
| Size | 317.2 MB | 87.0 MB |
| Events in quadrant A | 3,755,380 | 591,721 |
| Events in quadrant B | 2,353,748 | 638,688 |
| Events in quadrant C | 2,544,463 | 608,019 |
| Events in quadrant D | 3,237,940 | 548,775 |
| Mode SS | |||
|---|---|---|---|
| Quadrant | BADHDUFLAG | Total packets | Discarded packets |
| A | 0 | 110 | 0 |
| B | 0 | 110 | 0 |
| C | 0 | 110 | 0 |
| D | 0 | 110 | 0 |
| Mode M9 | |||
|---|---|---|---|
| Quadrant | BADHDUFLAG | Total packets | Discarded packets |
| A | 0 | 31 | 0 |
| B | 0 | 32 | 0 |
| C | 0 | 32 | 0 |
| D | 0 | 32 | 0 |
| Mode M0 | |||
|---|---|---|---|
| Quadrant | BADHDUFLAG | Total packets | Discarded packets |
| A | 0 | 14579 | 2 |
| B | 0 | 10794 | 2 |
| C | 0 | 10805 | 2 |
| D | 0 | 13253 | 2 |
| Quadrant | Total seconds | Saturated seconds | Saturation percentage |
|---|---|---|---|
| A | 5376 | 223 | 4.148065% |
| B | 5376 | 5 | 0.093006% |
| C | 5376 | 2 | 0.037202% |
| D | 5376 | 99 | 1.841518% |
Noise dominated data is calculated using 1-second bins in cleaned event files. If a bin has >2000 counts, and if more than 50% of those come from <1% of pixels, then it is considered to be noise-dominated and hence unusable.
| Quadrant | # 1 sec bins | Bins with >0 counts | Bins with >2000 counts | High rate bins dominated by noise | Noise dominated (total time) | Noise dominated (detector-on time) | Marked lightcurve |
|---|---|---|---|---|---|---|---|
| A | 7289 | 5377 | 203 | 203 | 2.79% | 3.78% | 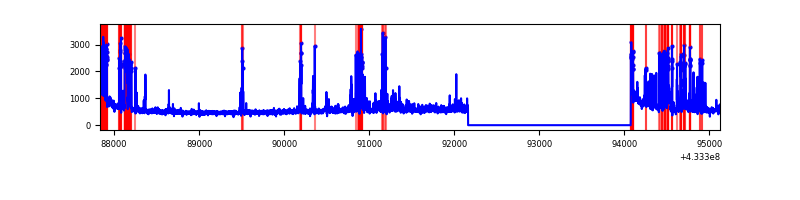 |
| B | 7289 | 5377 | 0 | 0 | 0.00% | 0.00% | 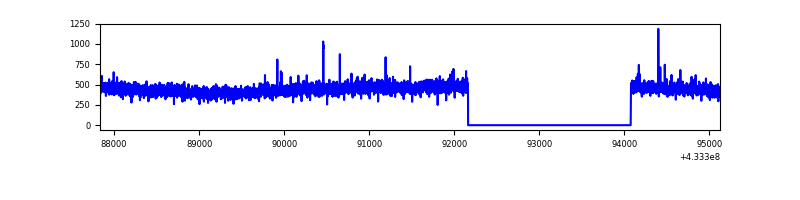 |
| C | 7289 | 5377 | 0 | 0 | 0.00% | 0.00% | 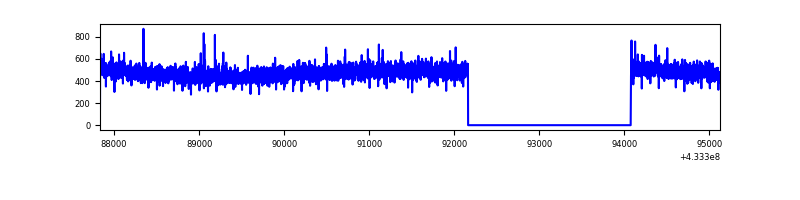 |
| D | 7289 | 5377 | 94 | 94 | 1.29% | 1.75% | 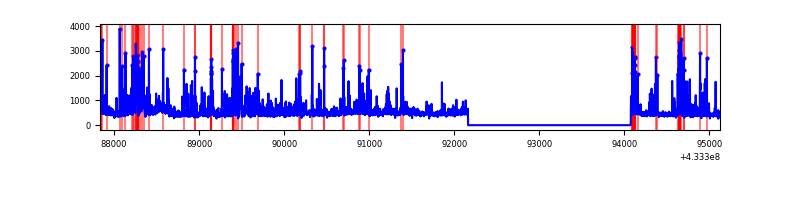 |
Top three noisy pixels from each quadrant. If the there are fewer than three noisy pixels in the level2.evt file, extra rows are filled as -1
| Pixel properties | Quadrant properties | ||||||
|---|---|---|---|---|---|---|---|
| Quadrant | DetID | PixID | Counts | Sigma | Mean | Median | Sigma |
| A | 10 | 83 | 566600 | 4697.28 | 588 | 576 | 120.5 |
| A | 15 | 237 | 499764 | 4142.63 | 588 | 576 | 120.5 |
| A | 13 | 248 | 285673 | 2365.95 | 588 | 576 | 120.5 |
| B | 12 | 111 | 14223 | 117.03 | 596 | 580 | 116.6 |
| B | 11 | 111 | 13477 | 110.63 | 596 | 580 | 116.6 |
| B | 5 | 255 | 13044 | 106.92 | 596 | 580 | 116.6 |
| C | 15 | 214 | 224561 | 1611.53 | 592 | 596 | 139.0 |
| C | 14 | 254 | 8063 | 53.73 | 592 | 596 | 139.0 |
| C | 13 | 61 | 3936 | 24.03 | 592 | 596 | 139.0 |
| D | 12 | 16 | 434698 | 3044.18 | 584 | 568 | 142.6 |
| D | 1 | 52 | 286569 | 2005.48 | 584 | 568 | 142.6 |
| D | 13 | 249 | 129416 | 903.5 | 584 | 568 | 142.6 |
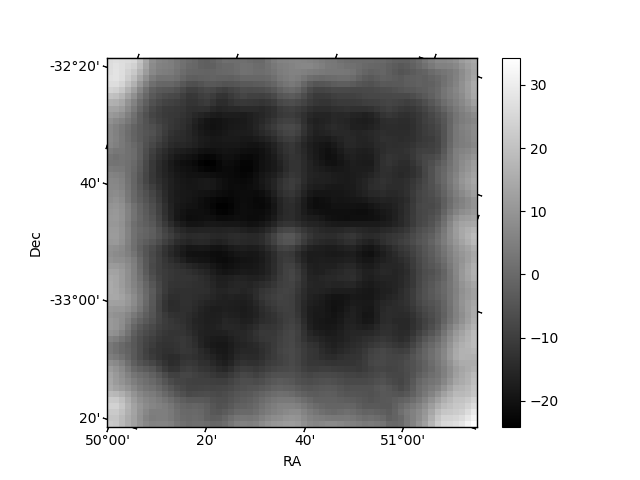
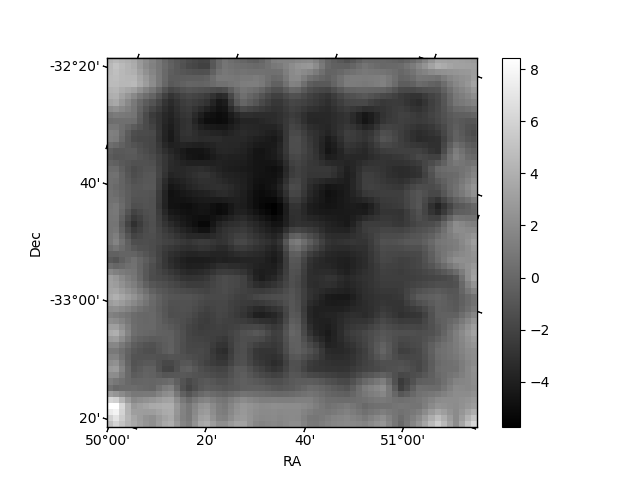
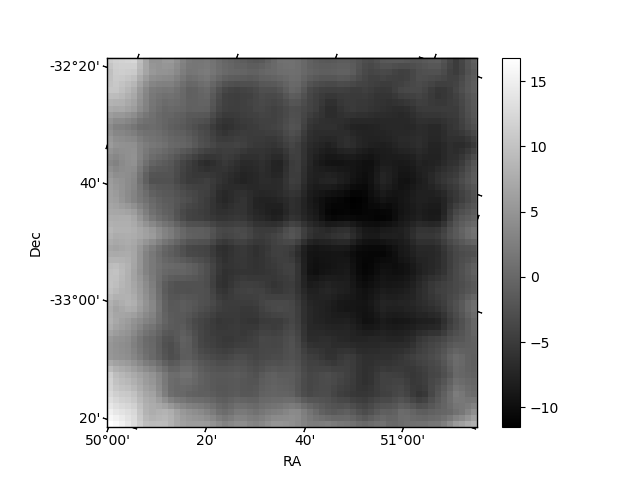
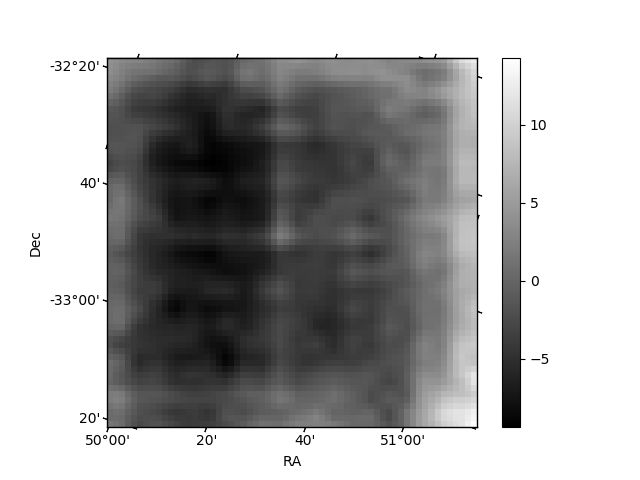
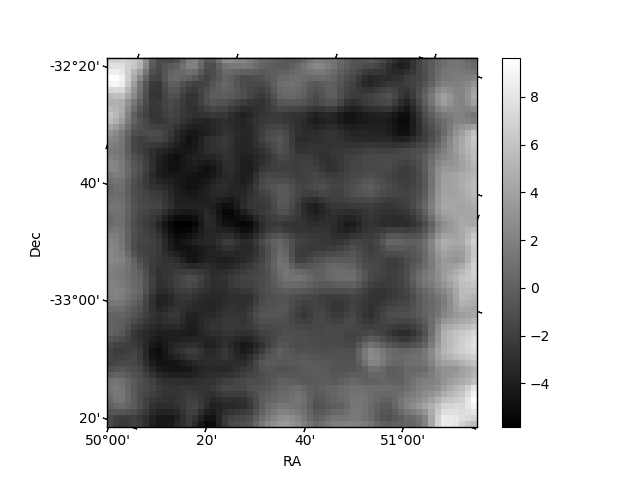
Histogram calculated using DETX and DETY for each event in the final _common_clean file
| Quadrant A | 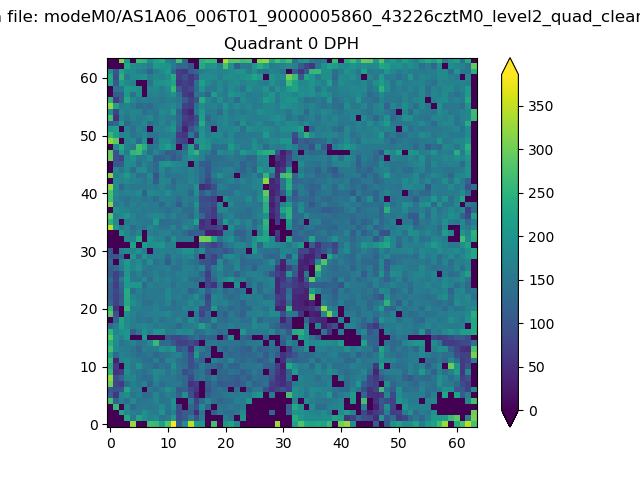 |
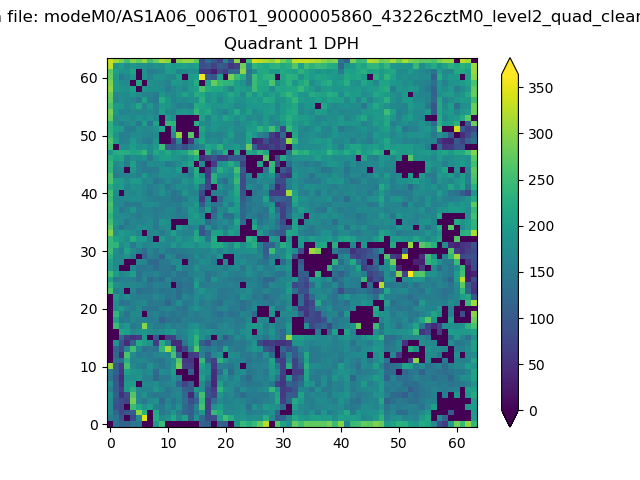 |
Quadrant B |
|---|---|---|---|
| Quadrant D | 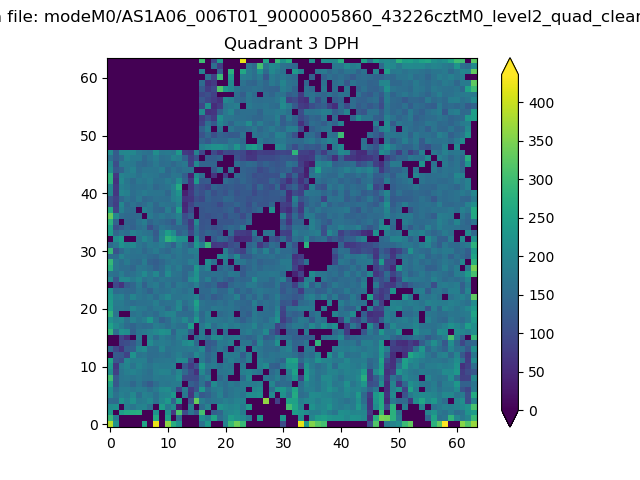 |
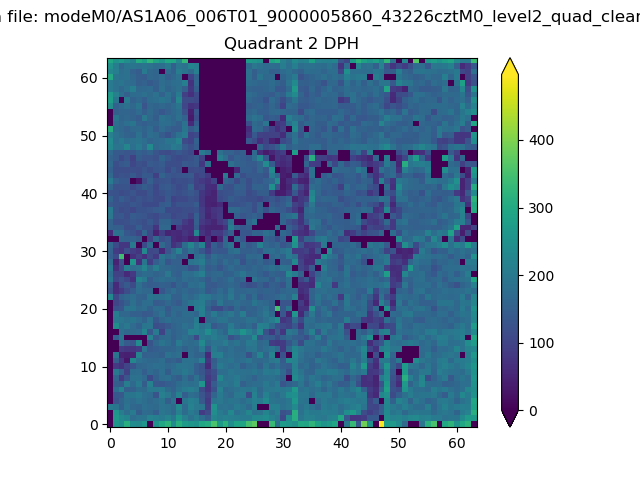 |
Quadrant C |
| Plot type | Count rate plots | Images |
|---|---|---|
| Comparison with Poisson distribution Blue bars denote a histogram of data divided into 1 sec bins. Red curve is a Poisson curve with rate = median count rate of data. |
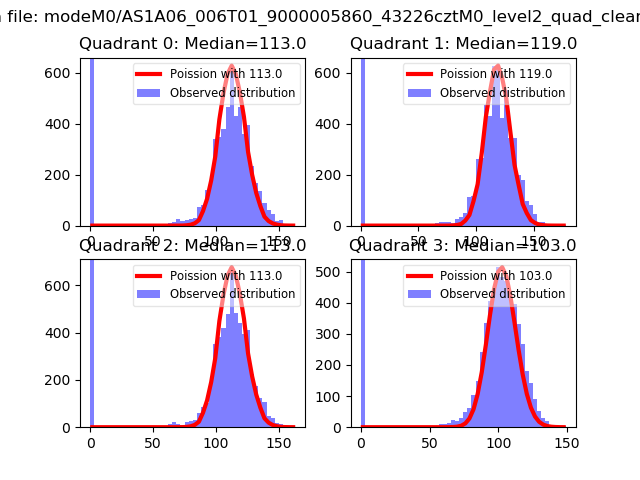 |
 |
| Quadrant-wise count rates Data is divided into 100 sec bins |
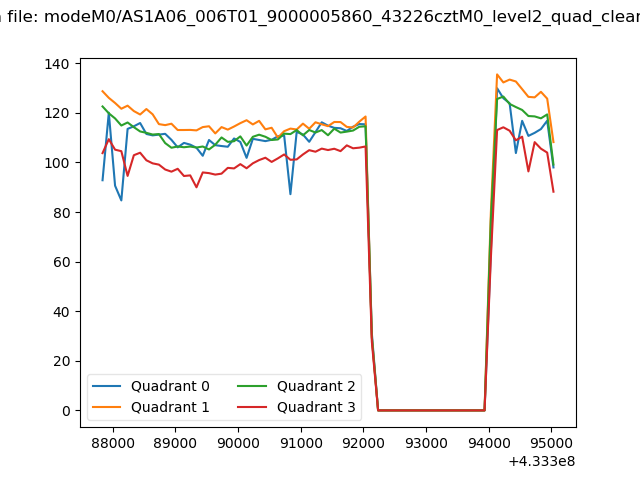 |
|
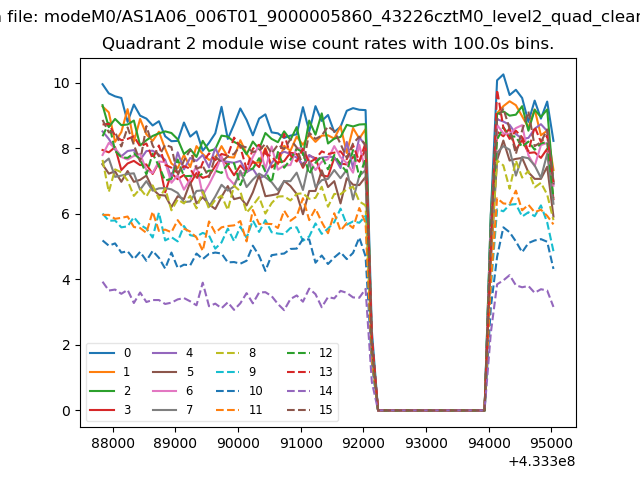
| Module-wise count rates for Quadrant A Data is divided into 100 sec bins |
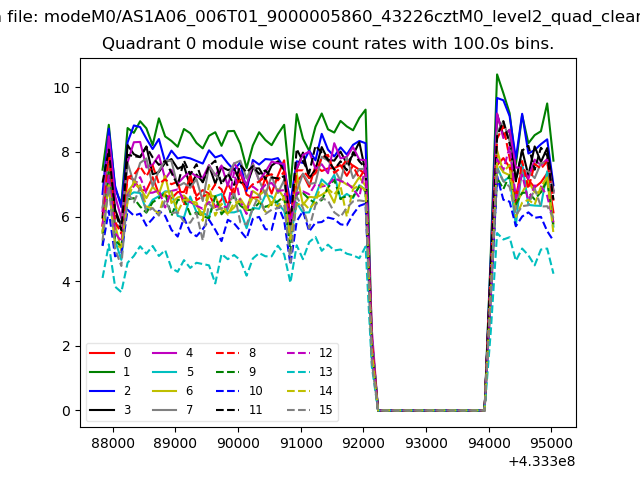 |
 |
| Module-wise count rates for Quadrant B Data is divided into 100 sec bins |
 |
 |
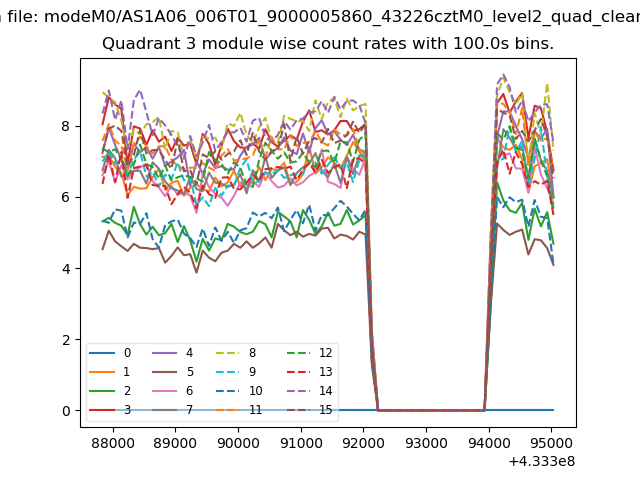
| Module-wise count rates for Quadrant C Data is divided into 100 sec bins |
 |
 |
| Module-wise count rates for Quadrant D Data is divided into 100 sec bins |
 |
 |
| Parameter | Plot |
|---|---|
| CZT HV Monitor | 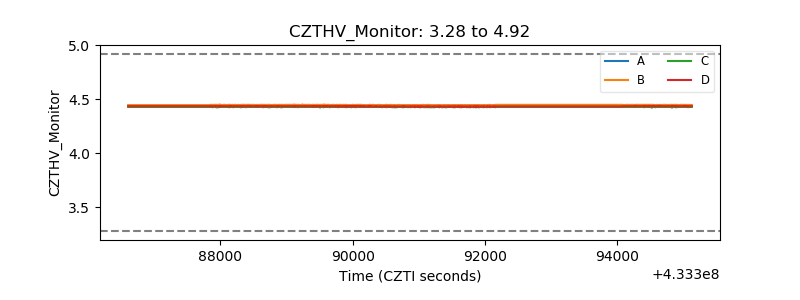 |
| D_VDD | 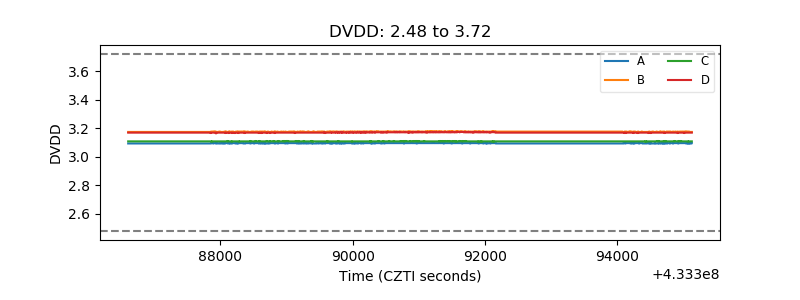 |
| Temperature 1 | 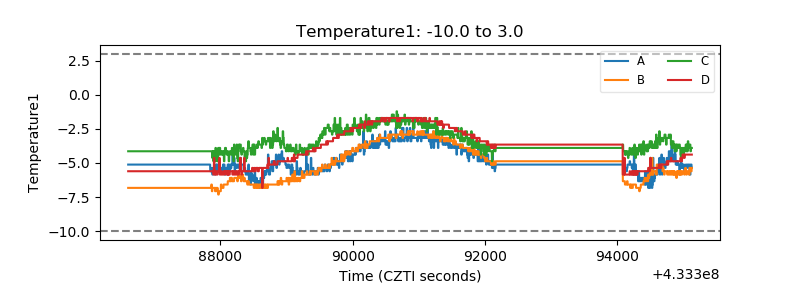 |
| Veto HV Monitor | 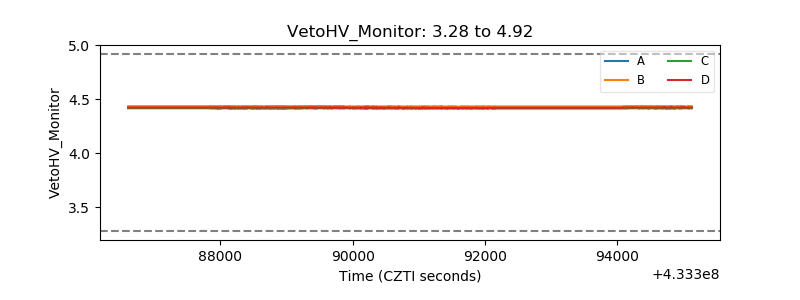 |
| Veto LLD | 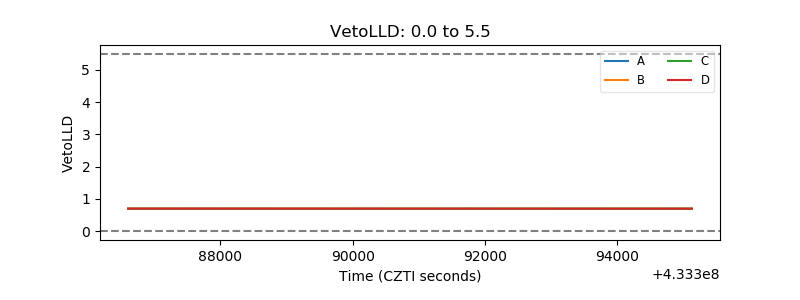 |
| Alpha Counter | 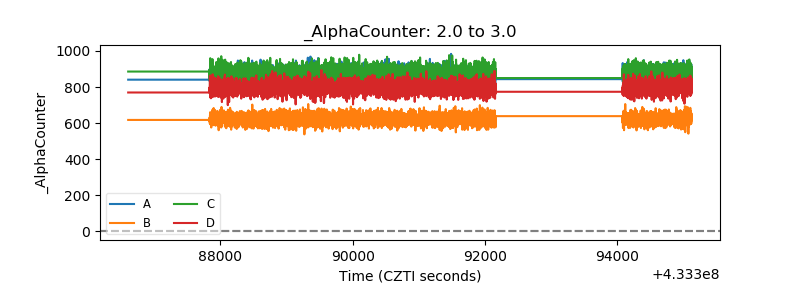 |
| _CPM_Rate | 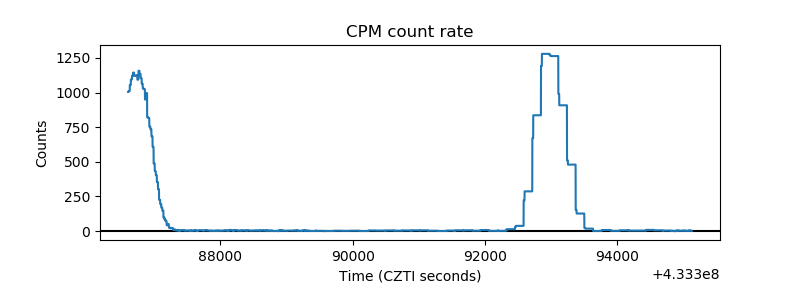 |
| CZT Counter | 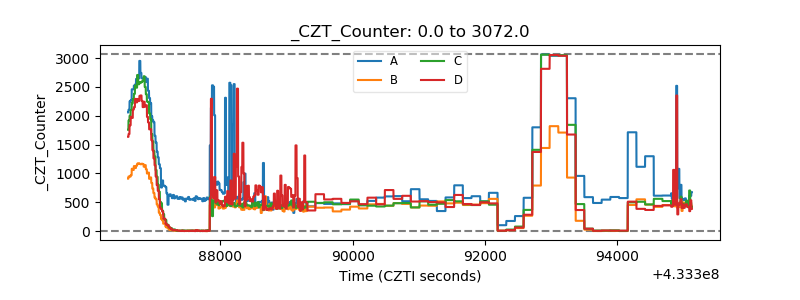 |
| +2.5 Volts monitor | 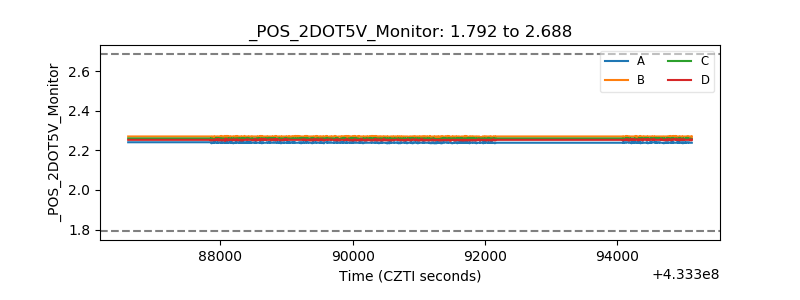 |
| +5 Volts monitor | 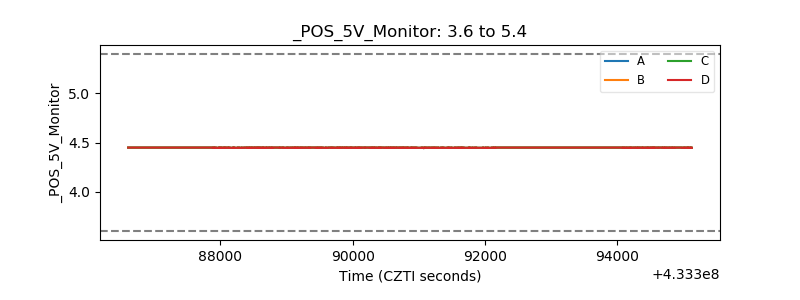 |
| _ROLL_ROT | 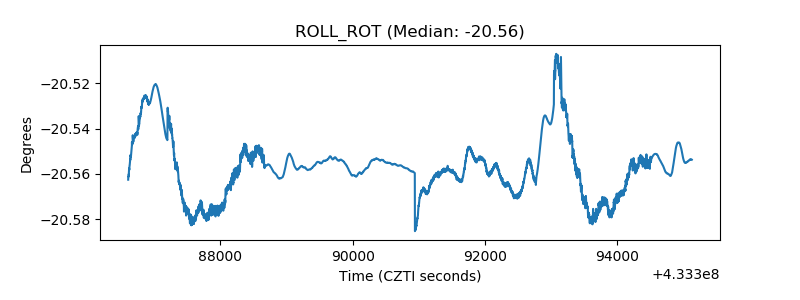 |
| _Roll_DEC | 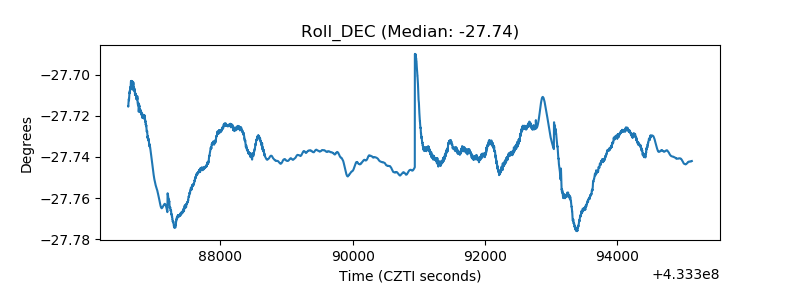 |
| _Roll_RA | 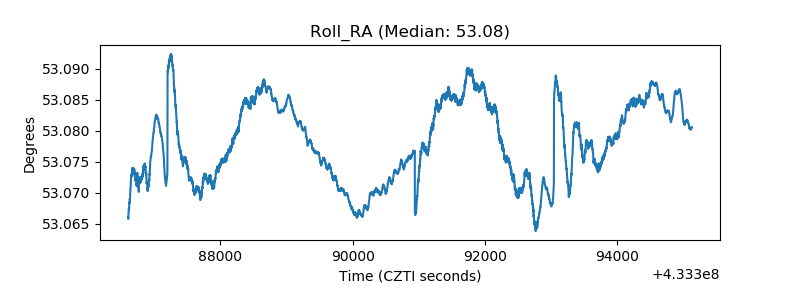 |
| Veto Counter | 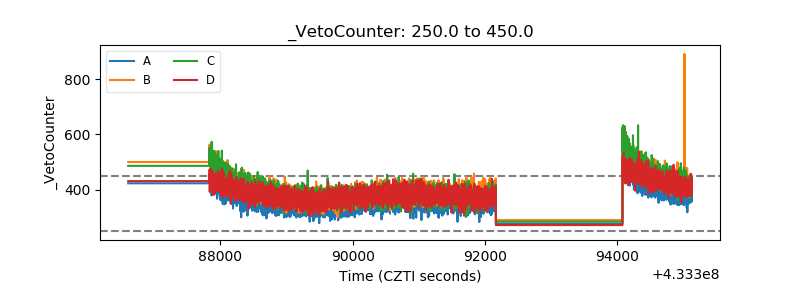 |