| Param | Original file | Final file |
|---|---|---|
| Filename | modeM0/AS1A06_006T01_9000005860_43228cztM0_level2.fits | modeM0/AS1A06_006T01_9000005860_43228cztM0_level2_quad_clean.evt |
| Size (bytes) | 315,982,080 | 84,738,240 |
| Size | 301.3 MB | 80.8 MB |
| Events in quadrant A | 3,794,319 | 545,739 |
| Events in quadrant B | 2,216,632 | 595,972 |
| Events in quadrant C | 2,450,518 | 568,009 |
| Events in quadrant D | 2,856,947 | 515,951 |
| Mode SS | |||
|---|---|---|---|
| Quadrant | BADHDUFLAG | Total packets | Discarded packets |
| A | 0 | 98 | 0 |
| B | 0 | 98 | 0 |
| C | 0 | 98 | 0 |
| D | 0 | 98 | 0 |
| Mode M9 | |||
|---|---|---|---|
| Quadrant | BADHDUFLAG | Total packets | Discarded packets |
| A | 0 | 32 | 0 |
| B | 0 | 33 | 0 |
| C | 0 | 33 | 0 |
| D | 0 | 33 | 0 |
| Mode M0 | |||
|---|---|---|---|
| Quadrant | BADHDUFLAG | Total packets | Discarded packets |
| A | 0 | 14314 | 2 |
| B | 0 | 9792 | 2 |
| C | 0 | 10043 | 2 |
| D | 0 | 11634 | 2 |
| Quadrant | Total seconds | Saturated seconds | Saturation percentage |
|---|---|---|---|
| A | 4855 | 296 | 6.096807% |
| B | 4855 | 5 | 0.102987% |
| C | 4855 | 14 | 0.288363% |
| D | 4854 | 83 | 1.709930% |
Noise dominated data is calculated using 1-second bins in cleaned event files. If a bin has >2000 counts, and if more than 50% of those come from <1% of pixels, then it is considered to be noise-dominated and hence unusable.
| Quadrant | # 1 sec bins | Bins with >0 counts | Bins with >2000 counts | High rate bins dominated by noise | Noise dominated (total time) | Noise dominated (detector-on time) | Marked lightcurve |
|---|---|---|---|---|---|---|---|
| A | 6978 | 4856 | 256 | 256 | 3.67% | 5.27% | 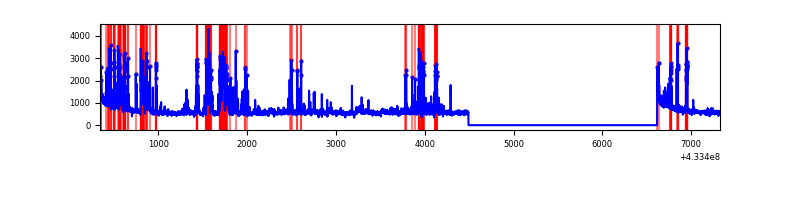 |
| B | 6978 | 4856 | 1 | 1 | 0.01% | 0.02% | 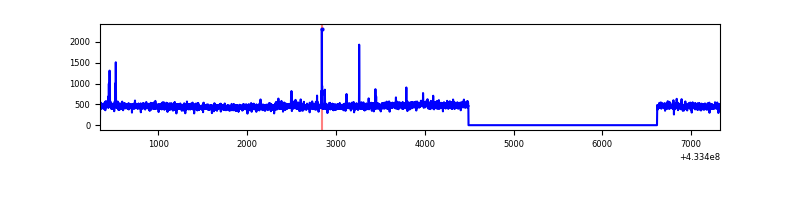 |
| C | 6978 | 4856 | 11 | 11 | 0.16% | 0.23% | 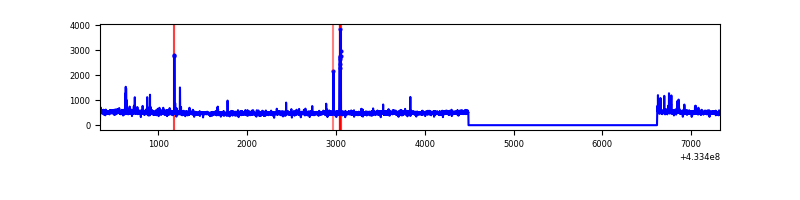 |
| D | 6977 | 4855 | 79 | 79 | 1.13% | 1.63% | 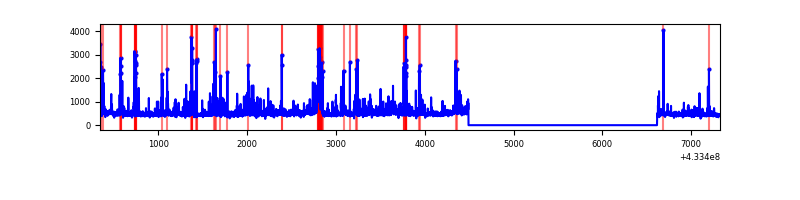 |
Top three noisy pixels from each quadrant. If the there are fewer than three noisy pixels in the level2.evt file, extra rows are filled as -1
| Pixel properties | Quadrant properties | ||||||
|---|---|---|---|---|---|---|---|
| Quadrant | DetID | PixID | Counts | Sigma | Mean | Median | Sigma |
| A | 15 | 237 | 533815 | 4746.09 | 543 | 533 | 112.4 |
| A | 10 | 83 | 522345 | 4644.01 | 543 | 533 | 112.4 |
| A | 13 | 248 | 501720 | 4460.45 | 543 | 533 | 112.4 |
| B | 0 | 189 | 27478 | 252.0 | 552 | 536 | 106.9 |
| B | 5 | 255 | 16890 | 152.97 | 552 | 536 | 106.9 |
| B | 12 | 111 | 13110 | 117.61 | 552 | 536 | 106.9 |
| C | 15 | 214 | 203232 | 1567.45 | 549 | 552 | 129.3 |
| C | 14 | 254 | 72073 | 553.12 | 549 | 552 | 129.3 |
| C | 15 | 159 | 19872 | 149.41 | 549 | 552 | 129.3 |
| D | 1 | 52 | 347319 | 2548.58 | 549 | 534 | 136.1 |
| D | 12 | 16 | 235862 | 1729.46 | 549 | 534 | 136.1 |
| D | 1 | 20 | 44837 | 325.59 | 549 | 534 | 136.1 |
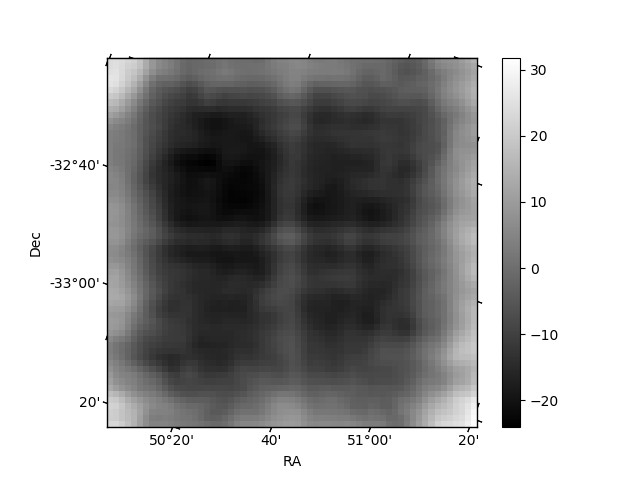
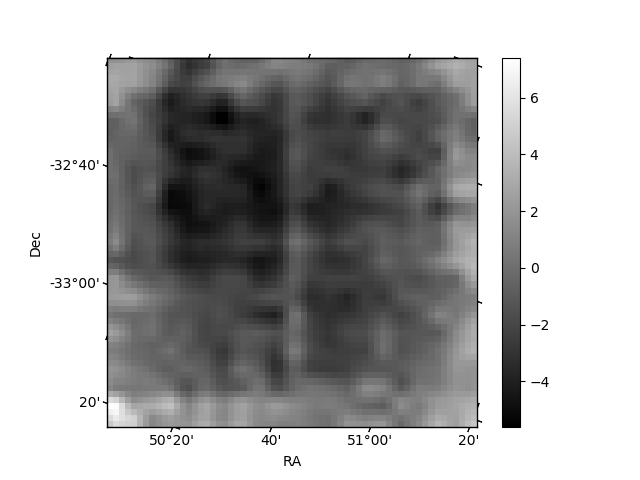
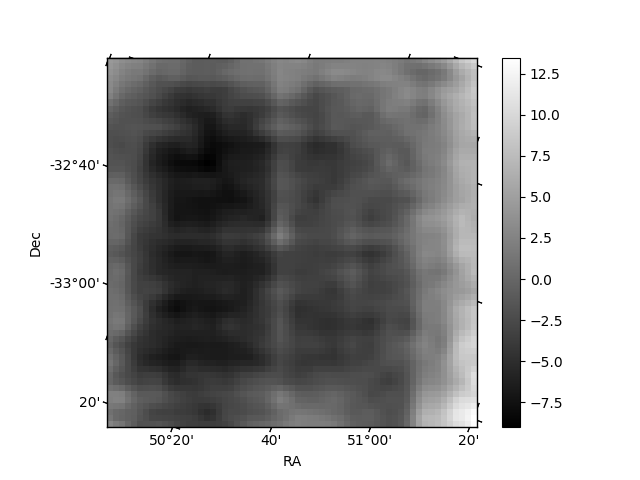
Histogram calculated using DETX and DETY for each event in the final _common_clean file
| Quadrant A | 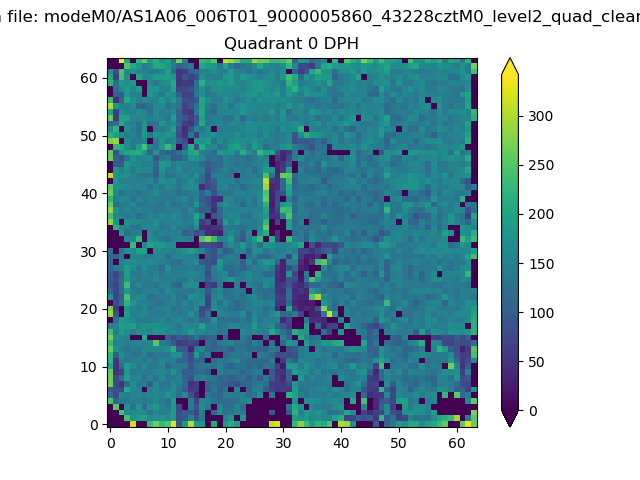 |
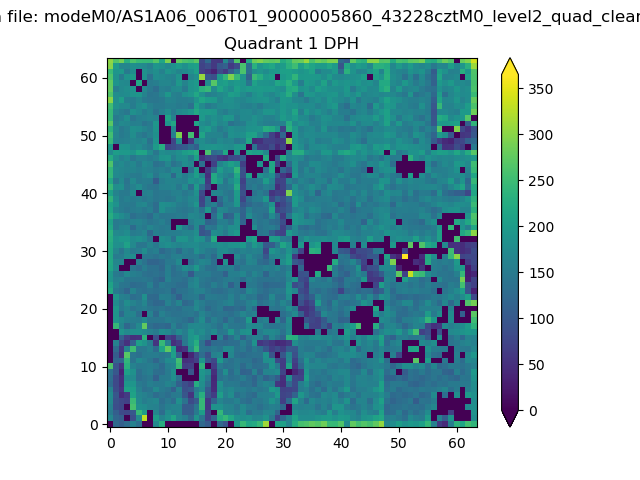 |
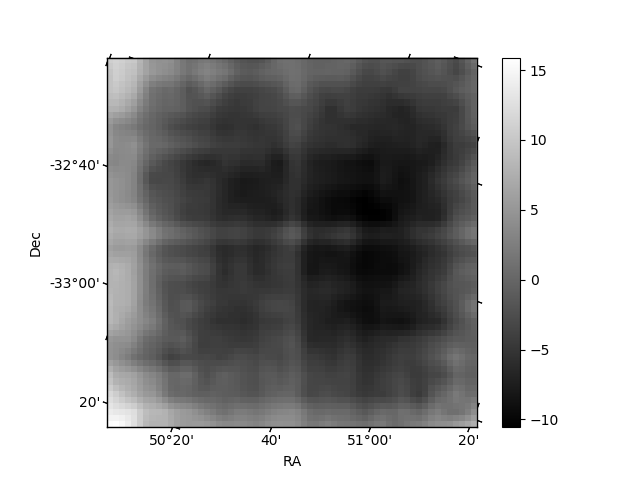
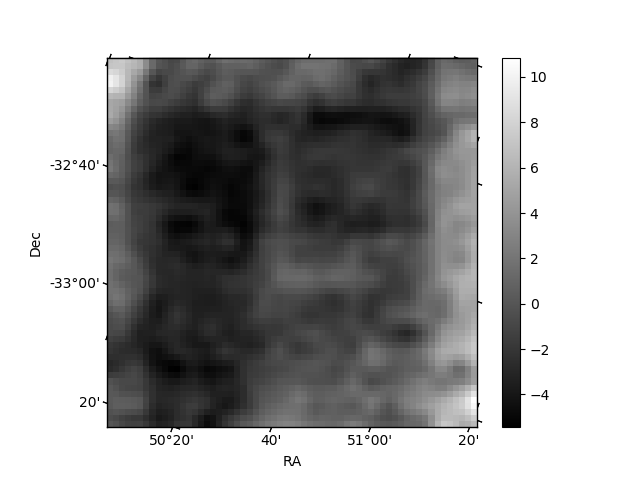
Quadrant B |
|---|---|---|---|
| Quadrant D | 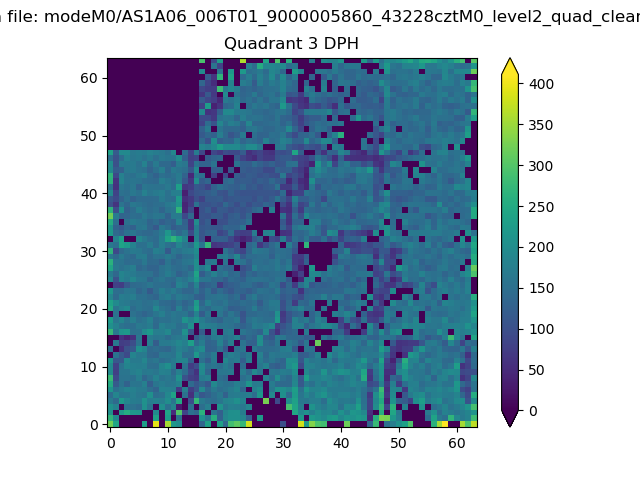 |
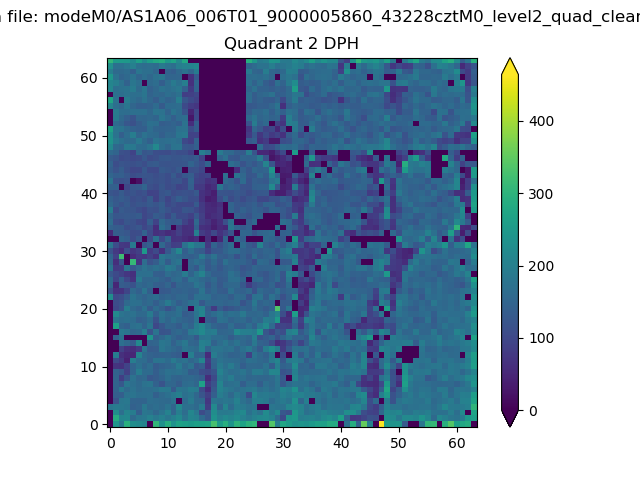 |
Quadrant C |
| Plot type | Count rate plots | Images |
|---|---|---|
| Comparison with Poisson distribution Blue bars denote a histogram of data divided into 1 sec bins. Red curve is a Poisson curve with rate = median count rate of data. |
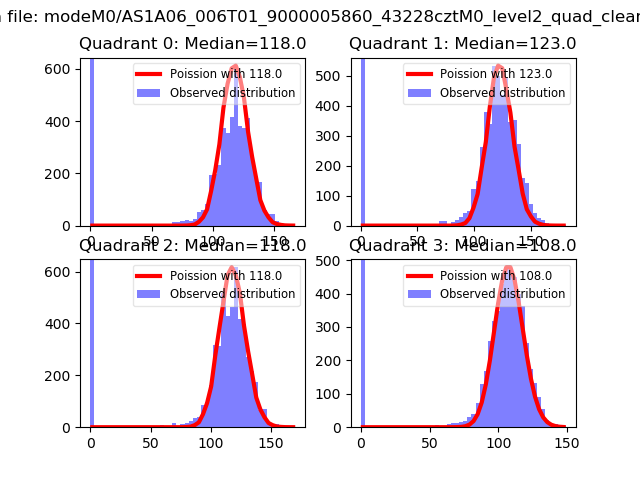 |
 |
| Quadrant-wise count rates Data is divided into 100 sec bins |
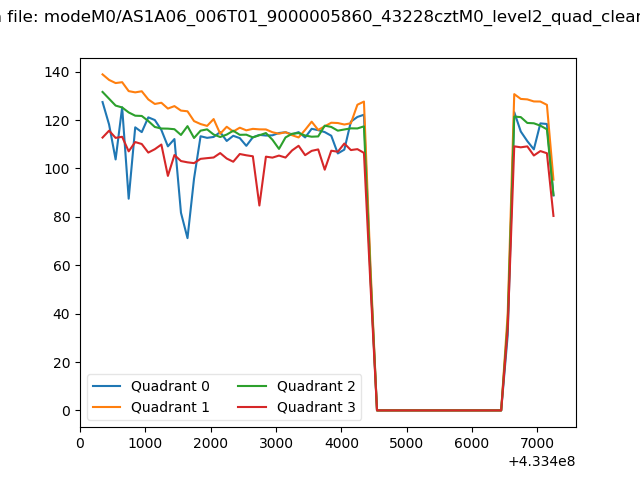 |
|
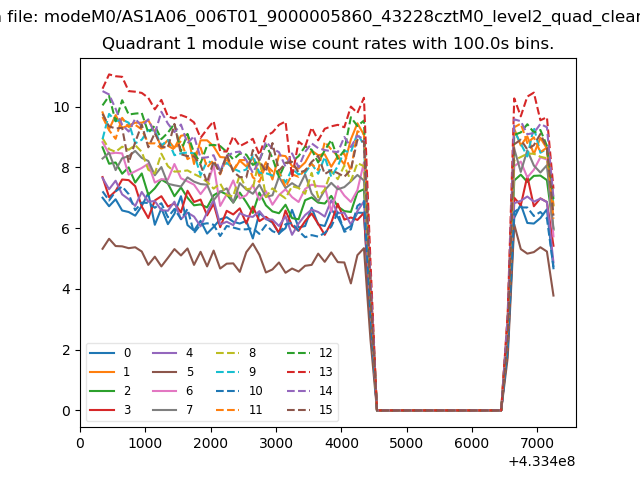
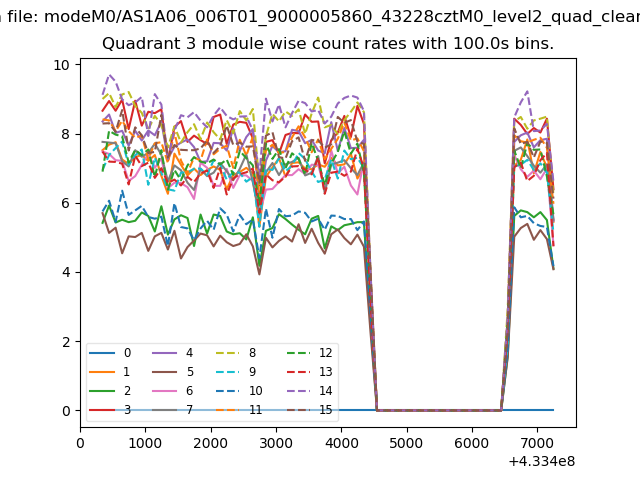
| Module-wise count rates for Quadrant A Data is divided into 100 sec bins |
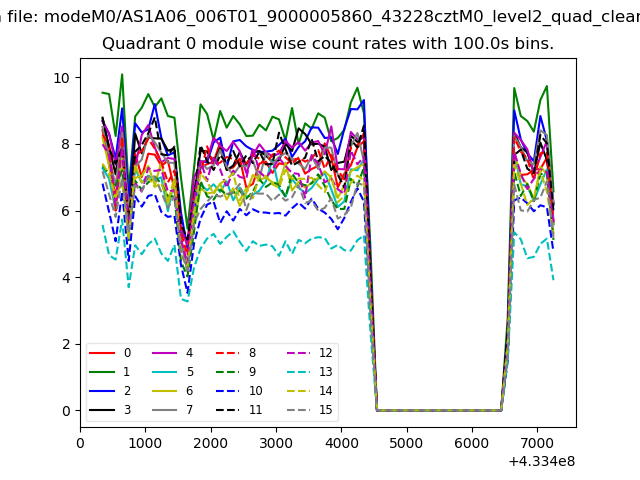 |
 |
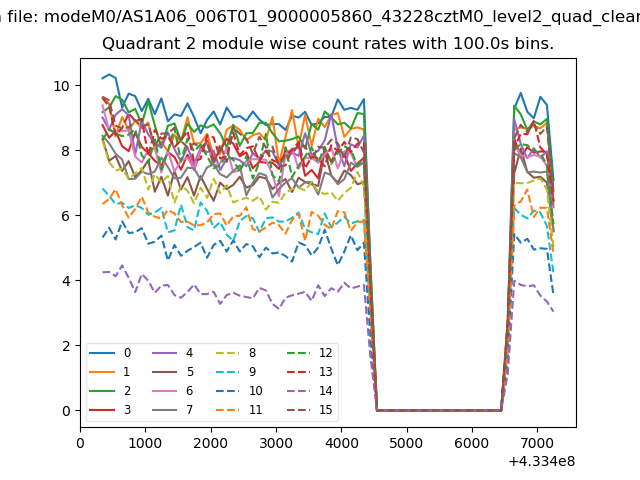
| Module-wise count rates for Quadrant B Data is divided into 100 sec bins |
 |
 |
| Module-wise count rates for Quadrant C Data is divided into 100 sec bins |
 |
 |
| Module-wise count rates for Quadrant D Data is divided into 100 sec bins |
 |
 |
| Parameter | Plot |
|---|---|
| CZT HV Monitor | 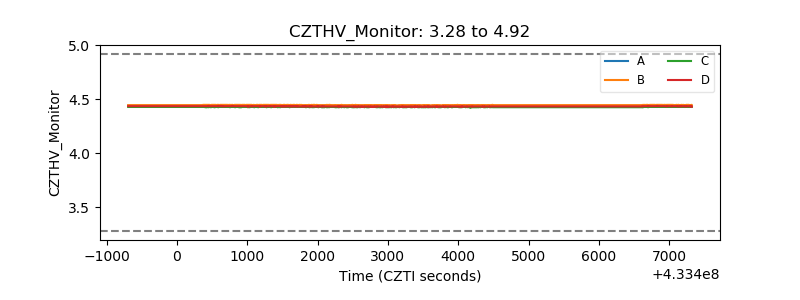 |
| D_VDD | 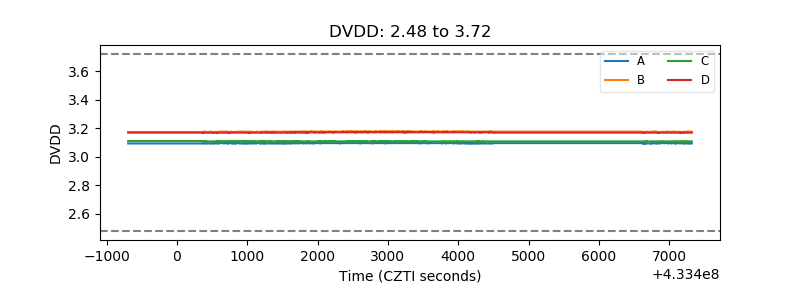 |
| Temperature 1 | 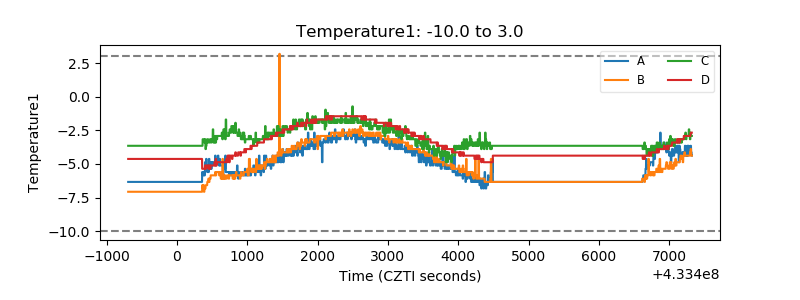 |
| Veto HV Monitor |  |
| Veto LLD | 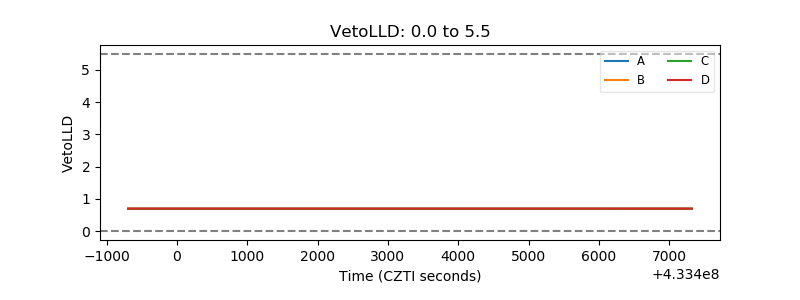 |
| Alpha Counter | 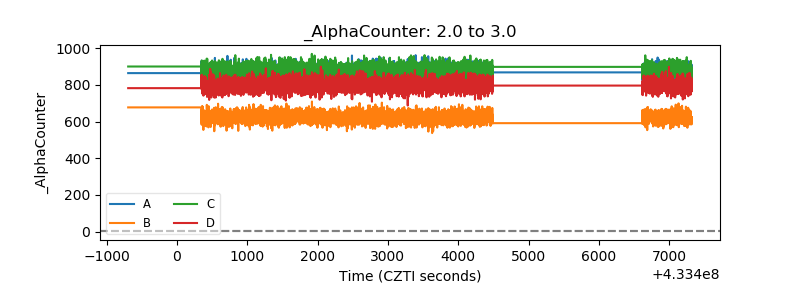 |
| _CPM_Rate | 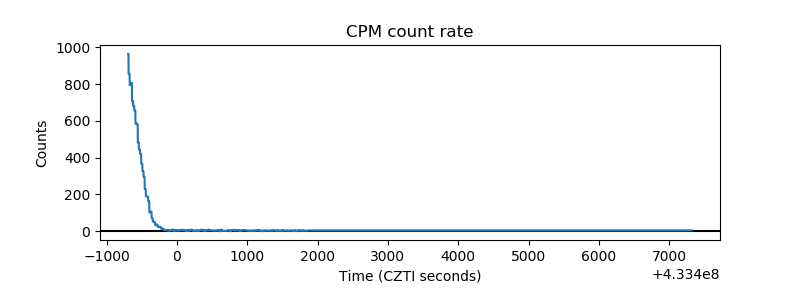 |
| CZT Counter | 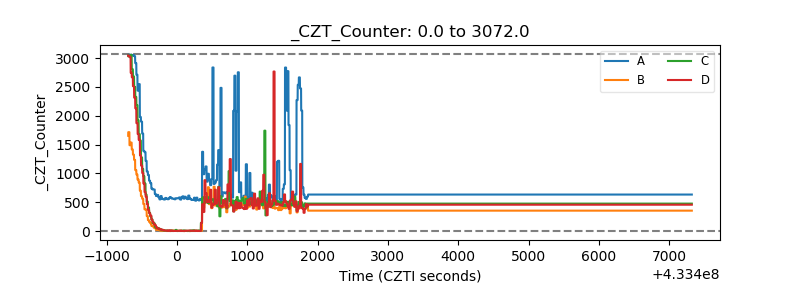 |
| +2.5 Volts monitor | 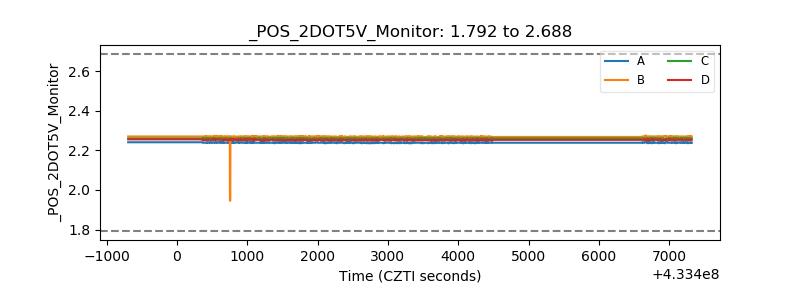 |
| +5 Volts monitor | 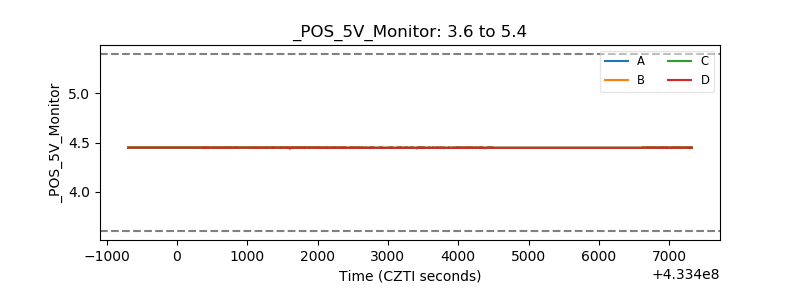 |
| _ROLL_ROT | 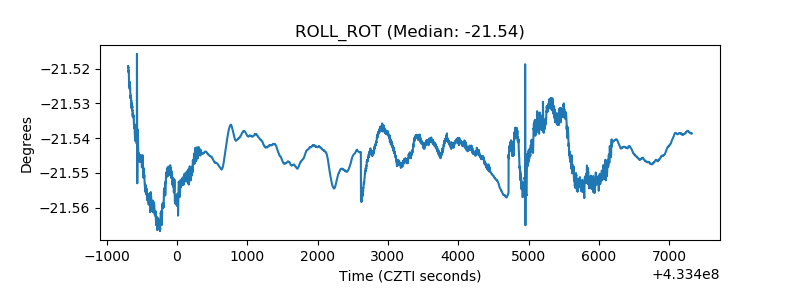 |
| _Roll_DEC | 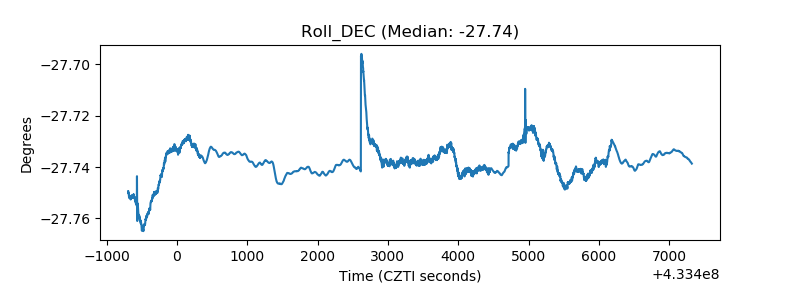 |
| _Roll_RA | 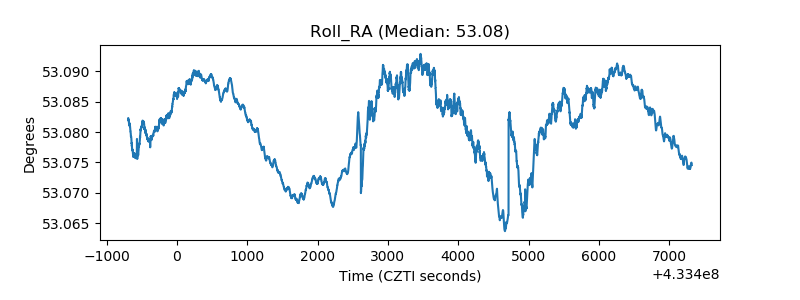 |
| Veto Counter | 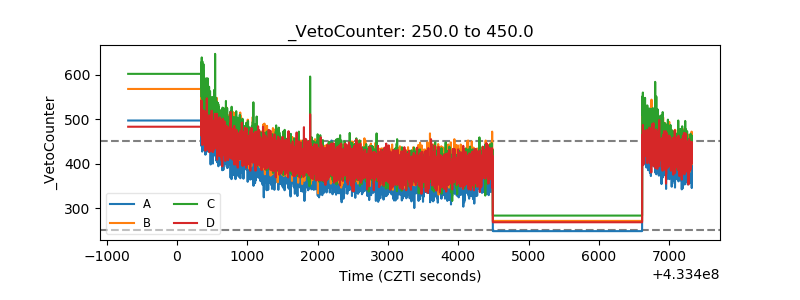 |