| Param | Original file | Final file |
|---|---|---|
| Filename | modeM0/AS1A06_006T01_9000005860_43229cztM0_level2.fits | modeM0/AS1A06_006T01_9000005860_43229cztM0_level2_quad_clean.evt |
| Size (bytes) | 295,300,800 | 83,151,360 |
| Size | 281.6 MB | 79.3 MB |
| Events in quadrant A | 3,121,863 | 549,427 |
| Events in quadrant B | 2,204,986 | 575,287 |
| Events in quadrant C | 2,600,661 | 549,508 |
| Events in quadrant D | 2,625,337 | 503,602 |
| Mode SS | |||
|---|---|---|---|
| Quadrant | BADHDUFLAG | Total packets | Discarded packets |
| A | 0 | 98 | 0 |
| B | 0 | 98 | 0 |
| C | 0 | 98 | 0 |
| D | 0 | 98 | 0 |
| Mode M9 | |||
|---|---|---|---|
| Quadrant | BADHDUFLAG | Total packets | Discarded packets |
| A | 0 | 27 | 0 |
| B | 0 | 28 | 0 |
| C | 0 | 28 | 0 |
| D | 0 | 28 | 0 |
| Mode M0 | |||
|---|---|---|---|
| Quadrant | BADHDUFLAG | Total packets | Discarded packets |
| A | 0 | 12275 | 2 |
| B | 0 | 9861 | 2 |
| C | 0 | 10598 | 2 |
| D | 0 | 11026 | 2 |
| Quadrant | Total seconds | Saturated seconds | Saturation percentage |
|---|---|---|---|
| A | 4851 | 74 | 1.525459% |
| B | 4850 | 9 | 0.185567% |
| C | 4850 | 39 | 0.804124% |
| D | 4850 | 66 | 1.360825% |
Noise dominated data is calculated using 1-second bins in cleaned event files. If a bin has >2000 counts, and if more than 50% of those come from <1% of pixels, then it is considered to be noise-dominated and hence unusable.
| Quadrant | # 1 sec bins | Bins with >0 counts | Bins with >2000 counts | High rate bins dominated by noise | Noise dominated (total time) | Noise dominated (detector-on time) | Marked lightcurve |
|---|---|---|---|---|---|---|---|
| A | 6974 | 4852 | 52 | 52 | 0.75% | 1.07% | 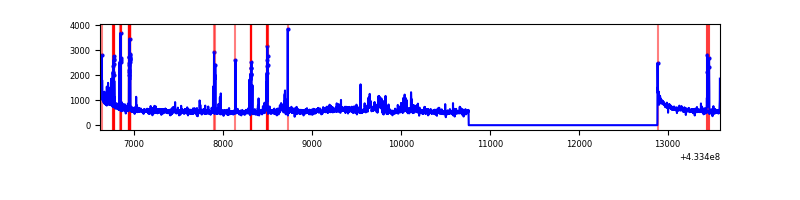 |
| B | 6973 | 4851 | 4 | 4 | 0.06% | 0.08% | 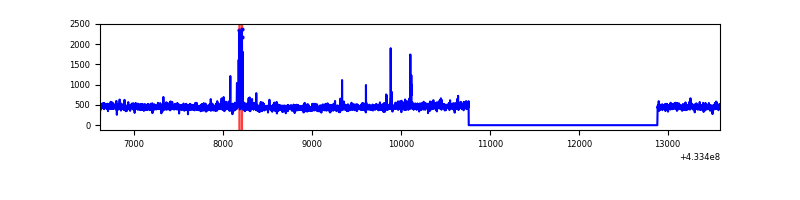 |
| C | 6973 | 4851 | 36 | 36 | 0.52% | 0.74% | 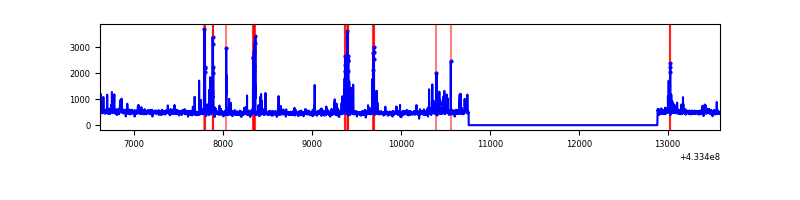 |
| D | 6973 | 4851 | 66 | 66 | 0.95% | 1.36% | 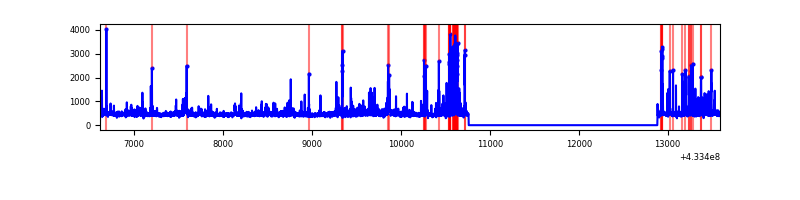 |
Top three noisy pixels from each quadrant. If the there are fewer than three noisy pixels in the level2.evt file, extra rows are filled as -1
| Pixel properties | Quadrant properties | ||||||
|---|---|---|---|---|---|---|---|
| Quadrant | DetID | PixID | Counts | Sigma | Mean | Median | Sigma |
| A | 10 | 83 | 545818 | 4808.1 | 547 | 535 | 113.4 |
| A | 15 | 237 | 181977 | 1599.89 | 547 | 535 | 113.4 |
| A | 12 | 189 | 179419 | 1577.33 | 547 | 535 | 113.4 |
| B | 5 | 172 | 41538 | 380.79 | 544 | 528 | 107.7 |
| B | 5 | 255 | 22029 | 199.64 | 544 | 528 | 107.7 |
| B | 12 | 111 | 13044 | 116.21 | 544 | 528 | 107.7 |
| C | 14 | 254 | 289176 | 2298.21 | 538 | 542 | 125.6 |
| C | 15 | 214 | 205010 | 1628.05 | 538 | 542 | 125.6 |
| C | 3 | 233 | 6862 | 50.32 | 538 | 542 | 125.6 |
| D | 12 | 16 | 275045 | 2070.5 | 539 | 523 | 132.6 |
| D | 1 | 52 | 159124 | 1196.2 | 539 | 523 | 132.6 |
| D | 12 | 6 | 30358 | 225.02 | 539 | 523 | 132.6 |
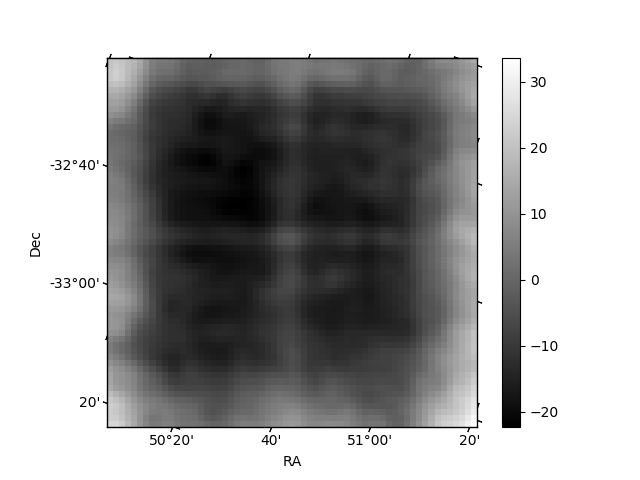
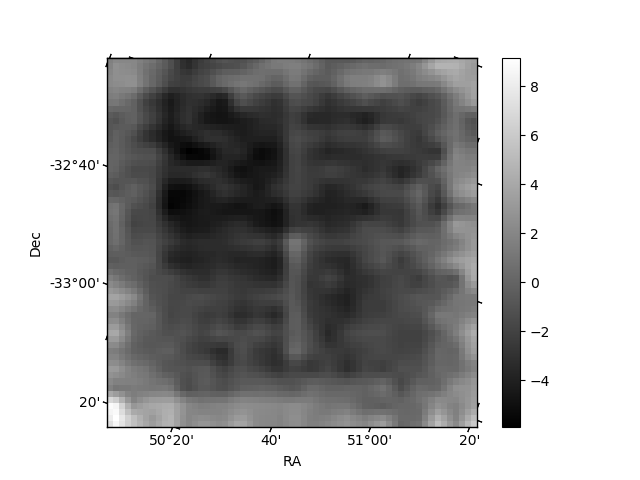
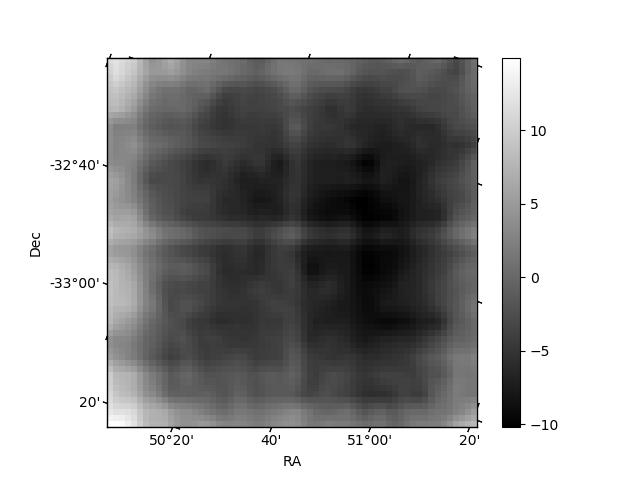
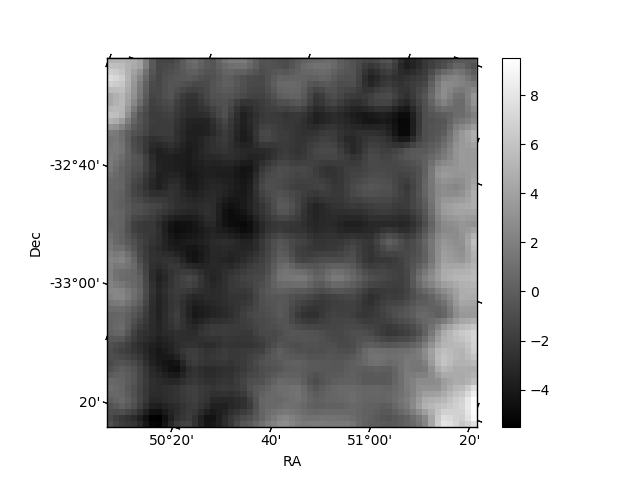
Histogram calculated using DETX and DETY for each event in the final _common_clean file
| Quadrant A | 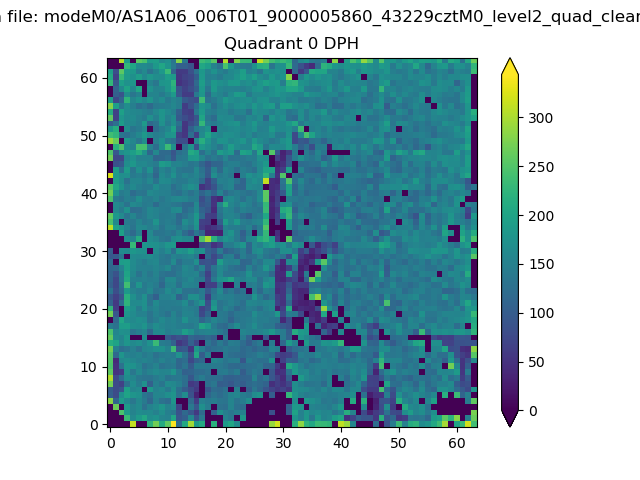 |
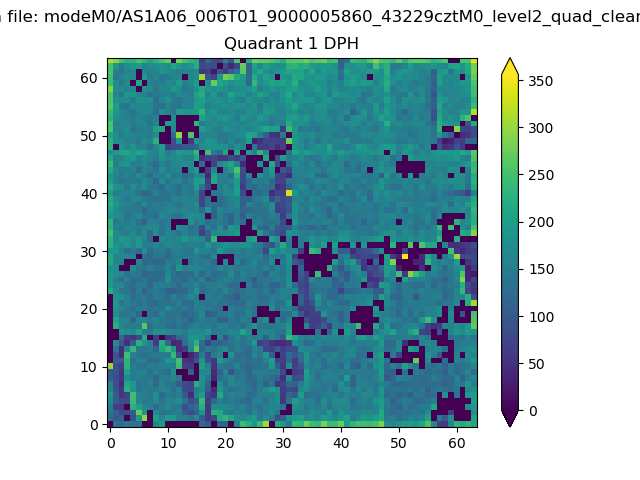 |
Quadrant B |
|---|---|---|---|
| Quadrant D | 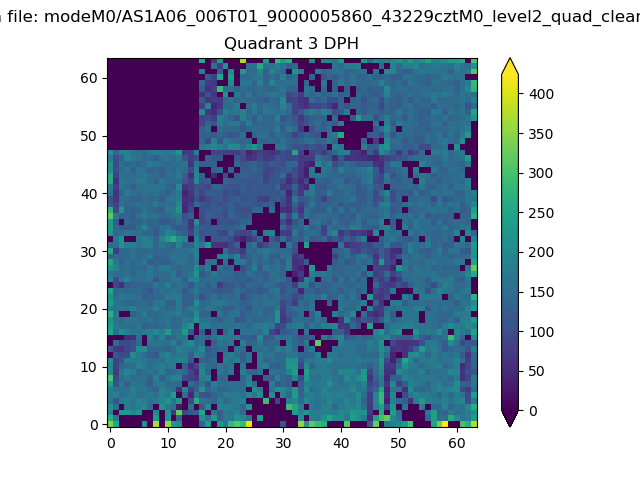 |
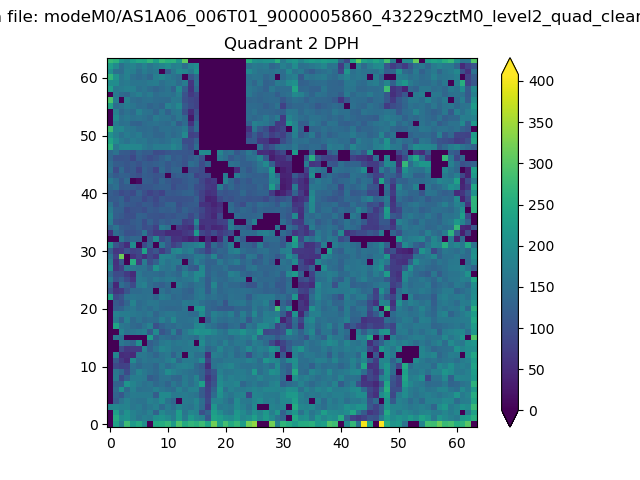 |
Quadrant C |
| Plot type | Count rate plots | Images |
|---|---|---|
| Comparison with Poisson distribution Blue bars denote a histogram of data divided into 1 sec bins. Red curve is a Poisson curve with rate = median count rate of data. |
 |
 |
| Quadrant-wise count rates Data is divided into 100 sec bins |
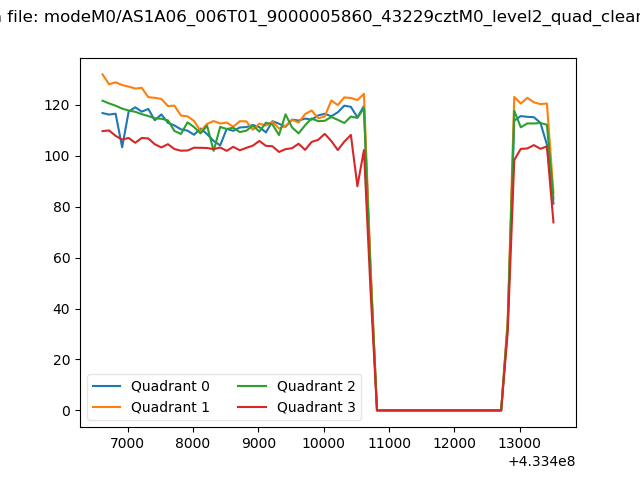 |
|
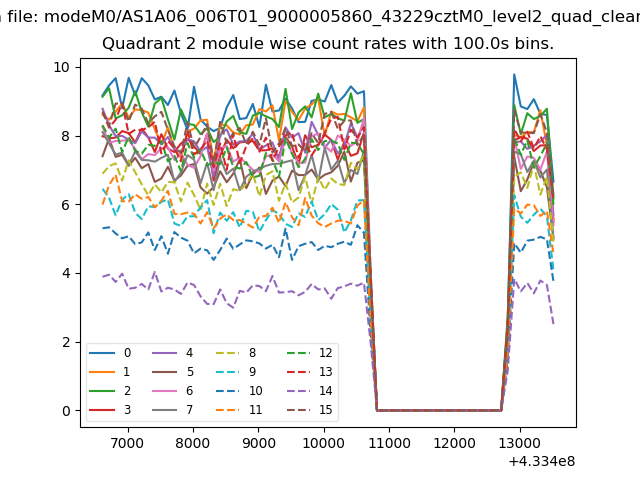
| Module-wise count rates for Quadrant A Data is divided into 100 sec bins |
 |
 |
| Module-wise count rates for Quadrant B Data is divided into 100 sec bins |
 |
 |
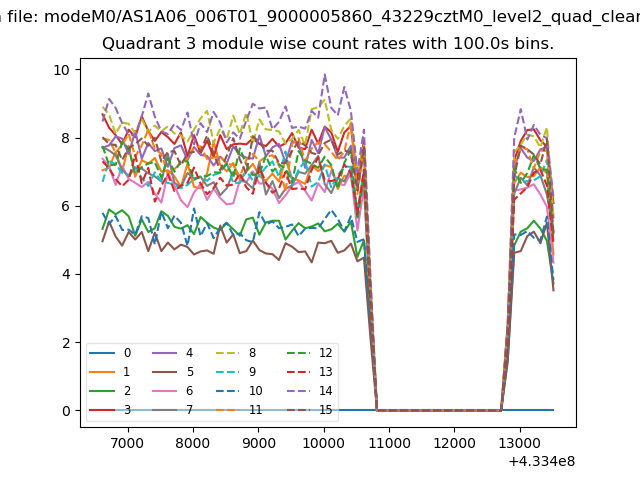
| Module-wise count rates for Quadrant C Data is divided into 100 sec bins |
 |
 |
| Module-wise count rates for Quadrant D Data is divided into 100 sec bins |
 |
 |
| Parameter | Plot |
|---|---|
| CZT HV Monitor | 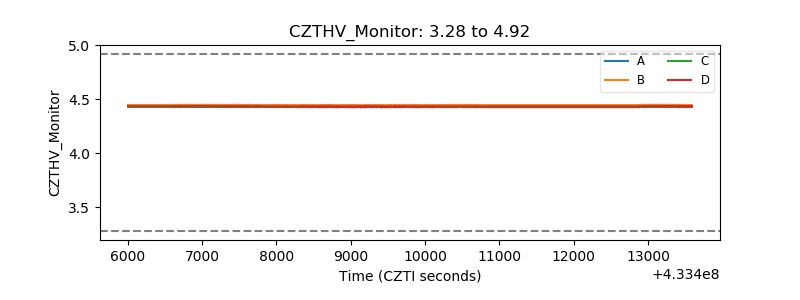 |
| D_VDD | 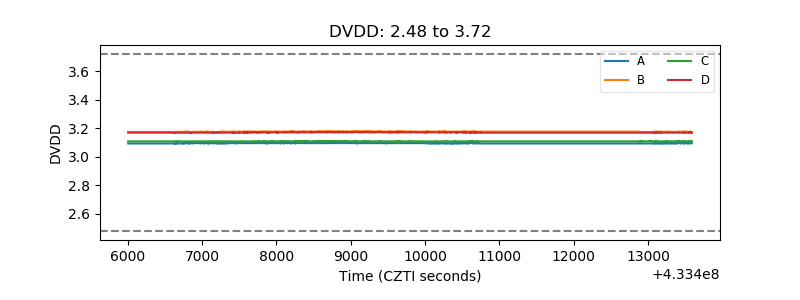 |
| Temperature 1 | 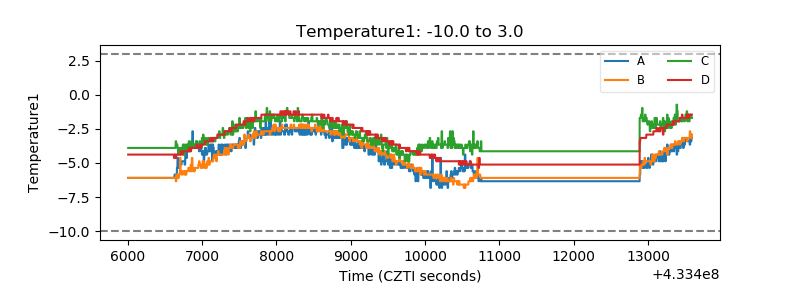 |
| Veto HV Monitor | 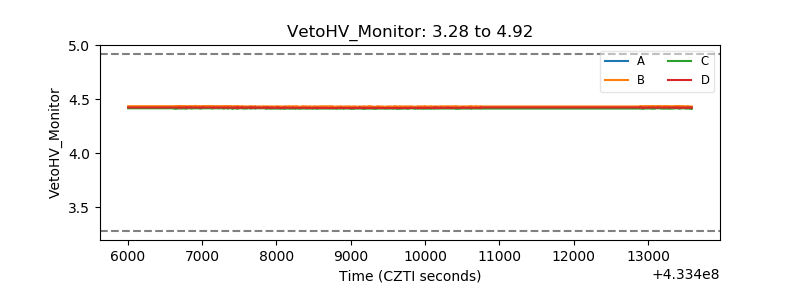 |
| Veto LLD | 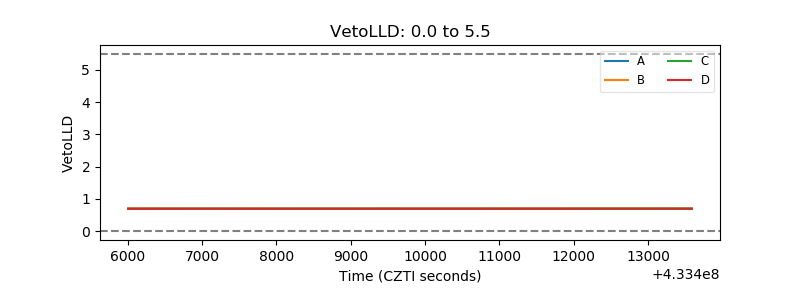 |
| Alpha Counter | 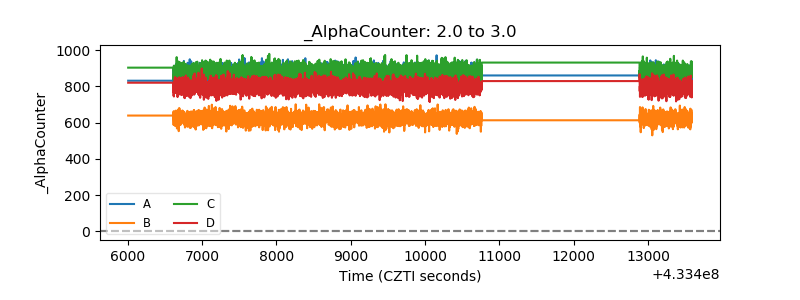 |
| _CPM_Rate | 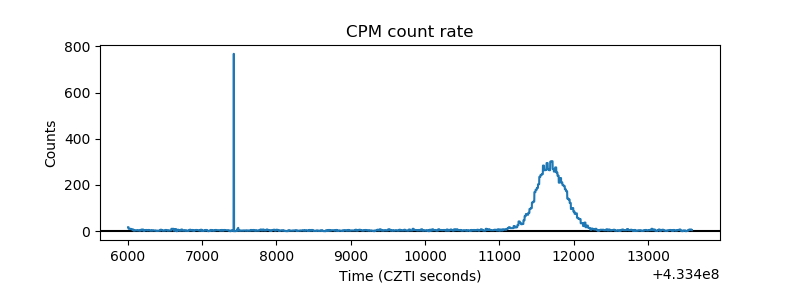 |
| CZT Counter | 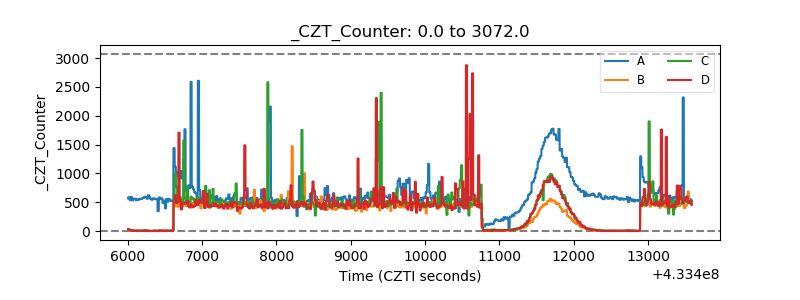 |
| +2.5 Volts monitor | 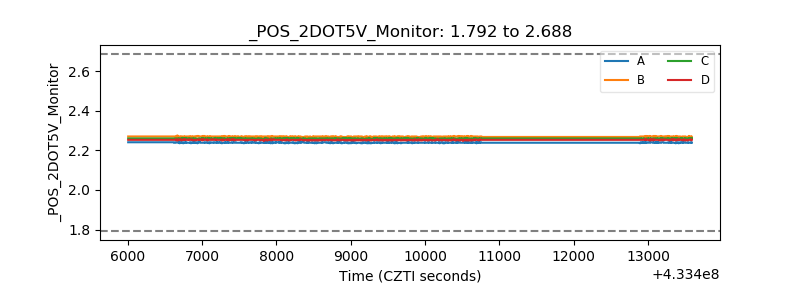 |
| +5 Volts monitor | 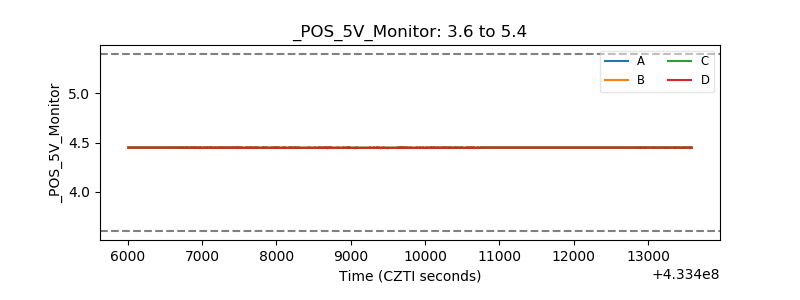 |
| _ROLL_ROT | 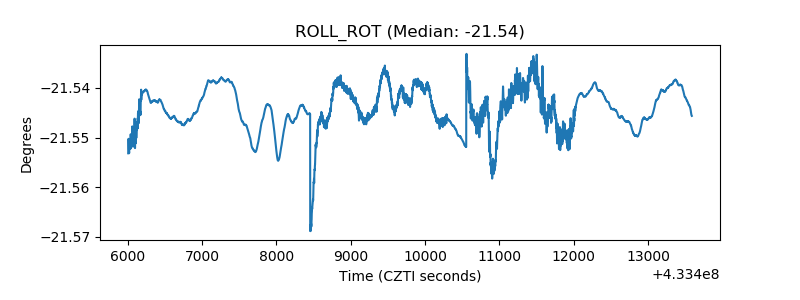 |
| _Roll_DEC | 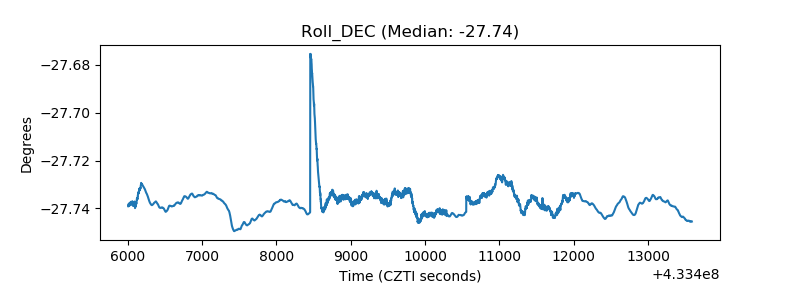 |
| _Roll_RA | 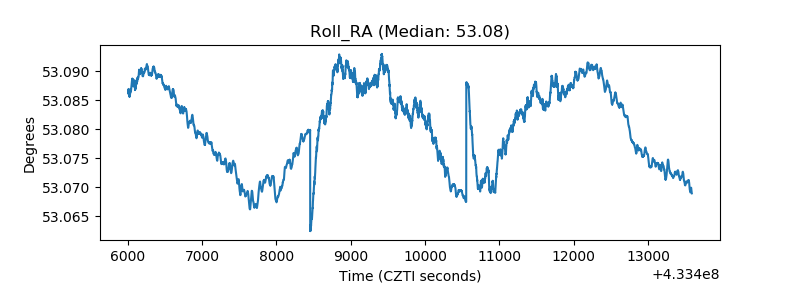 |
| Veto Counter |  |