| Param | Original file | Final file |
|---|---|---|
| Filename | modeM0/AS1A06_006T01_9000005860_43230cztM0_level2.fits | modeM0/AS1A06_006T01_9000005860_43230cztM0_level2_quad_clean.evt |
| Size (bytes) | 303,514,560 | 80,254,080 |
| Size | 289.5 MB | 76.5 MB |
| Events in quadrant A | 3,504,872 | 515,515 |
| Events in quadrant B | 2,189,771 | 553,662 |
| Events in quadrant C | 2,492,408 | 532,445 |
| Events in quadrant D | 2,669,050 | 487,453 |
| Mode SS | |||
|---|---|---|---|
| Quadrant | BADHDUFLAG | Total packets | Discarded packets |
| A | 0 | 100 | 0 |
| B | 0 | 100 | 0 |
| C | 0 | 100 | 0 |
| D | 0 | 100 | 0 |
| Mode M9 | |||
|---|---|---|---|
| Quadrant | BADHDUFLAG | Total packets | Discarded packets |
| A | 0 | 37 | 0 |
| B | 0 | 38 | 0 |
| C | 0 | 38 | 0 |
| D | 0 | 38 | 0 |
| Mode M0 | |||
|---|---|---|---|
| Quadrant | BADHDUFLAG | Total packets | Discarded packets |
| A | 0 | 13326 | 2 |
| B | 0 | 9871 | 2 |
| C | 0 | 10337 | 2 |
| D | 0 | 11235 | 2 |
| Quadrant | Total seconds | Saturated seconds | Saturation percentage |
|---|---|---|---|
| A | 4858 | 250 | 5.146151% |
| B | 4858 | 13 | 0.267600% |
| C | 4858 | 7 | 0.144092% |
| D | 4858 | 79 | 1.626184% |
Noise dominated data is calculated using 1-second bins in cleaned event files. If a bin has >2000 counts, and if more than 50% of those come from <1% of pixels, then it is considered to be noise-dominated and hence unusable.
| Quadrant | # 1 sec bins | Bins with >0 counts | Bins with >2000 counts | High rate bins dominated by noise | Noise dominated (total time) | Noise dominated (detector-on time) | Marked lightcurve |
|---|---|---|---|---|---|---|---|
| A | 6891 | 4859 | 227 | 227 | 3.29% | 4.67% | 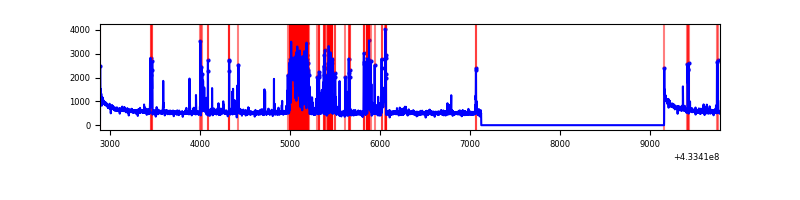 |
| B | 6891 | 4859 | 6 | 6 | 0.09% | 0.12% | 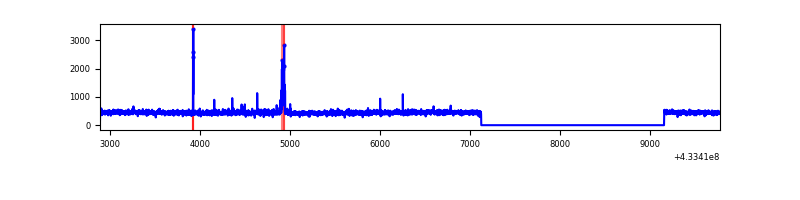 |
| C | 6891 | 4859 | 6 | 6 | 0.09% | 0.12% | 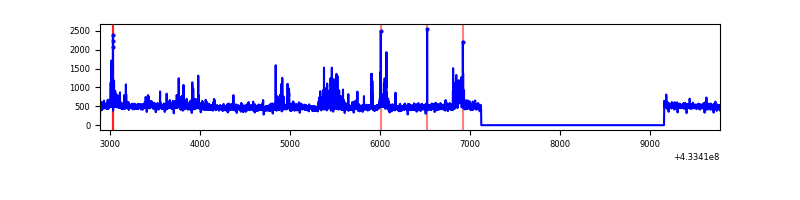 |
| D | 6891 | 4859 | 77 | 77 | 1.12% | 1.58% | 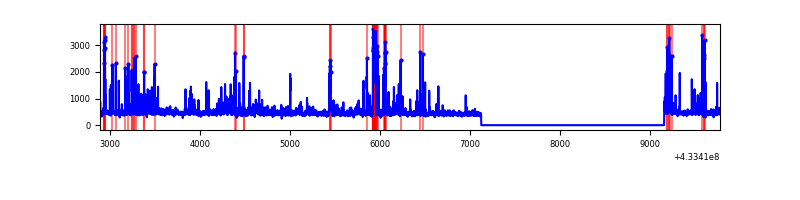 |
Top three noisy pixels from each quadrant. If the there are fewer than three noisy pixels in the level2.evt file, extra rows are filled as -1
| Pixel properties | Quadrant properties | ||||||
|---|---|---|---|---|---|---|---|
| Quadrant | DetID | PixID | Counts | Sigma | Mean | Median | Sigma |
| A | 13 | 248 | 549683 | 5017.78 | 529 | 517 | 109.4 |
| A | 10 | 83 | 537514 | 4906.59 | 529 | 517 | 109.4 |
| A | 15 | 237 | 299409 | 2731.0 | 529 | 517 | 109.4 |
| B | 0 | 186 | 34077 | 317.85 | 534 | 520 | 105.6 |
| B | 0 | 189 | 23897 | 221.43 | 534 | 520 | 105.6 |
| B | 15 | 35 | 18993 | 174.98 | 534 | 520 | 105.6 |
| C | 15 | 214 | 213786 | 1726.31 | 527 | 530 | 123.5 |
| C | 14 | 254 | 208177 | 1680.91 | 527 | 530 | 123.5 |
| C | 3 | 233 | 5702 | 41.87 | 527 | 530 | 123.5 |
| D | 1 | 52 | 285533 | 2192.63 | 524 | 509 | 130.0 |
| D | 12 | 16 | 253611 | 1947.06 | 524 | 509 | 130.0 |
| D | 12 | 0 | 33356 | 252.68 | 524 | 509 | 130.0 |
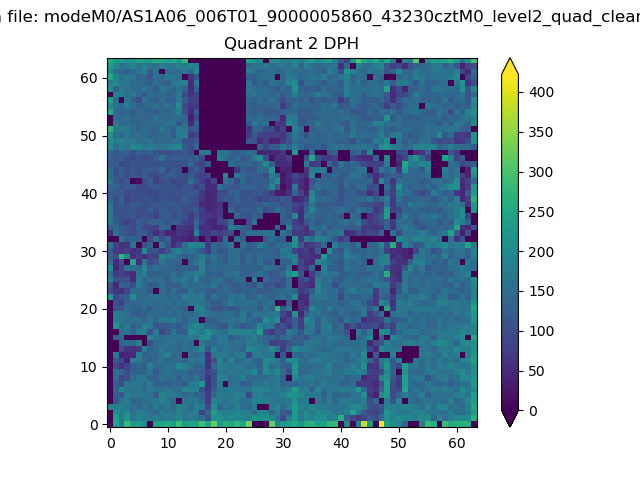
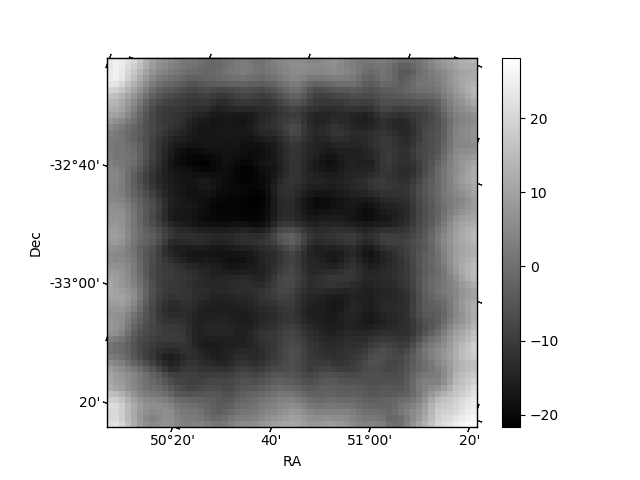
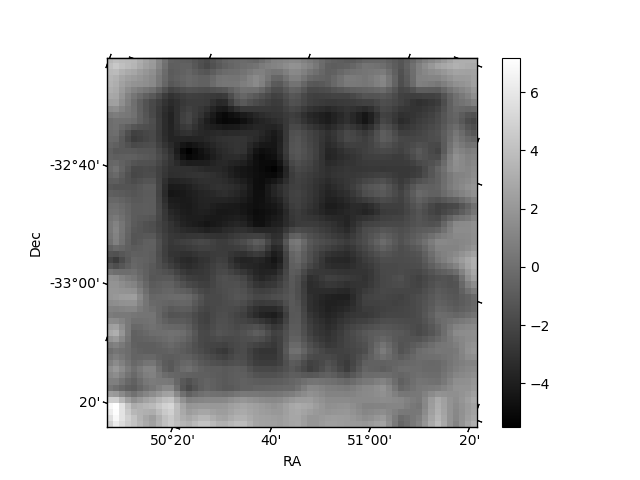
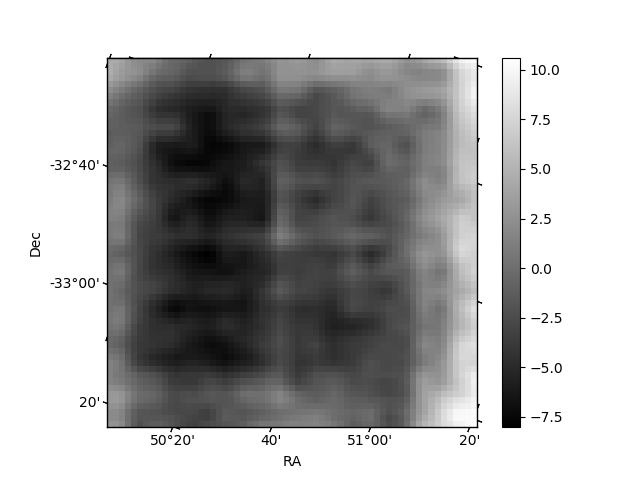
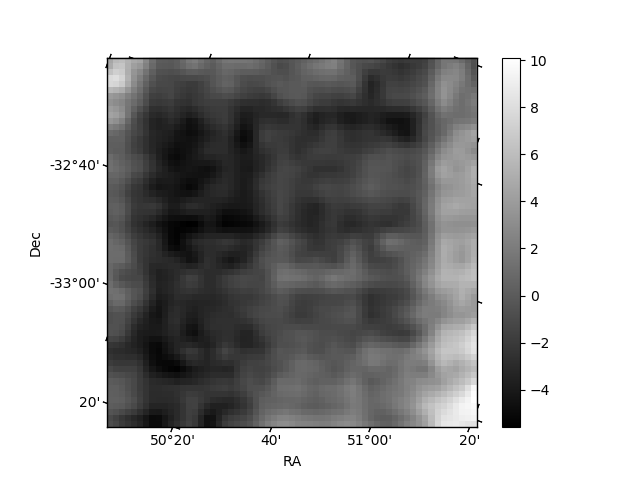
Histogram calculated using DETX and DETY for each event in the final _common_clean file
| Quadrant A | 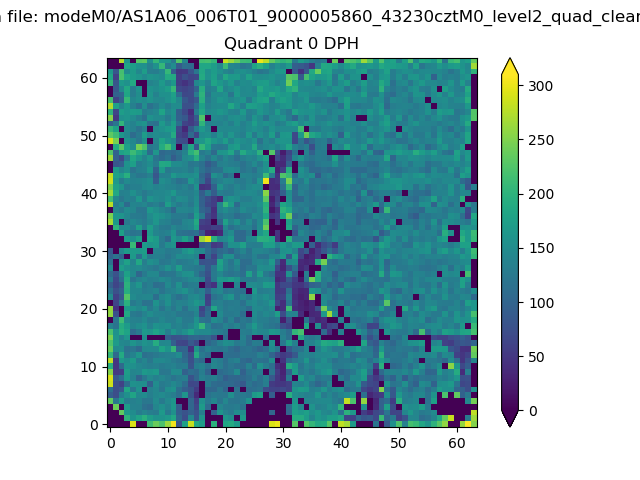 |
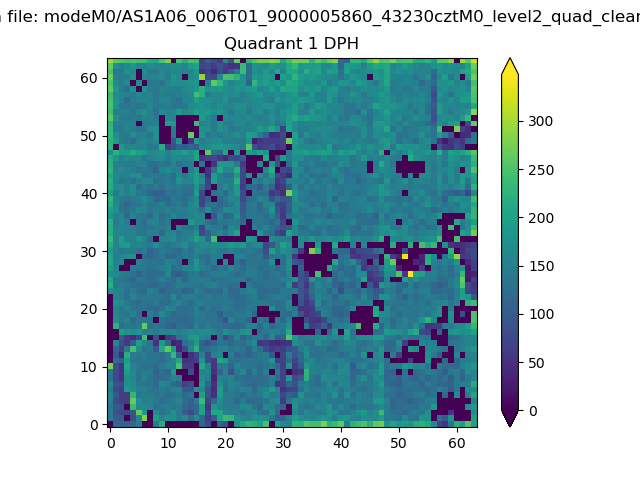 |
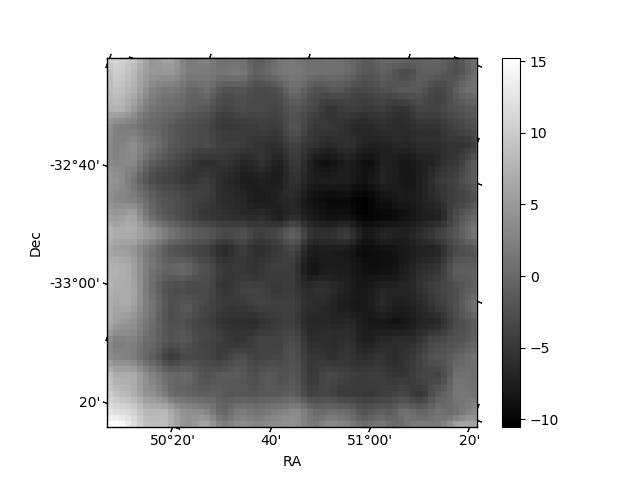
Quadrant B |
|---|---|---|---|
| Quadrant D | 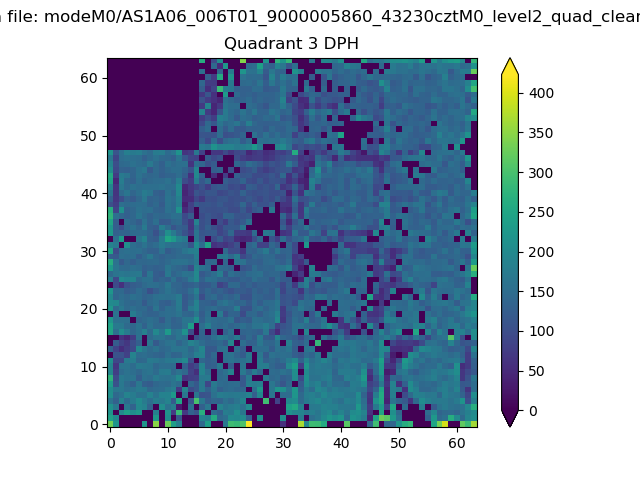 |
 |
Quadrant C |
| Plot type | Count rate plots | Images |
|---|---|---|
| Comparison with Poisson distribution Blue bars denote a histogram of data divided into 1 sec bins. Red curve is a Poisson curve with rate = median count rate of data. |
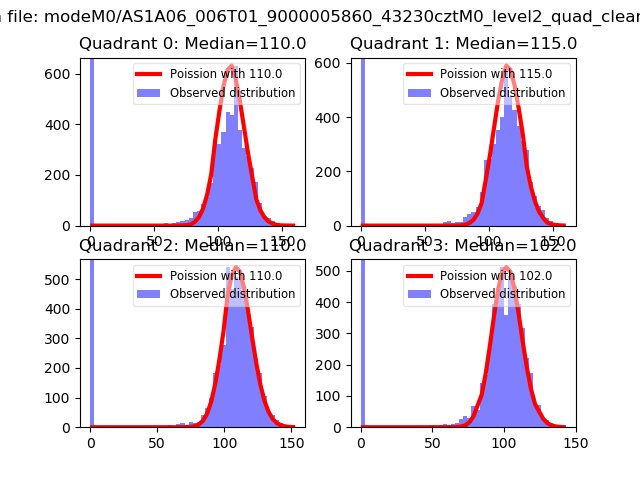 |
 |
| Quadrant-wise count rates Data is divided into 100 sec bins |
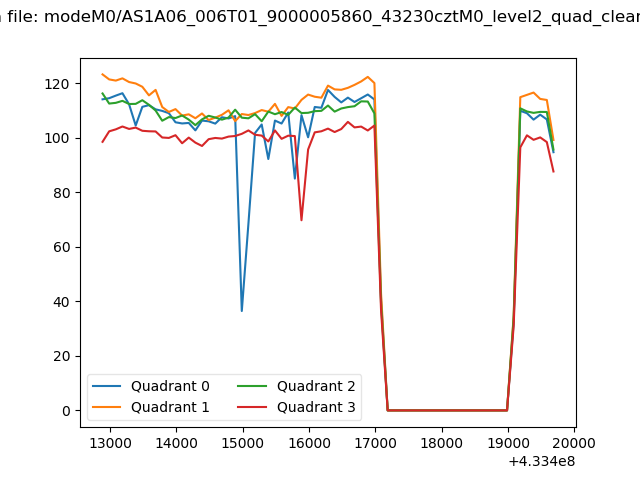 |
|
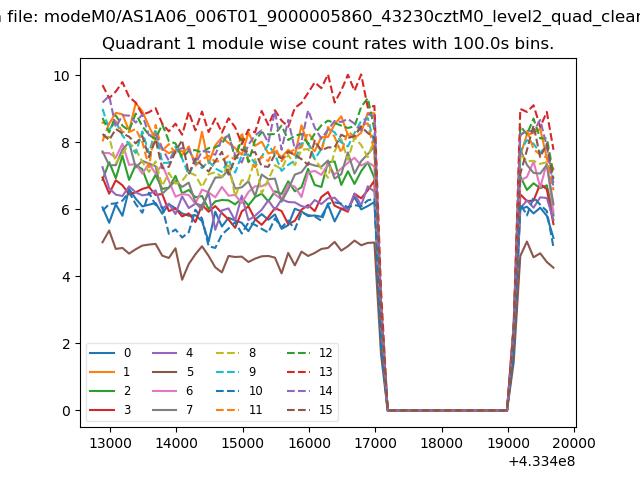
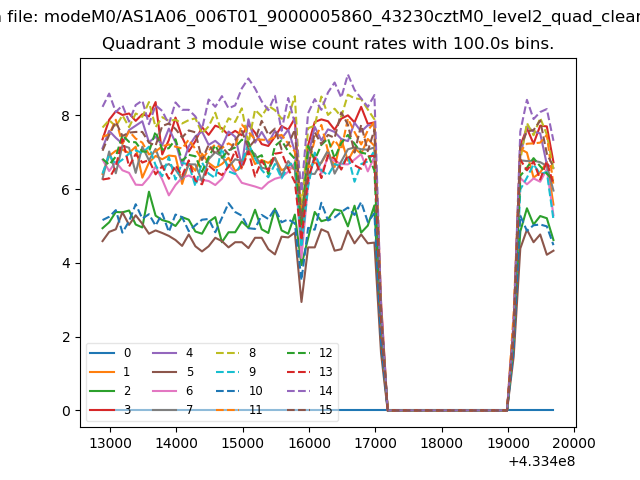
| Module-wise count rates for Quadrant A Data is divided into 100 sec bins |
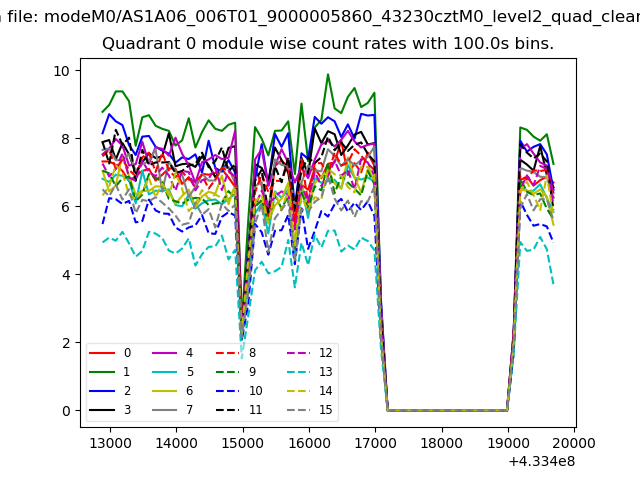 |
 |
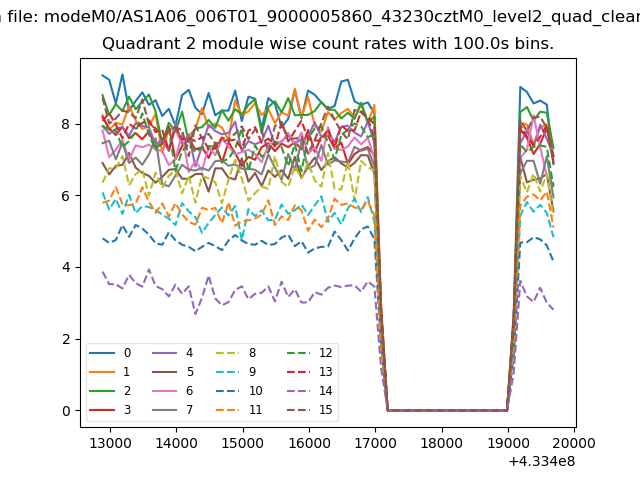
| Module-wise count rates for Quadrant B Data is divided into 100 sec bins |
 |
 |
| Module-wise count rates for Quadrant C Data is divided into 100 sec bins |
 |
 |
| Module-wise count rates for Quadrant D Data is divided into 100 sec bins |
 |
 |
| Parameter | Plot |
|---|---|
| CZT HV Monitor | 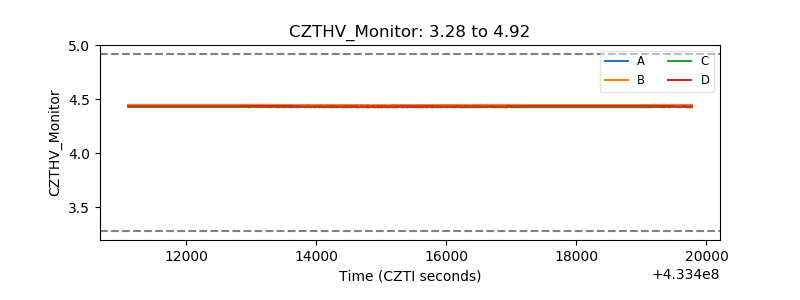 |
| D_VDD | 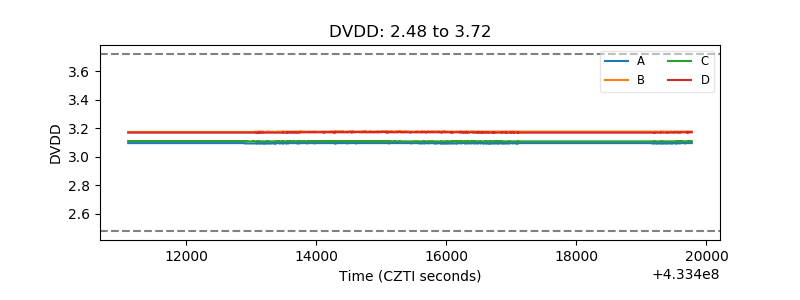 |
| Temperature 1 | 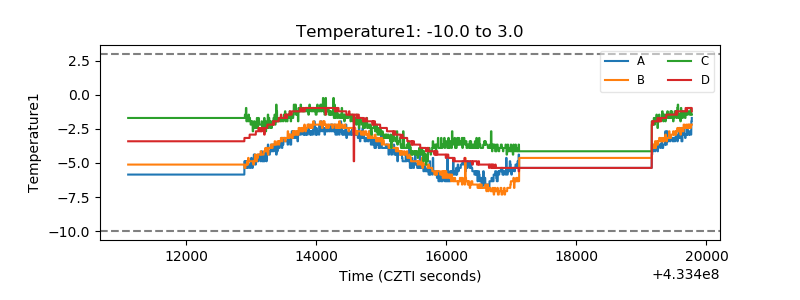 |
| Veto HV Monitor |  |
| Veto LLD | 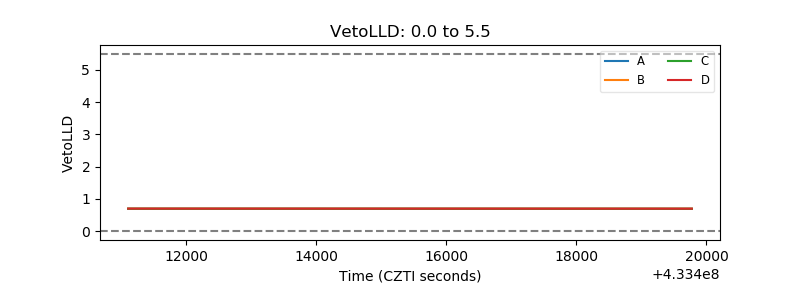 |
| Alpha Counter | 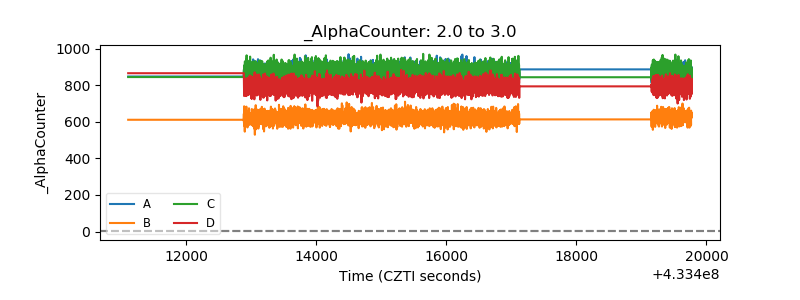 |
| _CPM_Rate | 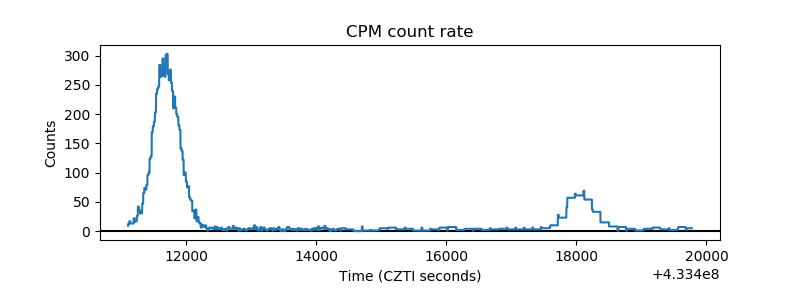 |
| CZT Counter | 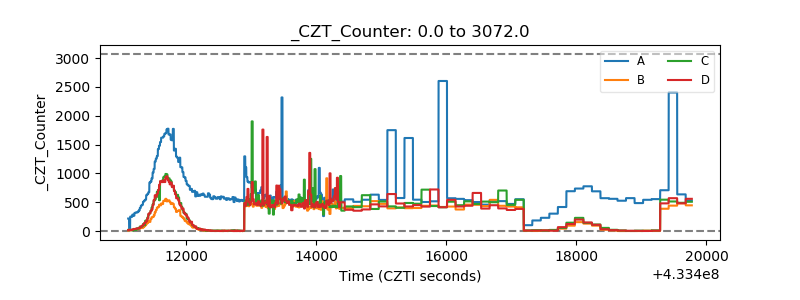 |
| +2.5 Volts monitor | 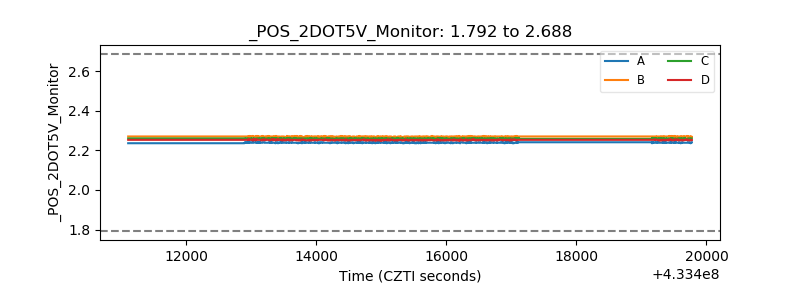 |
| +5 Volts monitor | 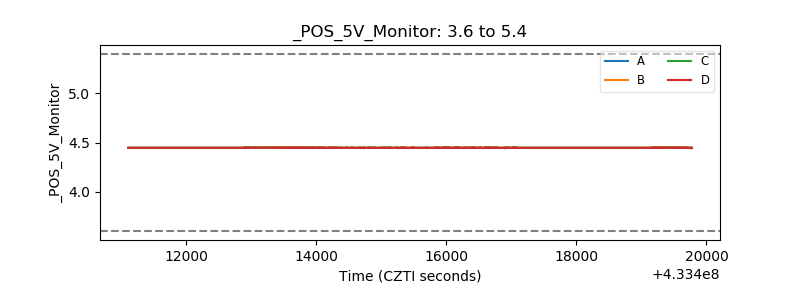 |
| _ROLL_ROT | 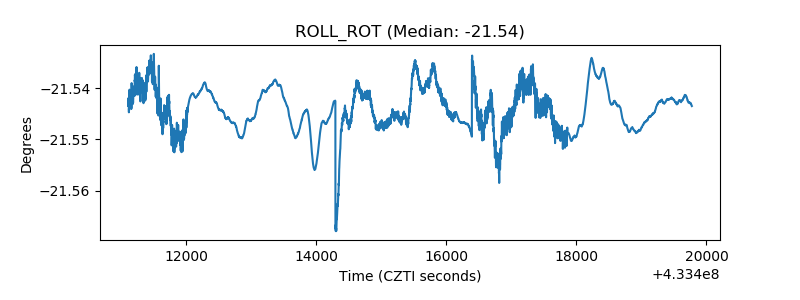 |
| _Roll_DEC | 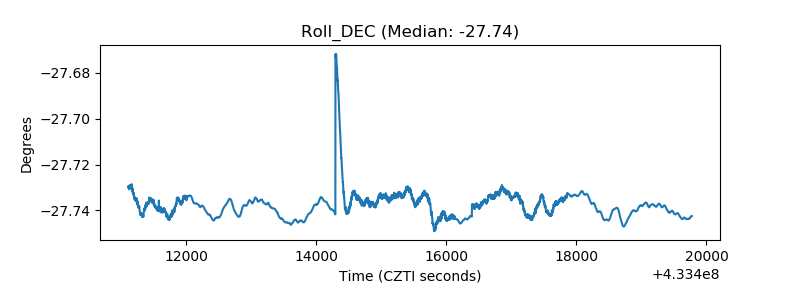 |
| _Roll_RA | 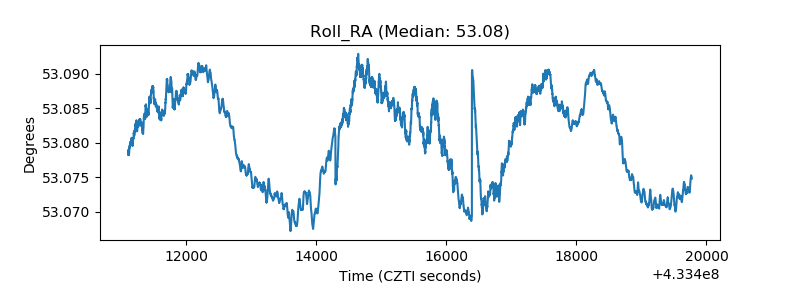 |
| Veto Counter | 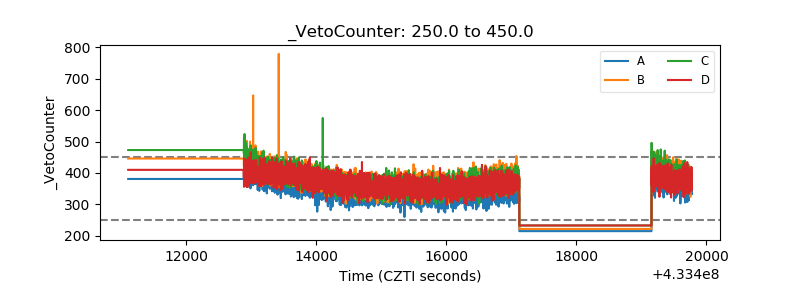 |