| Param | Original file | Final file |
|---|---|---|
| Filename | modeM0/AS1A06_006T01_9000005860_43231cztM0_level2.fits | modeM0/AS1A06_006T01_9000005860_43231cztM0_level2_quad_clean.evt |
| Size (bytes) | 317,626,560 | 92,007,360 |
| Size | 302.9 MB | 87.7 MB |
| Events in quadrant A | 3,324,842 | 604,103 |
| Events in quadrant B | 2,450,710 | 624,723 |
| Events in quadrant C | 2,783,945 | 603,679 |
| Events in quadrant D | 2,757,491 | 557,830 |
| Mode SS | |||
|---|---|---|---|
| Quadrant | BADHDUFLAG | Total packets | Discarded packets |
| A | 0 | 116 | 0 |
| B | 0 | 116 | 0 |
| C | 0 | 116 | 0 |
| D | 0 | 116 | 0 |
| Mode M9 | |||
|---|---|---|---|
| Quadrant | BADHDUFLAG | Total packets | Discarded packets |
| A | 0 | 26 | 0 |
| B | 0 | 27 | 0 |
| C | 0 | 27 | 0 |
| D | 0 | 27 | 0 |
| Mode M0 | |||
|---|---|---|---|
| Quadrant | BADHDUFLAG | Total packets | Discarded packets |
| A | 0 | 13273 | 2 |
| B | 0 | 11357 | 2 |
| C | 0 | 11800 | 2 |
| D | 0 | 12259 | 2 |
| Quadrant | Total seconds | Saturated seconds | Saturation percentage |
|---|---|---|---|
| A | 5652 | 66 | 1.167728% |
| B | 5652 | 4 | 0.070771% |
| C | 5652 | 11 | 0.194621% |
| D | 5652 | 36 | 0.636943% |
Noise dominated data is calculated using 1-second bins in cleaned event files. If a bin has >2000 counts, and if more than 50% of those come from <1% of pixels, then it is considered to be noise-dominated and hence unusable.
| Quadrant | # 1 sec bins | Bins with >0 counts | Bins with >2000 counts | High rate bins dominated by noise | Noise dominated (total time) | Noise dominated (detector-on time) | Marked lightcurve |
|---|---|---|---|---|---|---|---|
| A | 7386 | 5653 | 44 | 44 | 0.60% | 0.78% | 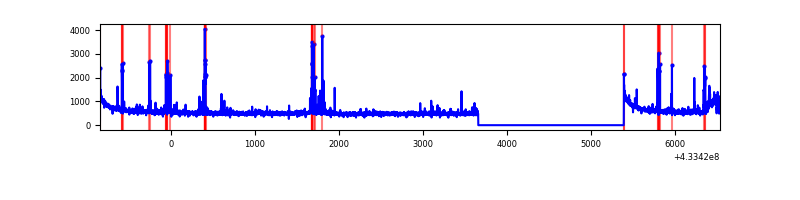 |
| B | 7386 | 5653 | 0 | 0 | 0.00% | 0.00% | 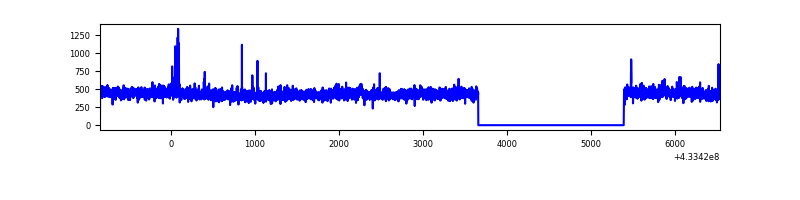 |
| C | 7386 | 5653 | 8 | 8 | 0.11% | 0.14% | 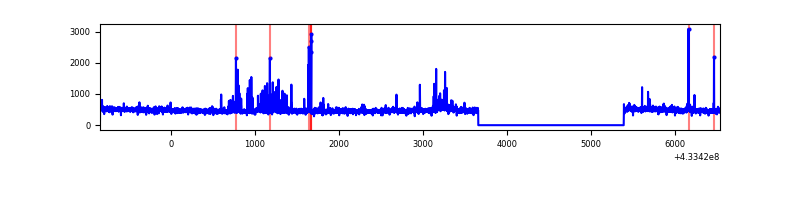 |
| D | 7386 | 5653 | 31 | 31 | 0.42% | 0.55% | 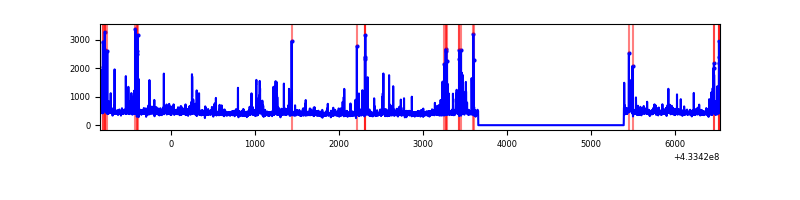 |
Top three noisy pixels from each quadrant. If the there are fewer than three noisy pixels in the level2.evt file, extra rows are filled as -1
| Pixel properties | Quadrant properties | ||||||
|---|---|---|---|---|---|---|---|
| Quadrant | DetID | PixID | Counts | Sigma | Mean | Median | Sigma |
| A | 10 | 83 | 613751 | 4849.81 | 611 | 596 | 126.4 |
| A | 15 | 237 | 159836 | 1259.53 | 611 | 596 | 126.4 |
| A | 13 | 248 | 148516 | 1169.99 | 611 | 596 | 126.4 |
| B | 0 | 189 | 15557 | 123.99 | 610 | 592 | 120.7 |
| B | 12 | 111 | 15112 | 120.31 | 610 | 592 | 120.7 |
| B | 11 | 111 | 14214 | 112.86 | 610 | 592 | 120.7 |
| C | 15 | 214 | 251561 | 1761.78 | 602 | 606 | 142.4 |
| C | 14 | 254 | 162691 | 1137.88 | 602 | 606 | 142.4 |
| C | 15 | 159 | 18597 | 126.3 | 602 | 606 | 142.4 |
| D | 1 | 52 | 187479 | 1249.66 | 602 | 583 | 149.6 |
| D | 2 | 249 | 61892 | 409.94 | 602 | 583 | 149.6 |
| D | 12 | 6 | 56081 | 371.08 | 602 | 583 | 149.6 |
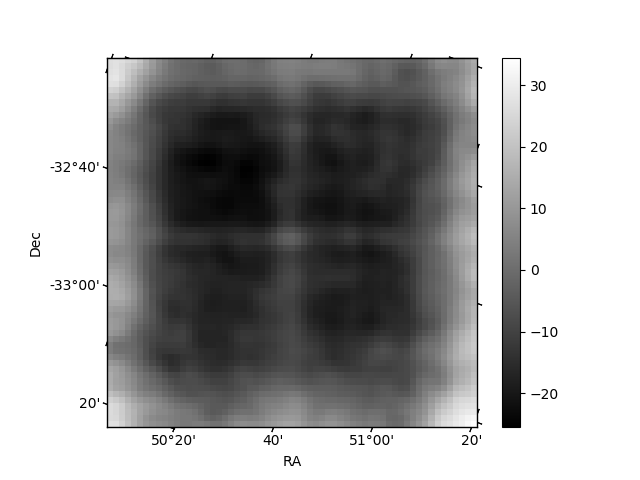
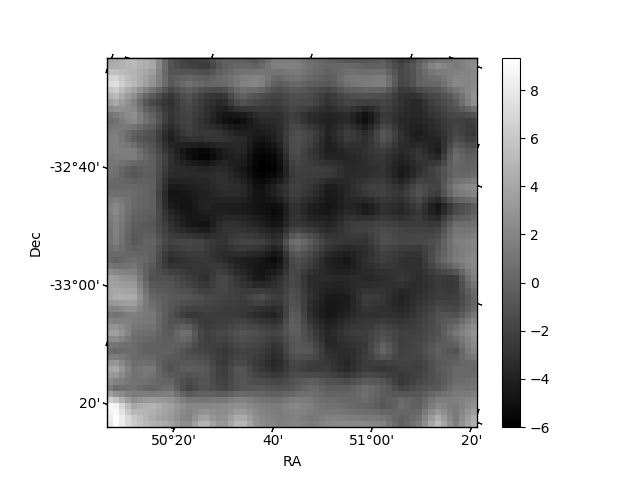
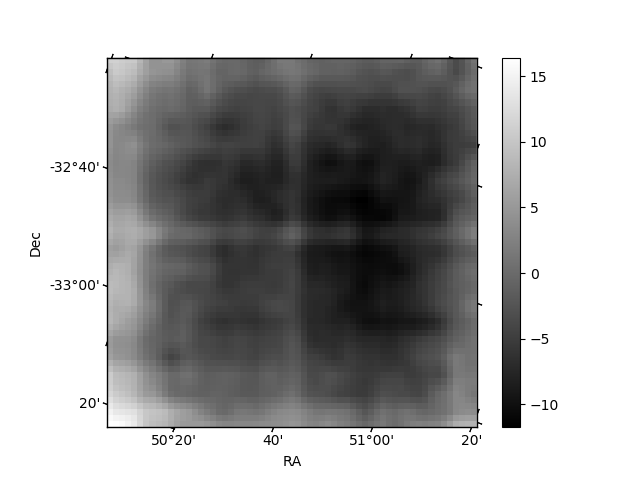
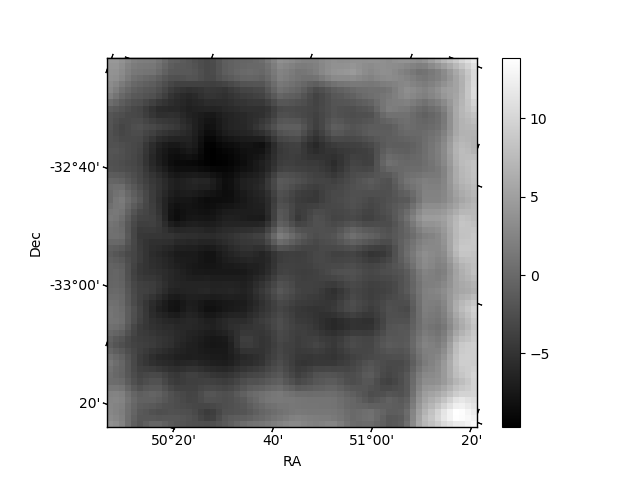
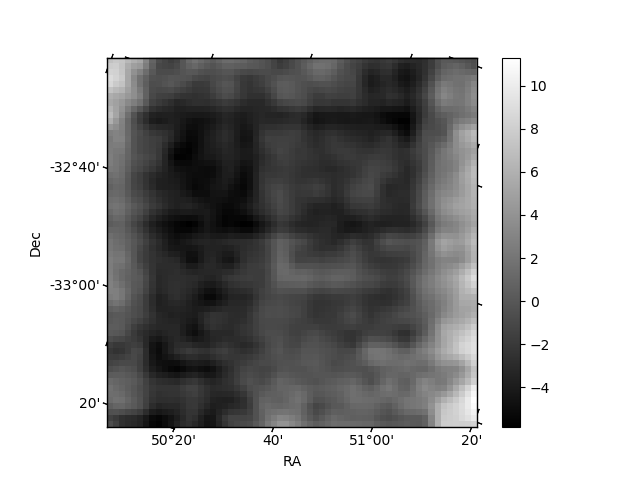
Histogram calculated using DETX and DETY for each event in the final _common_clean file
| Quadrant A | 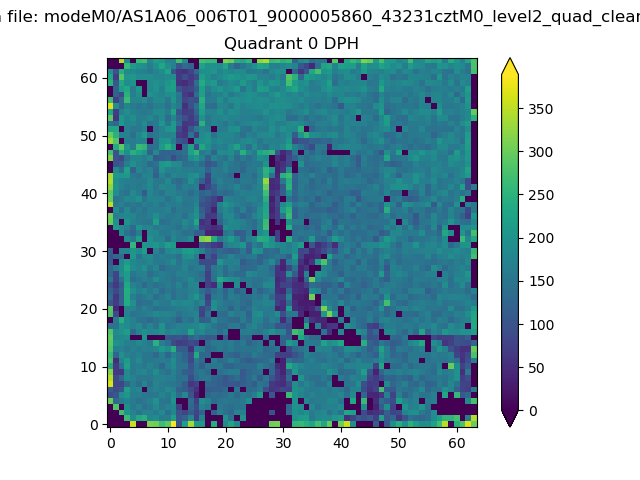 |
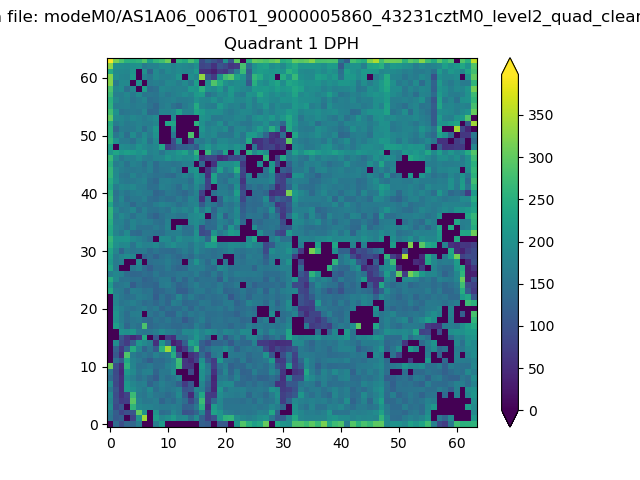 |
Quadrant B |
|---|---|---|---|
| Quadrant D | 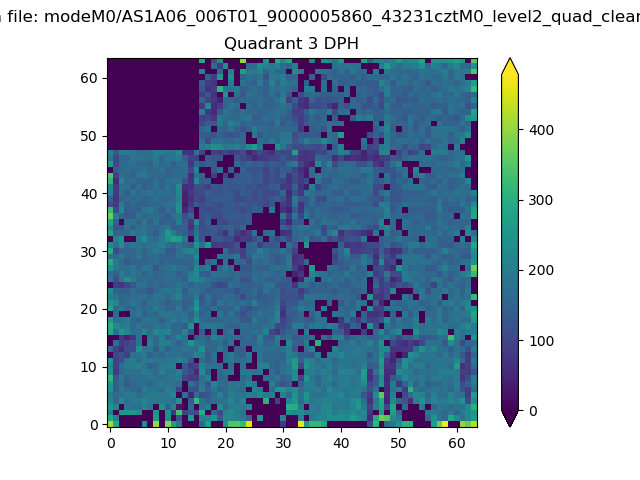 |
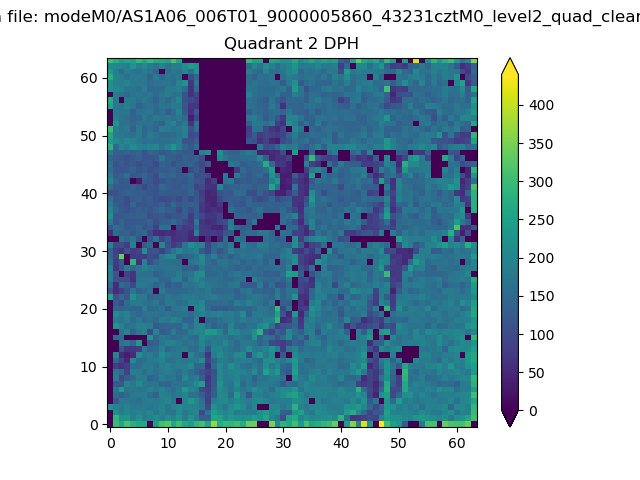 |
Quadrant C |
| Plot type | Count rate plots | Images |
|---|---|---|
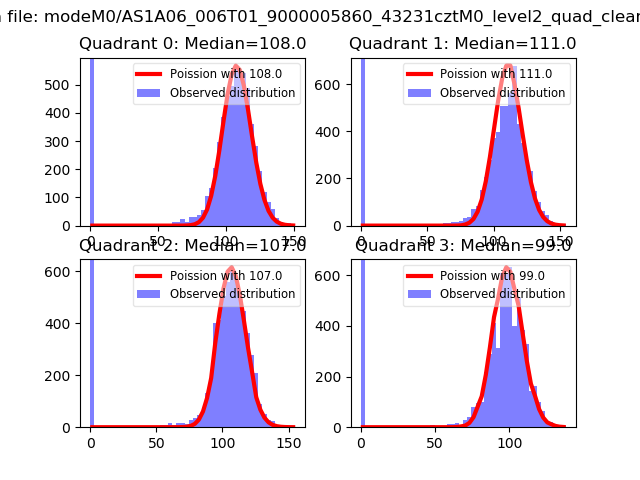
| Comparison with Poisson distribution Blue bars denote a histogram of data divided into 1 sec bins. Red curve is a Poisson curve with rate = median count rate of data. |
 |
 |
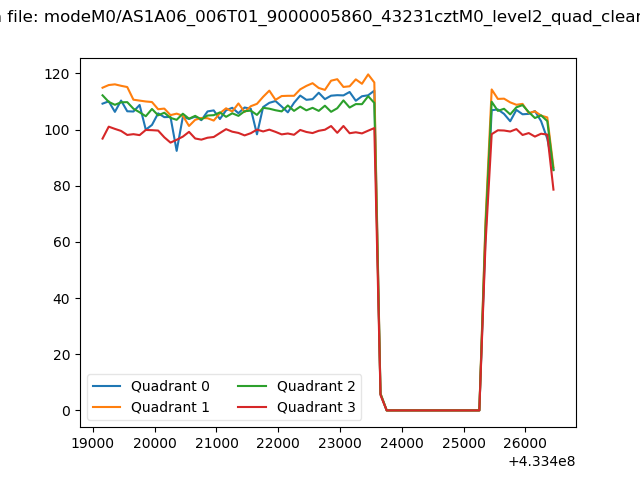
| Quadrant-wise count rates Data is divided into 100 sec bins |
 |
|
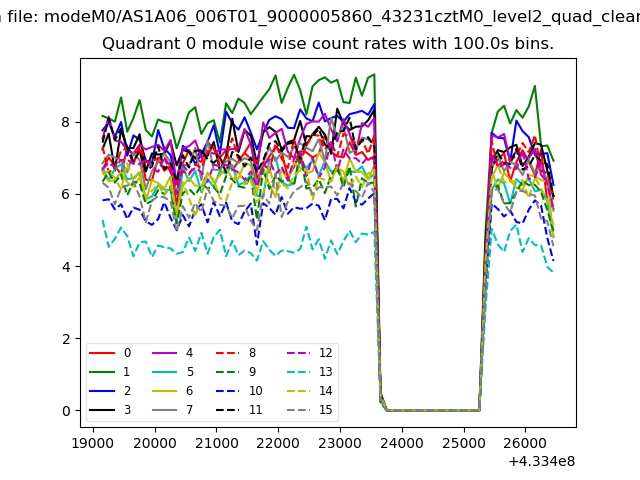
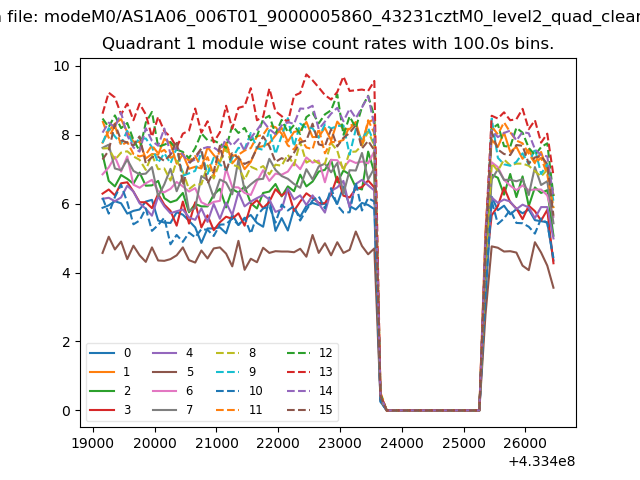
| Module-wise count rates for Quadrant A Data is divided into 100 sec bins |
 |
 |
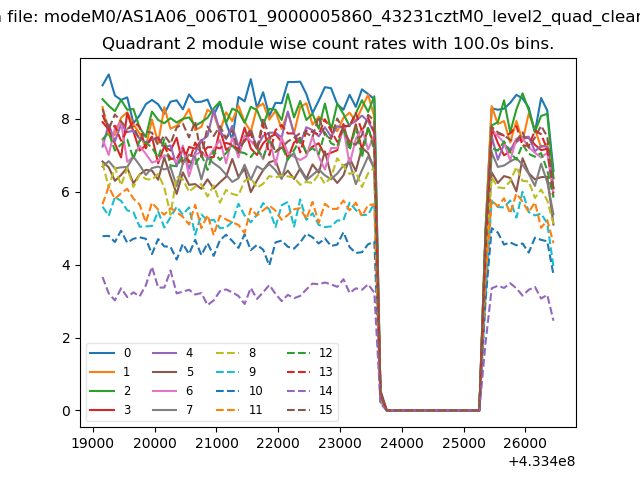
| Module-wise count rates for Quadrant B Data is divided into 100 sec bins |
 |
 |
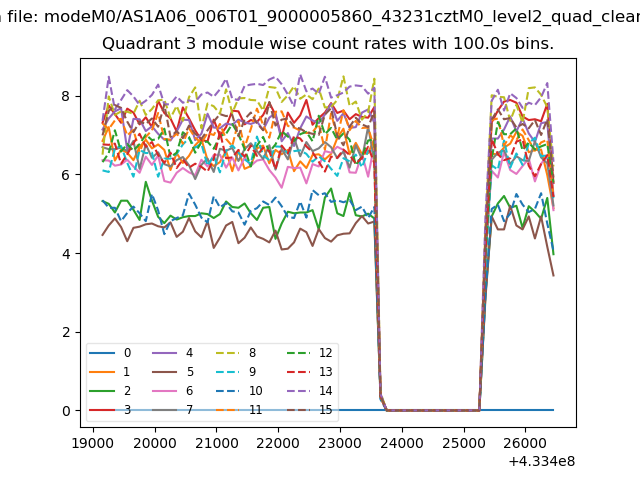
| Module-wise count rates for Quadrant C Data is divided into 100 sec bins |
 |
 |
| Module-wise count rates for Quadrant D Data is divided into 100 sec bins |
 |
 |
| Parameter | Plot |
|---|---|
| CZT HV Monitor |  |
| D_VDD | 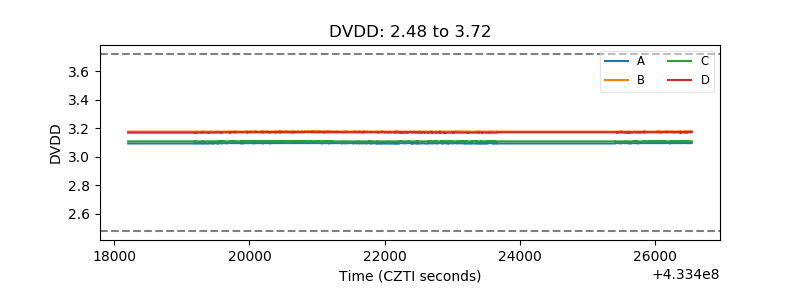 |
| Temperature 1 | 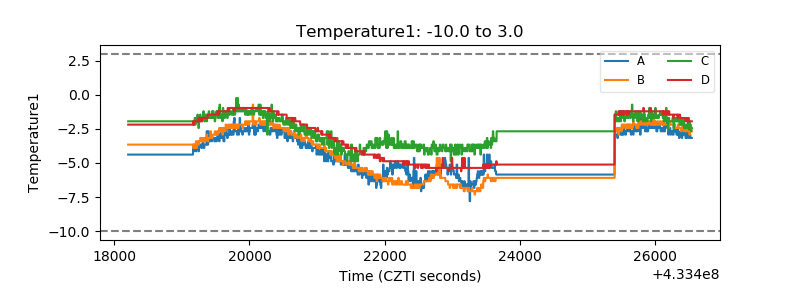 |
| Veto HV Monitor | 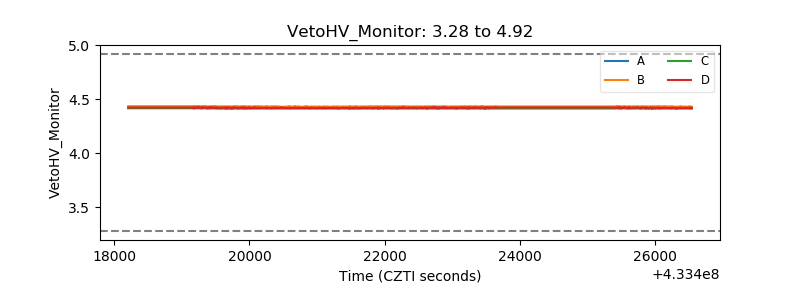 |
| Veto LLD | 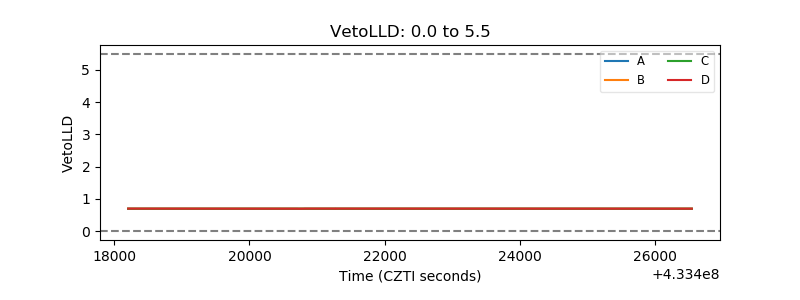 |
| Alpha Counter | 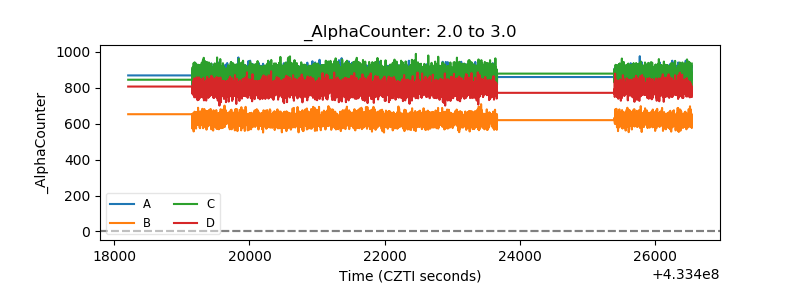 |
| _CPM_Rate | 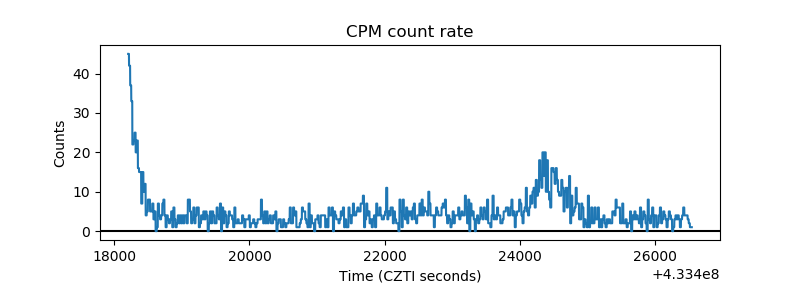 |
| CZT Counter | 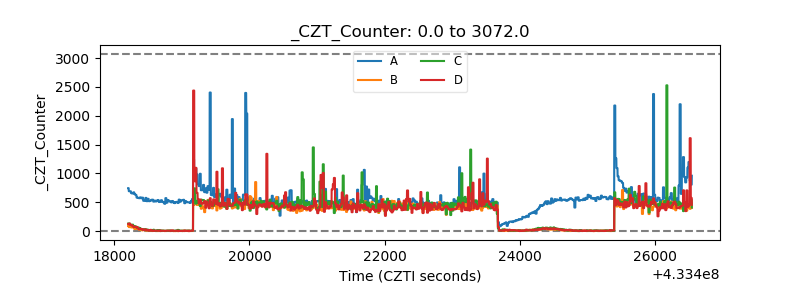 |
| +2.5 Volts monitor | 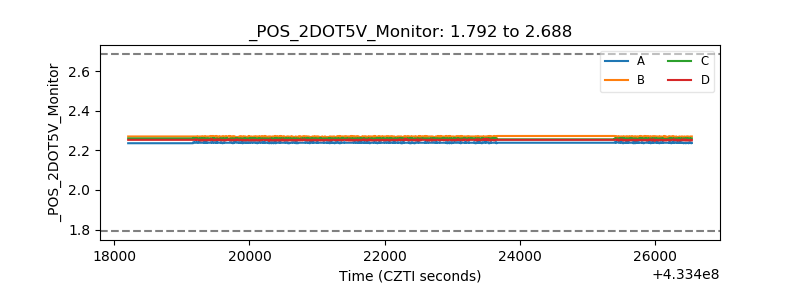 |
| +5 Volts monitor | 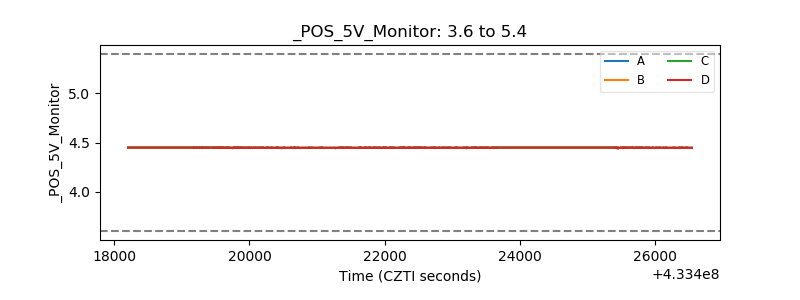 |
| _ROLL_ROT | 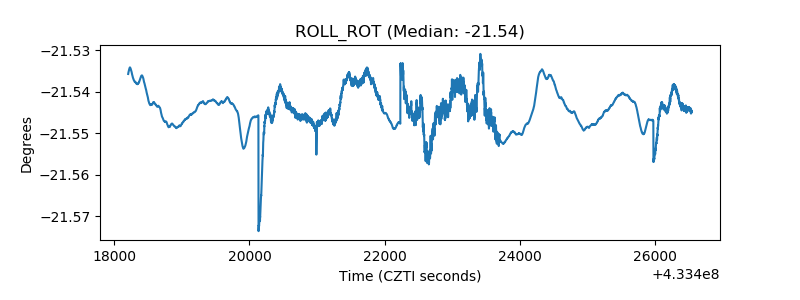 |
| _Roll_DEC | 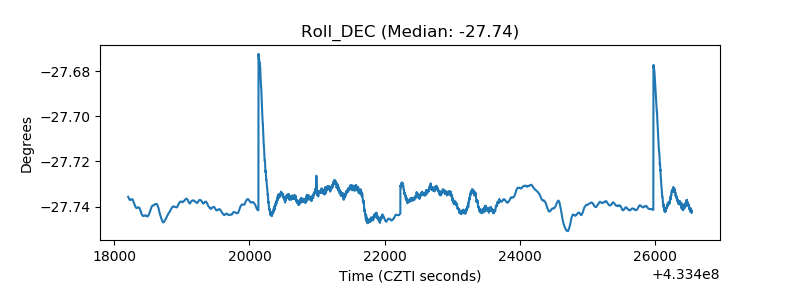 |
| _Roll_RA | 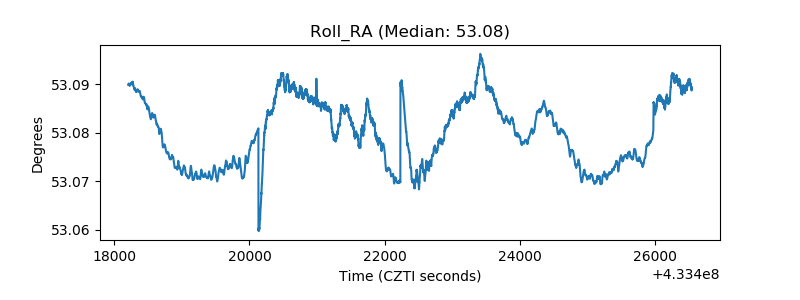 |
| Veto Counter | 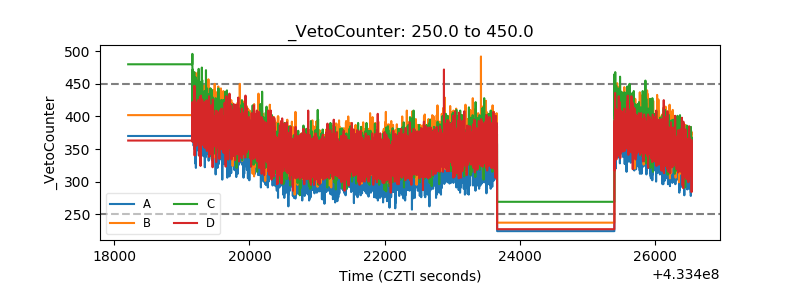 |