| Param | Original file | Final file |
|---|---|---|
| Filename | modeM0/AS1A06_006T01_9000005860_43233cztM0_level2.fits | modeM0/AS1A06_006T01_9000005860_43233cztM0_level2_quad_clean.evt |
| Size (bytes) | 378,449,280 | 97,125,120 |
| Size | 360.9 MB | 92.6 MB |
| Events in quadrant A | 3,365,024 | 645,550 |
| Events in quadrant B | 2,689,415 | 666,918 |
| Events in quadrant C | 3,163,529 | 640,223 |
| Events in quadrant D | 4,318,466 | 564,312 |
| Mode SS | |||
|---|---|---|---|
| Quadrant | BADHDUFLAG | Total packets | Discarded packets |
| A | 0 | 126 | 0 |
| B | 0 | 126 | 0 |
| C | 0 | 126 | 0 |
| D | 0 | 126 | 0 |
| Mode M9 | |||
|---|---|---|---|
| Quadrant | BADHDUFLAG | Total packets | Discarded packets |
| A | 0 | 27 | 0 |
| B | 0 | 27 | 0 |
| C | 0 | 27 | 0 |
| D | 0 | 27 | 0 |
| Mode M0 | |||
|---|---|---|---|
| Quadrant | BADHDUFLAG | Total packets | Discarded packets |
| A | 0 | 13667 | 2 |
| B | 0 | 12384 | 2 |
| C | 0 | 13321 | 2 |
| D | 0 | 17050 | 2 |
| Quadrant | Total seconds | Saturated seconds | Saturation percentage |
|---|---|---|---|
| A | 6068 | 42 | 0.692156% |
| B | 6068 | 22 | 0.362558% |
| C | 6068 | 22 | 0.362558% |
| D | 6068 | 413 | 6.806196% |
Noise dominated data is calculated using 1-second bins in cleaned event files. If a bin has >2000 counts, and if more than 50% of those come from <1% of pixels, then it is considered to be noise-dominated and hence unusable.
| Quadrant | # 1 sec bins | Bins with >0 counts | Bins with >2000 counts | High rate bins dominated by noise | Noise dominated (total time) | Noise dominated (detector-on time) | Marked lightcurve |
|---|---|---|---|---|---|---|---|
| A | 8814 | 6070 | 30 | 30 | 0.34% | 0.49% | 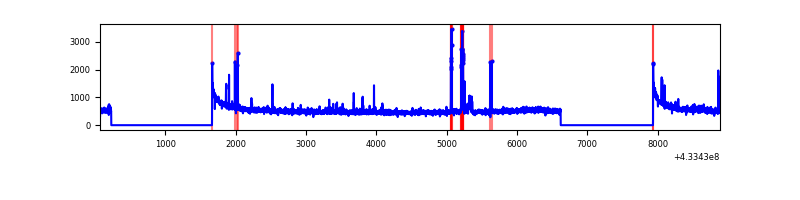 |
| B | 8814 | 6070 | 10 | 10 | 0.11% | 0.16% | 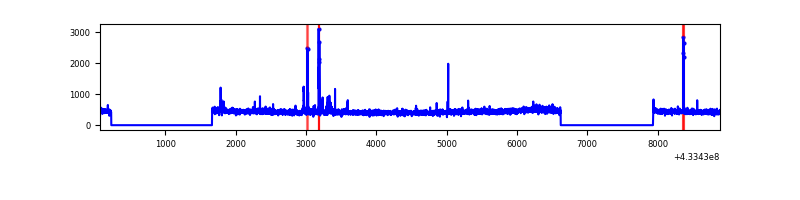 |
| C | 8814 | 6070 | 22 | 22 | 0.25% | 0.36% | 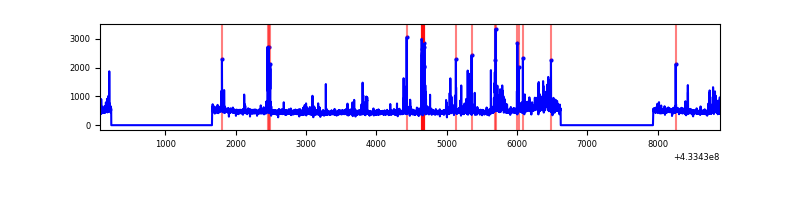 |
| D | 8814 | 6070 | 410 | 410 | 4.65% | 6.75% | 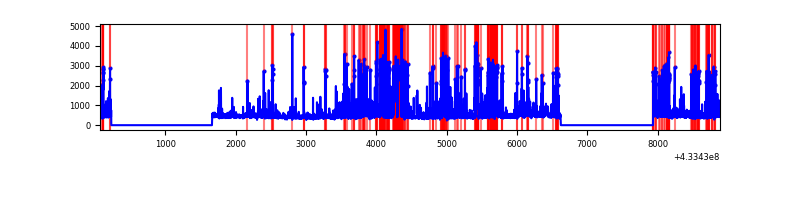 |
Top three noisy pixels from each quadrant. If the there are fewer than three noisy pixels in the level2.evt file, extra rows are filled as -1
| Pixel properties | Quadrant properties | ||||||
|---|---|---|---|---|---|---|---|
| Quadrant | DetID | PixID | Counts | Sigma | Mean | Median | Sigma |
| A | 10 | 83 | 643567 | 4745.32 | 651 | 636 | 135.5 |
| A | 15 | 237 | 134804 | 990.26 | 651 | 636 | 135.5 |
| A | 12 | 189 | 31234 | 225.84 | 651 | 636 | 135.5 |
| B | 15 | 35 | 62956 | 486.35 | 652 | 633 | 128.1 |
| B | 0 | 189 | 34507 | 264.35 | 652 | 633 | 128.1 |
| B | 0 | 186 | 22267 | 168.83 | 652 | 633 | 128.1 |
| C | 15 | 214 | 270435 | 1786.82 | 641 | 645 | 151.0 |
| C | 15 | 111 | 260985 | 1724.23 | 641 | 645 | 151.0 |
| C | 14 | 254 | 84520 | 555.5 | 641 | 645 | 151.0 |
| D | 12 | 16 | 1165401 | 7620.95 | 618 | 601 | 152.8 |
| D | 1 | 52 | 457796 | 2991.3 | 618 | 601 | 152.8 |
| D | 2 | 249 | 130817 | 851.97 | 618 | 601 | 152.8 |
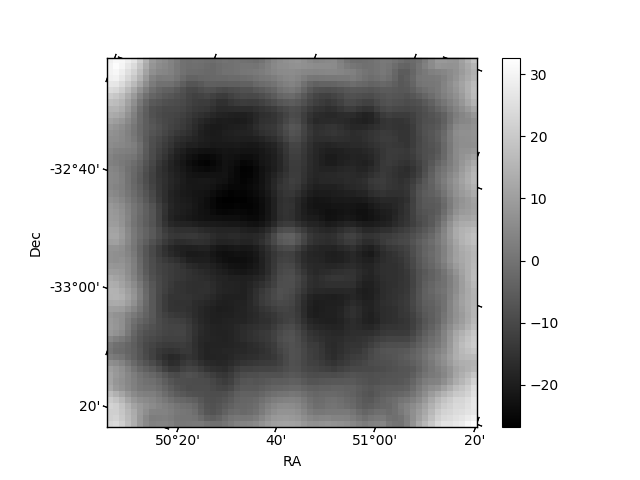
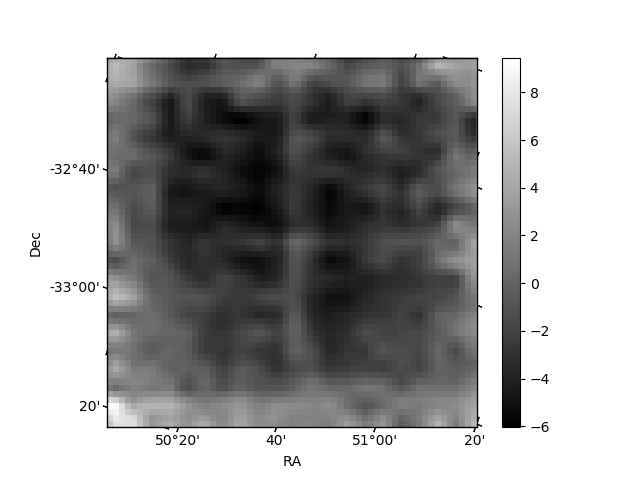
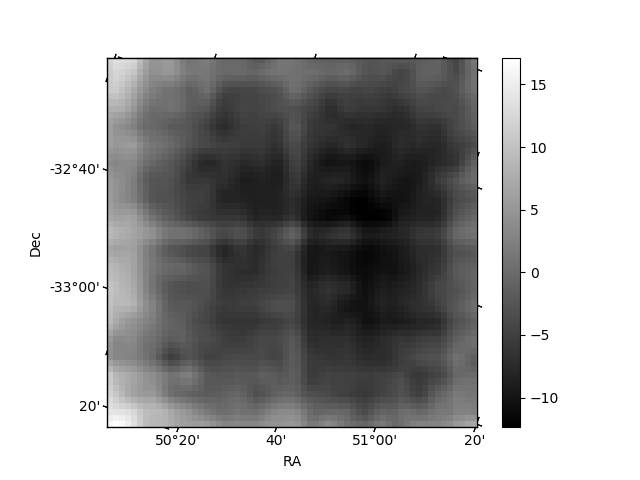
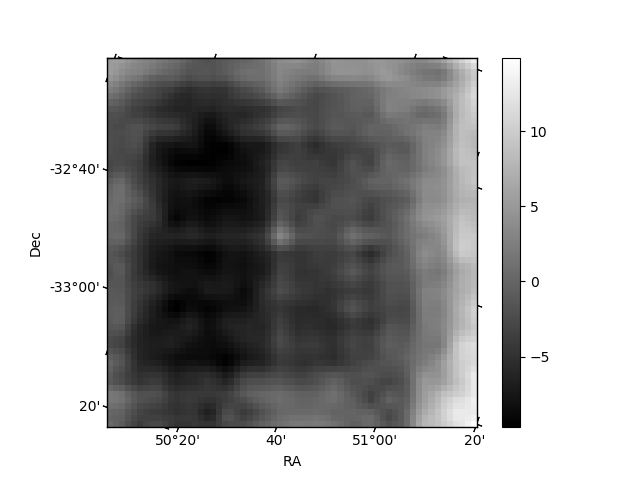
Histogram calculated using DETX and DETY for each event in the final _common_clean file
| Quadrant A | 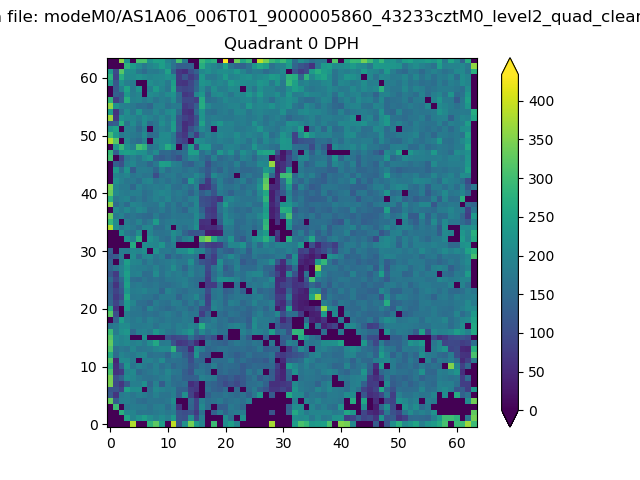 |
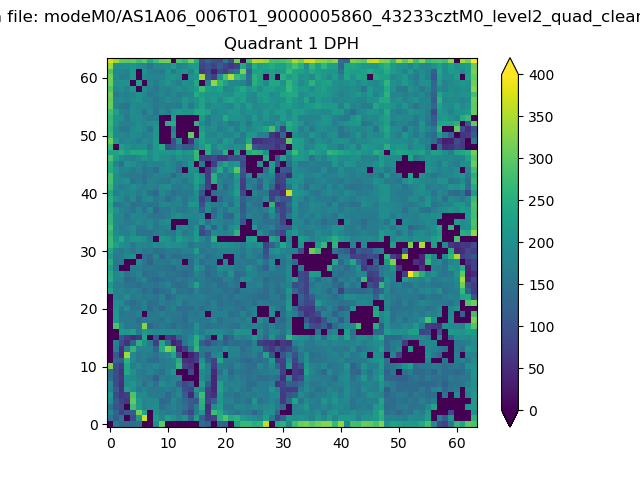 |
Quadrant B |
|---|---|---|---|
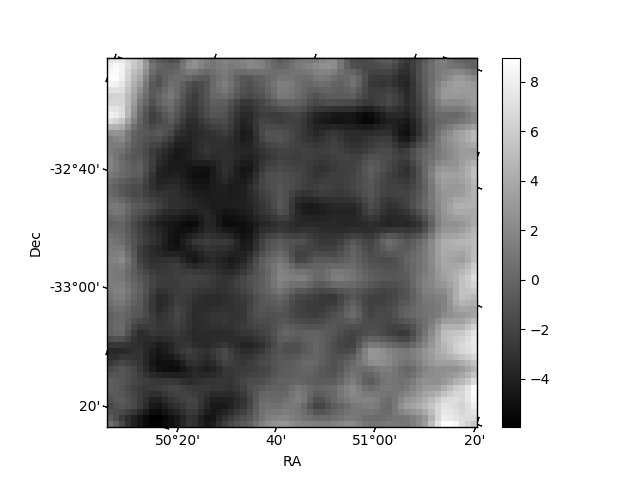
| Quadrant D | 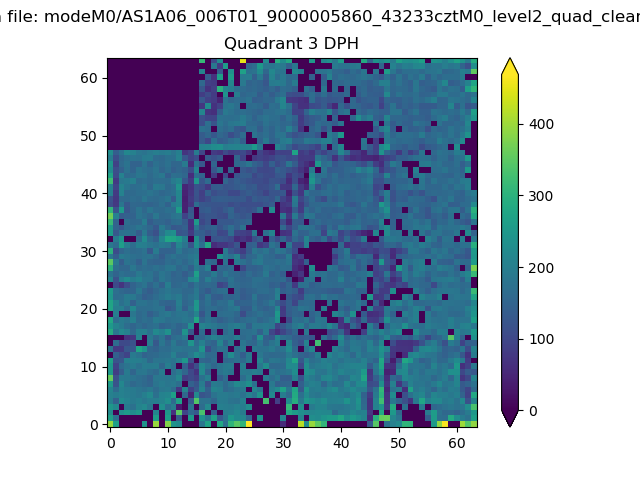 |
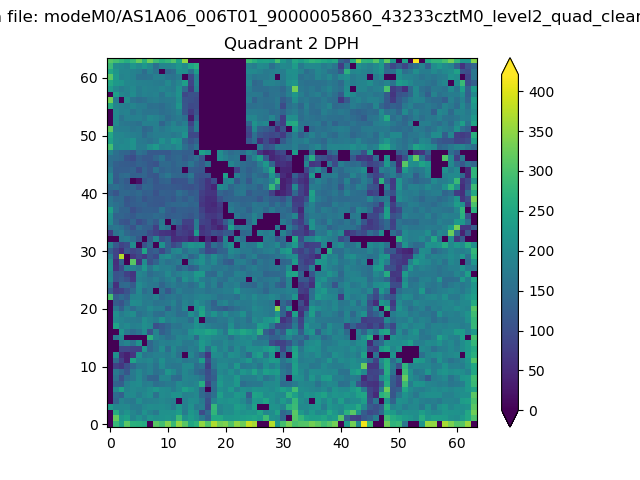 |
Quadrant C |
| Plot type | Count rate plots | Images |
|---|---|---|
| Comparison with Poisson distribution Blue bars denote a histogram of data divided into 1 sec bins. Red curve is a Poisson curve with rate = median count rate of data. |
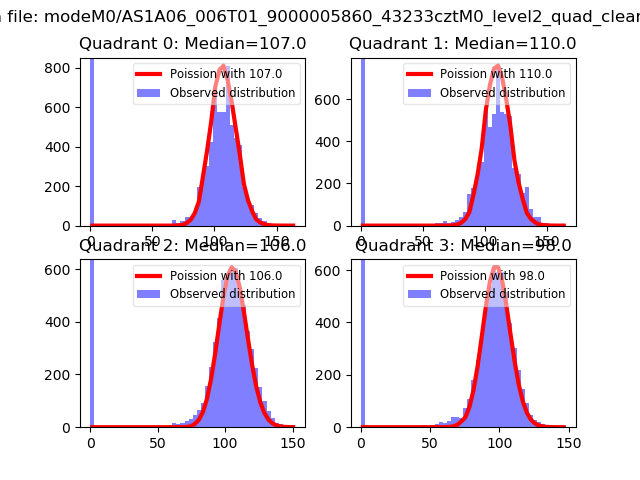 |
 |
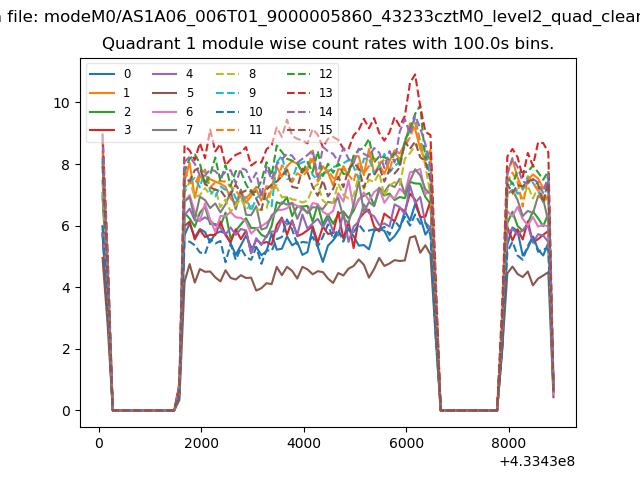
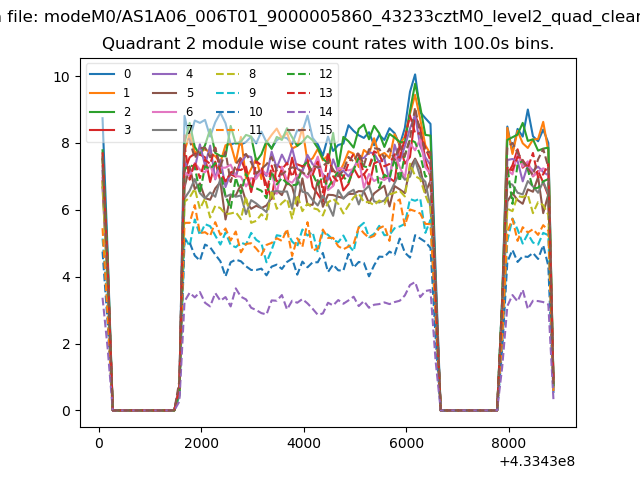
| Quadrant-wise count rates Data is divided into 100 sec bins |
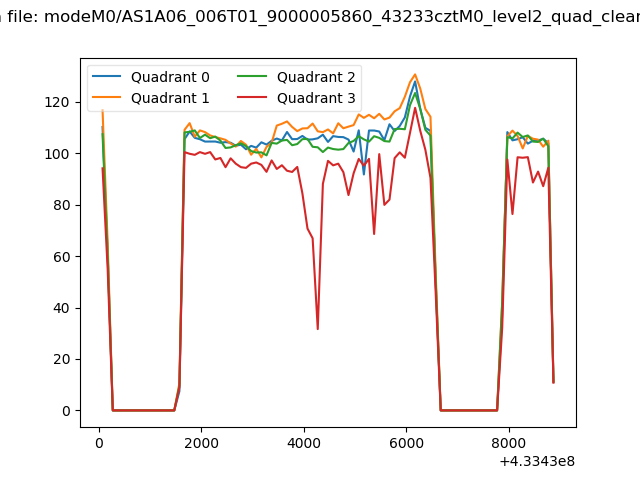 |
|
| Module-wise count rates for Quadrant A Data is divided into 100 sec bins |
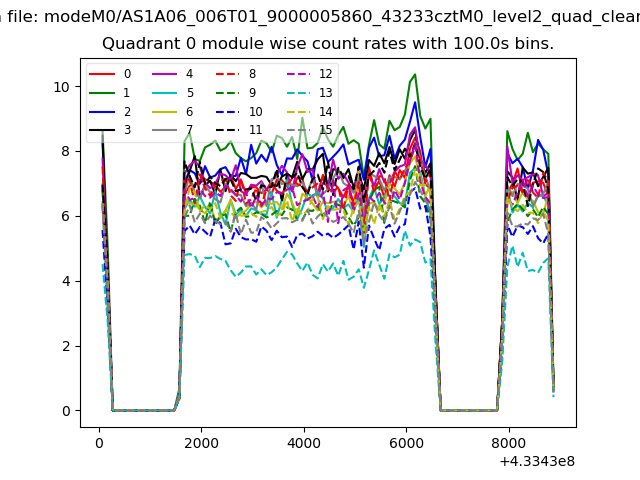 |
 |
| Module-wise count rates for Quadrant B Data is divided into 100 sec bins |
 |
 |
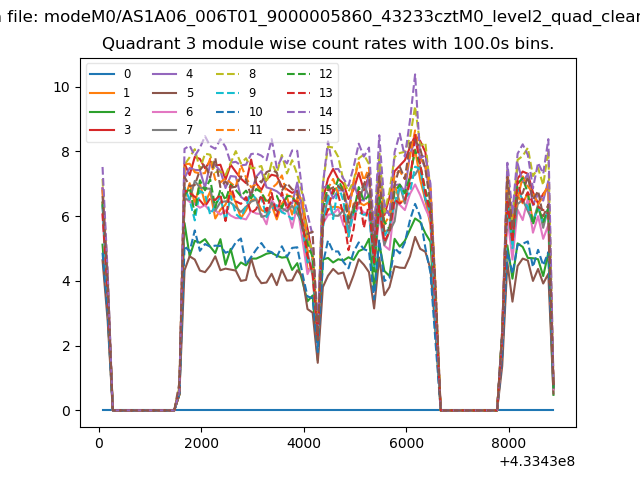
| Module-wise count rates for Quadrant C Data is divided into 100 sec bins |
 |
 |
| Module-wise count rates for Quadrant D Data is divided into 100 sec bins |
 |
 |
| Parameter | Plot |
|---|---|
| CZT HV Monitor | 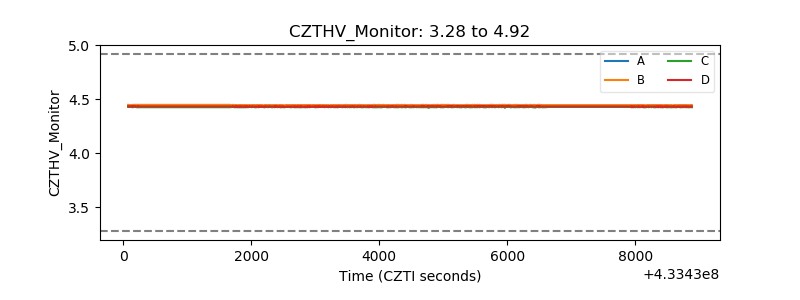 |
| D_VDD | 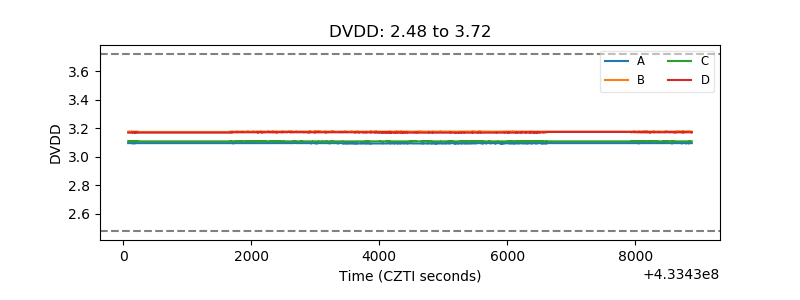 |
| Temperature 1 | 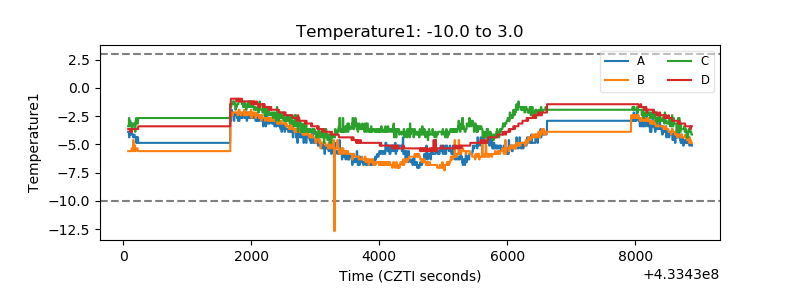 |
| Veto HV Monitor | 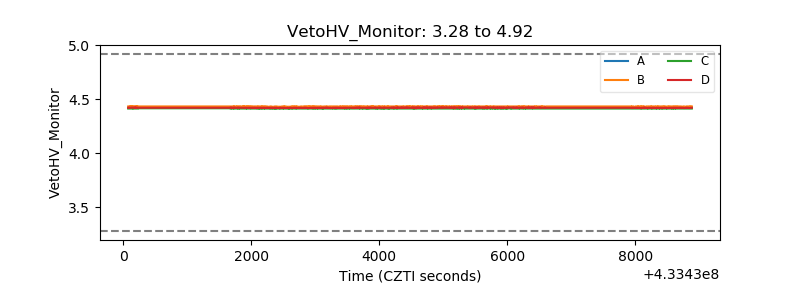 |
| Veto LLD | 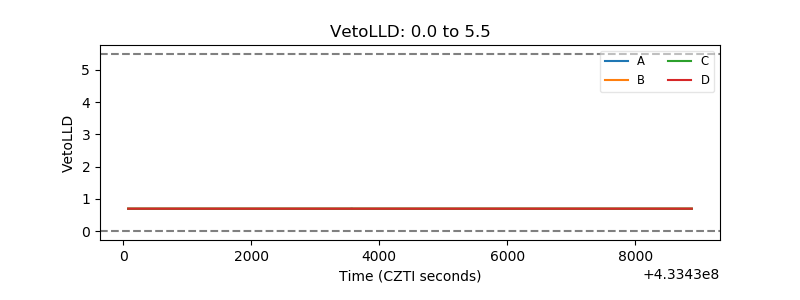 |
| Alpha Counter | 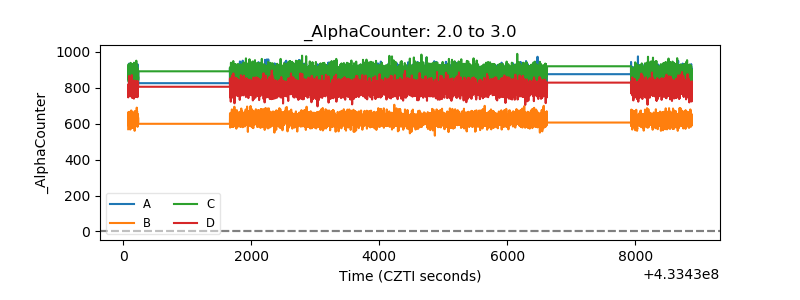 |
| _CPM_Rate | 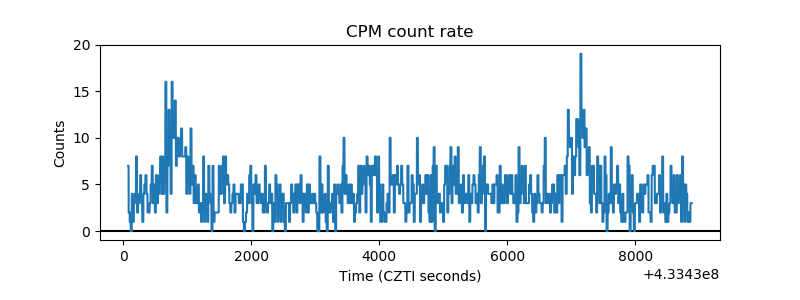 |
| CZT Counter | 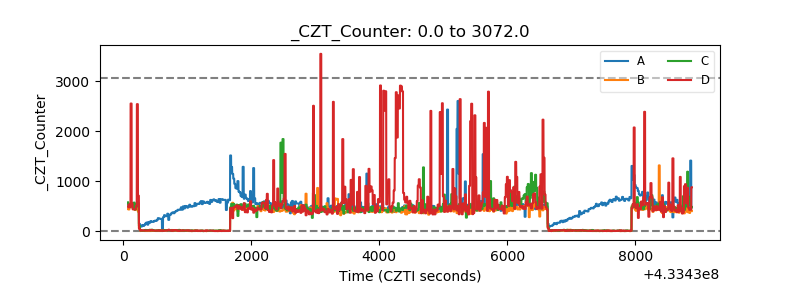 |
| +2.5 Volts monitor | 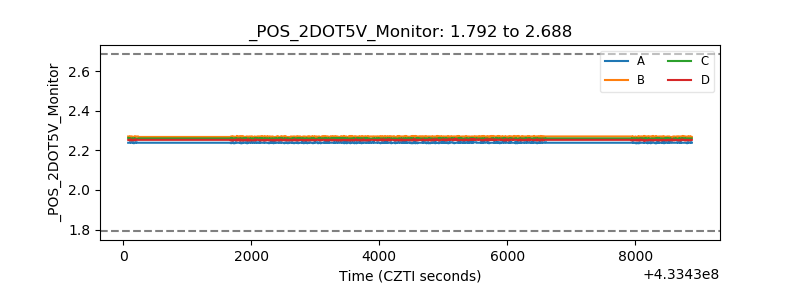 |
| +5 Volts monitor | 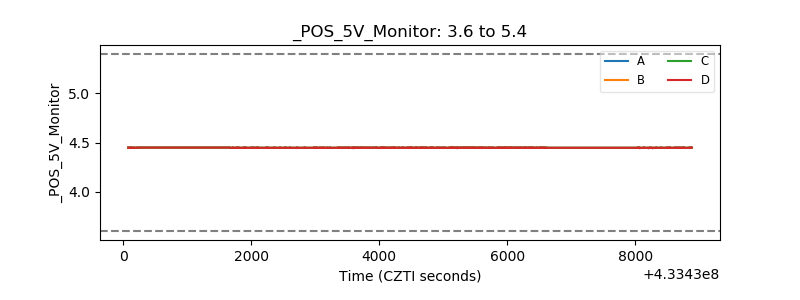 |
| _ROLL_ROT | 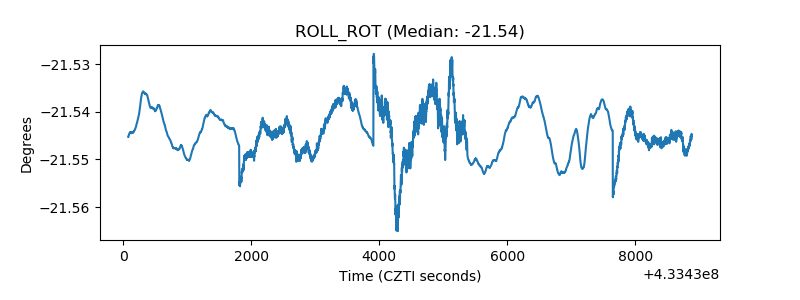 |
| _Roll_DEC | 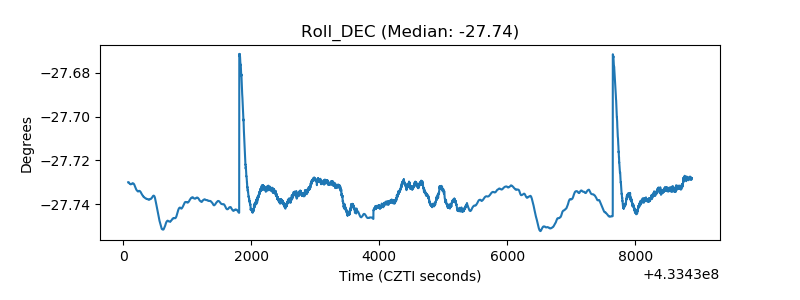 |
| _Roll_RA | 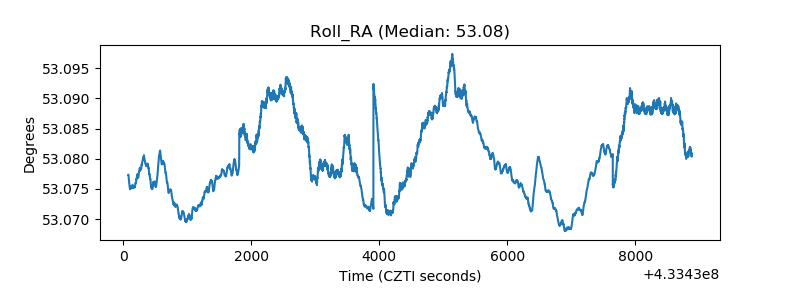 |
| Veto Counter | 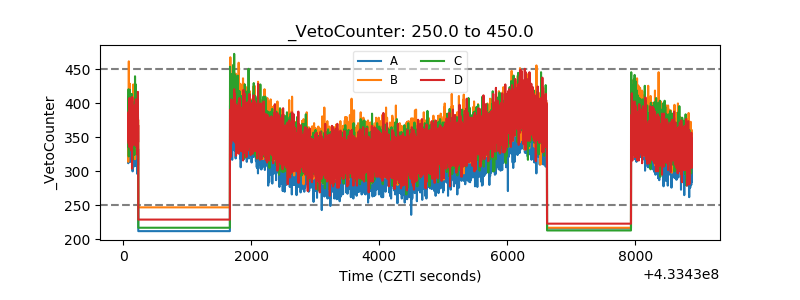 |