| Param | Original file | Final file |
|---|---|---|
| Filename | modeM0/AS1A06_006T01_9000005860_43239cztM0_level2.fits | modeM0/AS1A06_006T01_9000005860_43239cztM0_level2_quad_clean.evt |
| Size (bytes) | 818,208,000 | 200,571,840 |
| Size | 780.3 MB | 191.3 MB |
| Events in quadrant A | 7,131,538 | 1,351,642 |
| Events in quadrant B | 5,460,675 | 1,430,855 |
| Events in quadrant C | 6,099,342 | 1,350,139 |
| Events in quadrant D | 10,615,441 | 1,066,831 |
| Mode SS | |||
|---|---|---|---|
| Quadrant | BADHDUFLAG | Total packets | Discarded packets |
| A | 0 | 258 | 0 |
| B | 0 | 258 | 0 |
| C | 0 | 258 | 0 |
| D | 0 | 258 | 0 |
| Mode M9 | |||
|---|---|---|---|
| Quadrant | BADHDUFLAG | Total packets | Discarded packets |
| A | 0 | 48 | 0 |
| B | 0 | 48 | 0 |
| C | 0 | 48 | 0 |
| D | 0 | 48 | 0 |
| Mode M0 | |||
|---|---|---|---|
| Quadrant | BADHDUFLAG | Total packets | Discarded packets |
| A | 0 | 29028 | 4 |
| B | 0 | 25366 | 3 |
| C | 0 | 26133 | 3 |
| D | 0 | 40790 | 3 |
| Quadrant | Total seconds | Saturated seconds | Saturation percentage |
|---|---|---|---|
| A | 12638 | 189 | 1.495490% |
| B | 12639 | 8 | 0.063296% |
| C | 12639 | 32 | 0.253185% |
| D | 12639 | 1896 | 15.001187% |
Noise dominated data is calculated using 1-second bins in cleaned event files. If a bin has >2000 counts, and if more than 50% of those come from <1% of pixels, then it is considered to be noise-dominated and hence unusable.
| Quadrant | # 1 sec bins | Bins with >0 counts | Bins with >2000 counts | High rate bins dominated by noise | Noise dominated (total time) | Noise dominated (detector-on time) | Marked lightcurve |
|---|---|---|---|---|---|---|---|
| A | 17447 | 12641 | 149 | 149 | 0.85% | 1.18% | 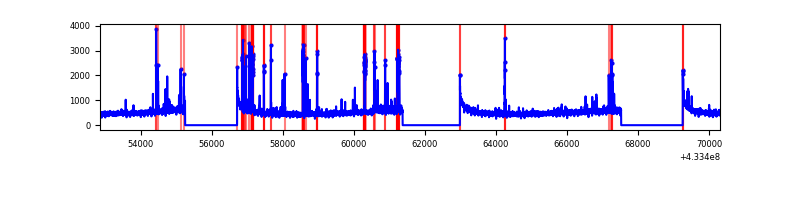 |
| B | 17448 | 12642 | 1 | 1 | 0.01% | 0.01% | 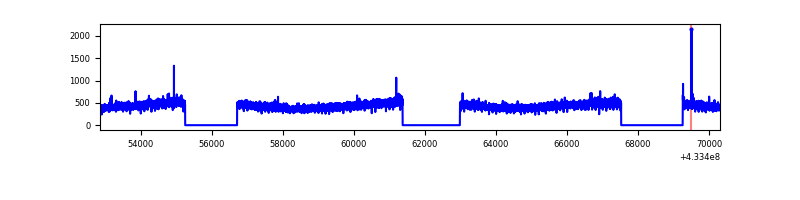 |
| C | 17448 | 12642 | 17 | 17 | 0.10% | 0.13% | 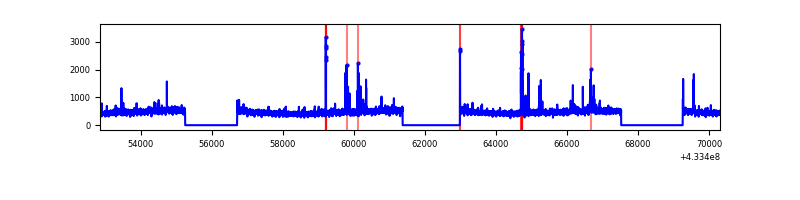 |
| D | 17448 | 12642 | 1811 | 1811 | 10.38% | 14.33% | 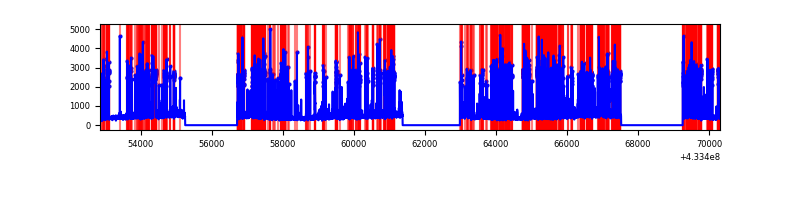 |
Top three noisy pixels from each quadrant. If the there are fewer than three noisy pixels in the level2.evt file, extra rows are filled as -1
| Pixel properties | Quadrant properties | ||||||
|---|---|---|---|---|---|---|---|
| Quadrant | DetID | PixID | Counts | Sigma | Mean | Median | Sigma |
| A | 10 | 83 | 1137963 | 4051.98 | 1364 | 1332 | 280.5 |
| A | 15 | 237 | 471254 | 1675.23 | 1364 | 1332 | 280.5 |
| A | 13 | 248 | 163636 | 578.6 | 1364 | 1332 | 280.5 |
| B | 0 | 189 | 54861 | 199.5 | 1371 | 1328 | 268.3 |
| B | 12 | 111 | 34095 | 122.11 | 1371 | 1328 | 268.3 |
| B | 11 | 111 | 31693 | 113.16 | 1371 | 1328 | 268.3 |
| C | 15 | 214 | 561739 | 1771.18 | 1356 | 1367 | 316.4 |
| C | 14 | 254 | 162501 | 509.3 | 1356 | 1367 | 316.4 |
| C | 3 | 233 | 70354 | 218.05 | 1356 | 1367 | 316.4 |
| D | 1 | 52 | 5062120 | 16844.43 | 1227 | 1192 | 300.5 |
| D | 2 | 249 | 335585 | 1112.97 | 1227 | 1192 | 300.5 |
| D | 12 | 6 | 281869 | 934.19 | 1227 | 1192 | 300.5 |
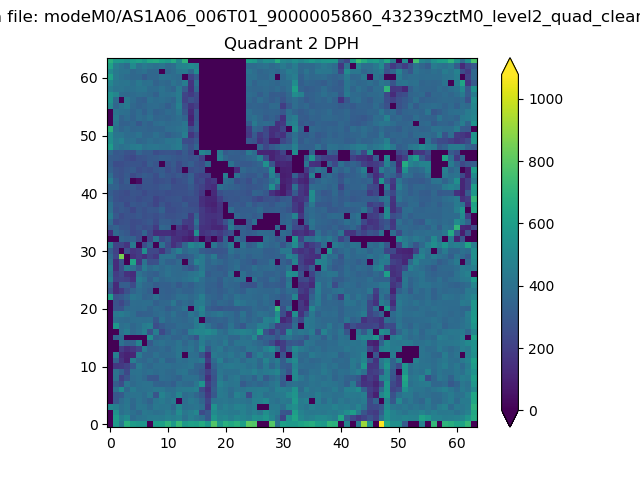
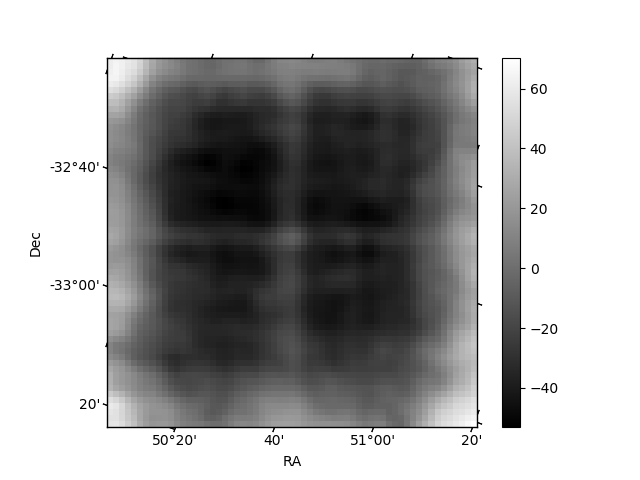
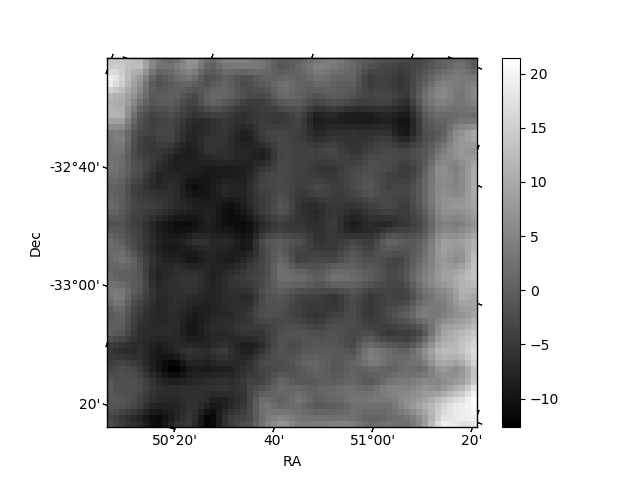
Histogram calculated using DETX and DETY for each event in the final _common_clean file
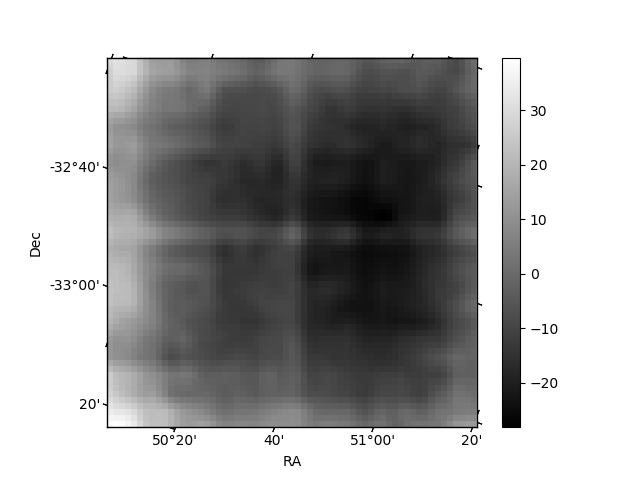
| Quadrant A | 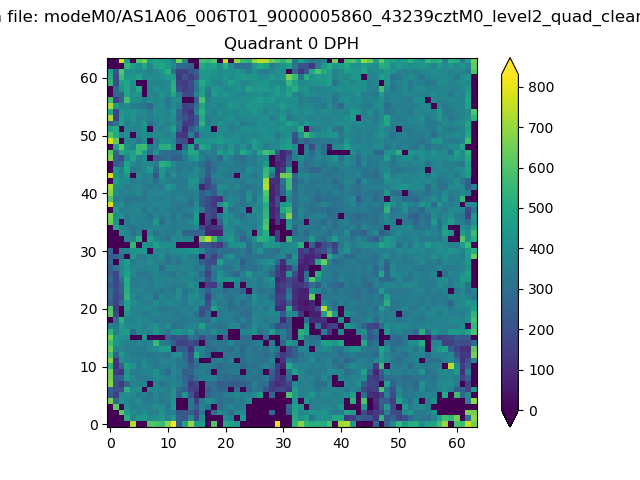 |
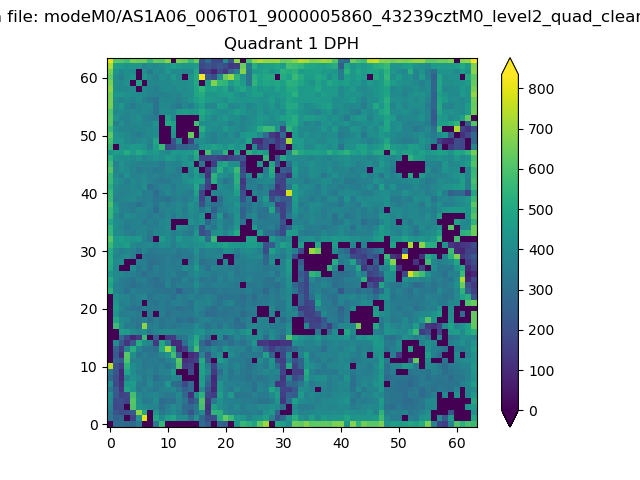 |
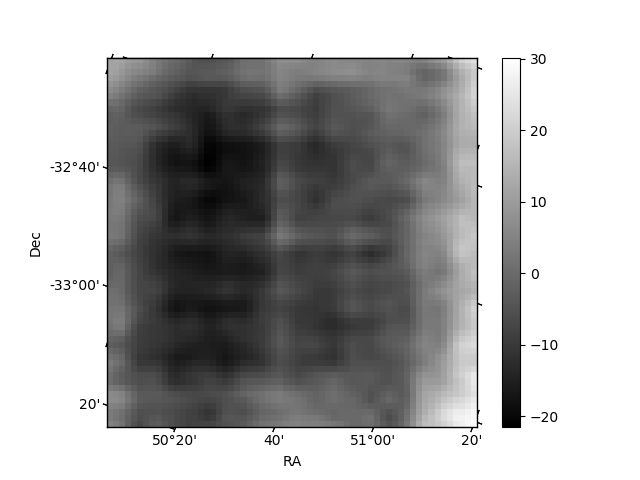
Quadrant B |
|---|---|---|---|
| Quadrant D | 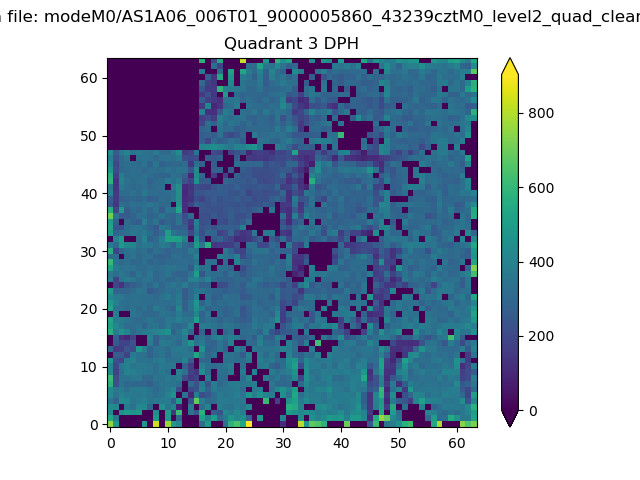 |
 |
Quadrant C |
| Plot type | Count rate plots | Images |
|---|---|---|
| Comparison with Poisson distribution Blue bars denote a histogram of data divided into 1 sec bins. Red curve is a Poisson curve with rate = median count rate of data. |
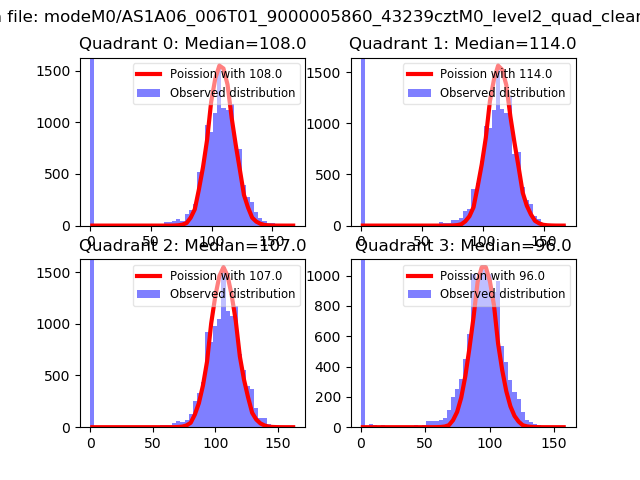 |
 |
| Quadrant-wise count rates Data is divided into 100 sec bins |
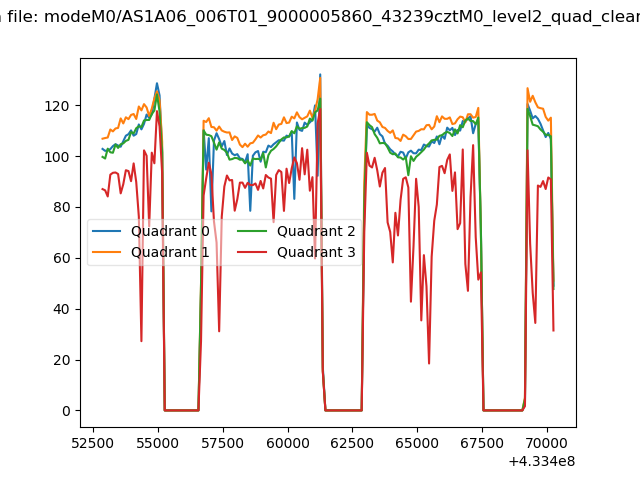 |
|
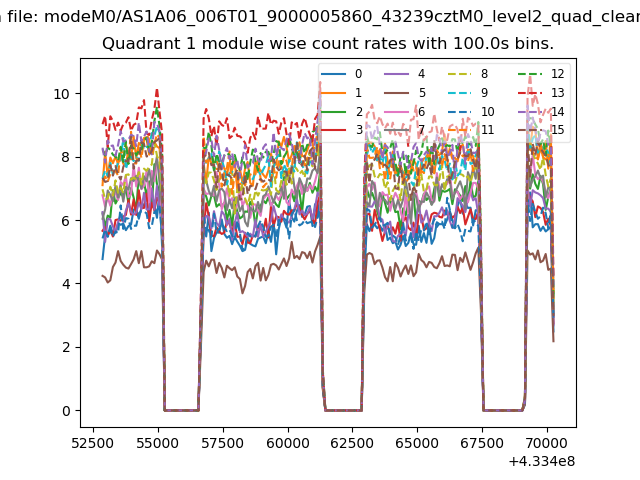
| Module-wise count rates for Quadrant A Data is divided into 100 sec bins |
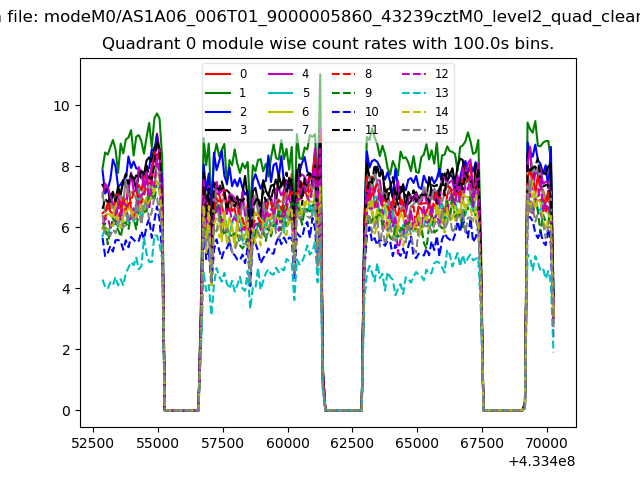 |
 |
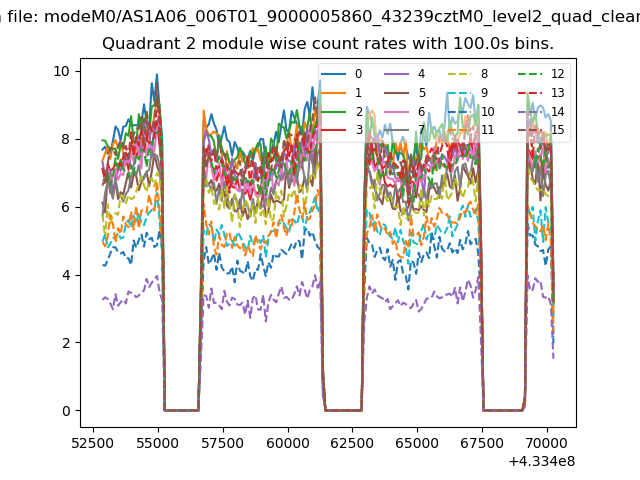
| Module-wise count rates for Quadrant B Data is divided into 100 sec bins |
 |
 |
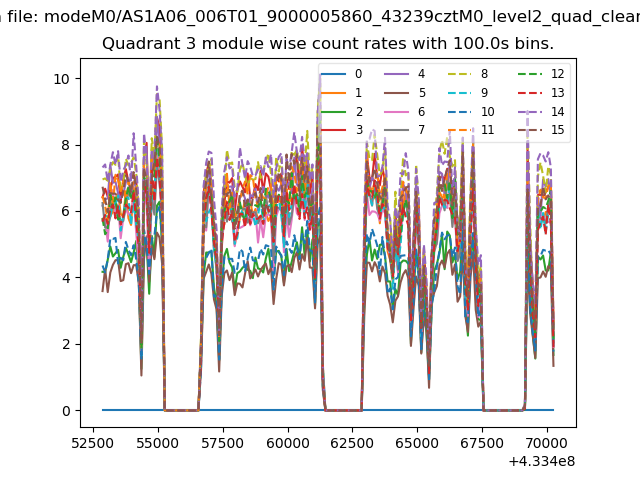
| Module-wise count rates for Quadrant C Data is divided into 100 sec bins |
 |
 |
| Module-wise count rates for Quadrant D Data is divided into 100 sec bins |
 |
 |
| Parameter | Plot |
|---|---|
| CZT HV Monitor | 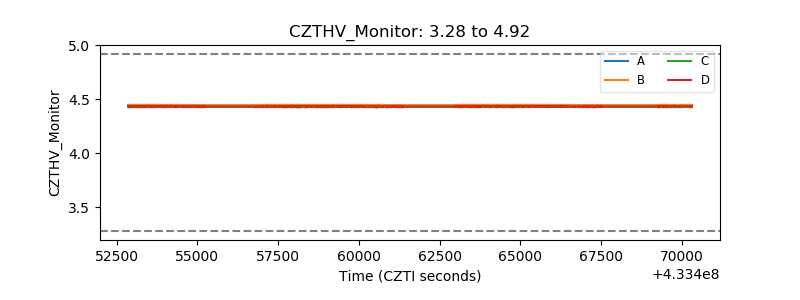 |
| D_VDD | 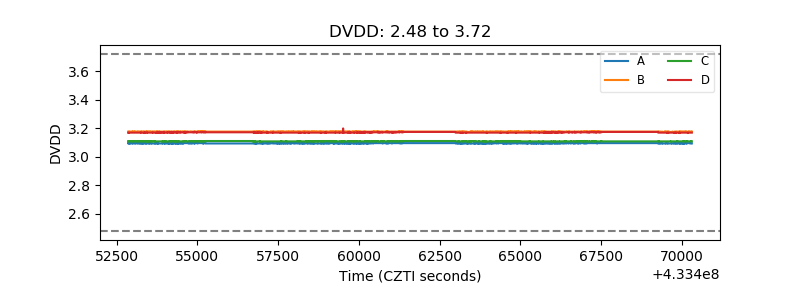 |
| Temperature 1 | 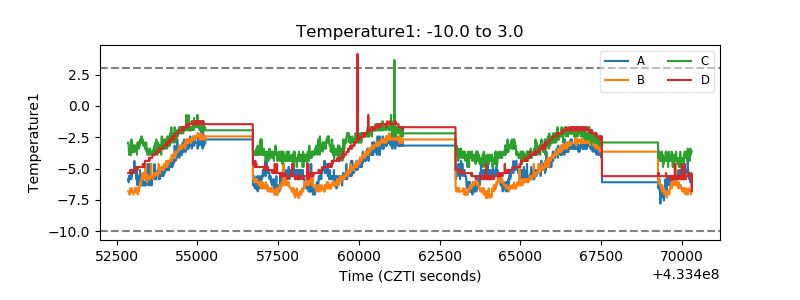 |
| Veto HV Monitor | 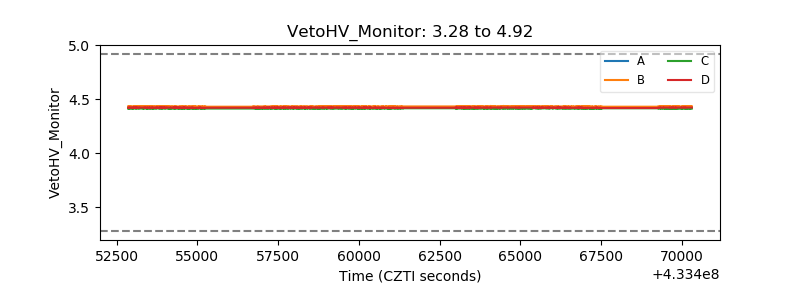 |
| Veto LLD | 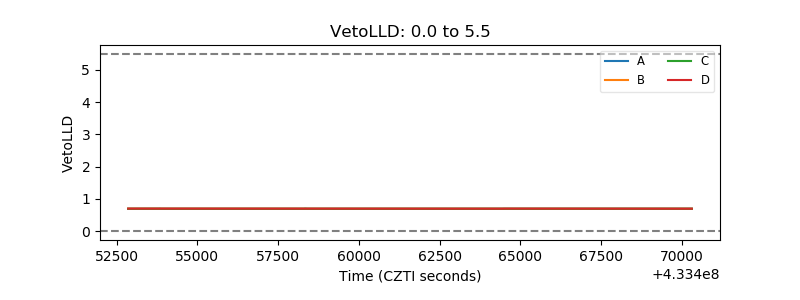 |
| Alpha Counter | 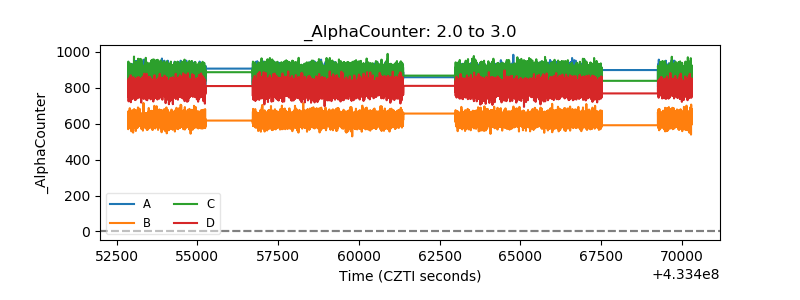 |
| _CPM_Rate | 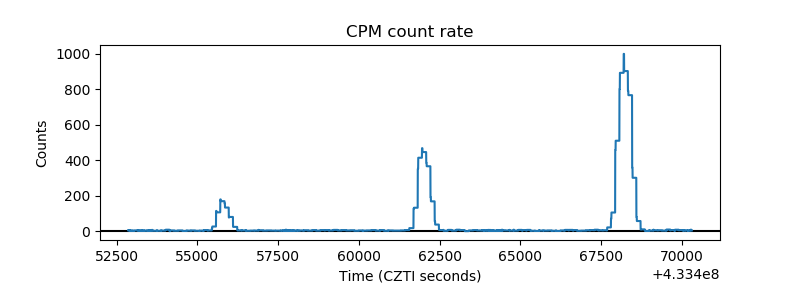 |
| CZT Counter | 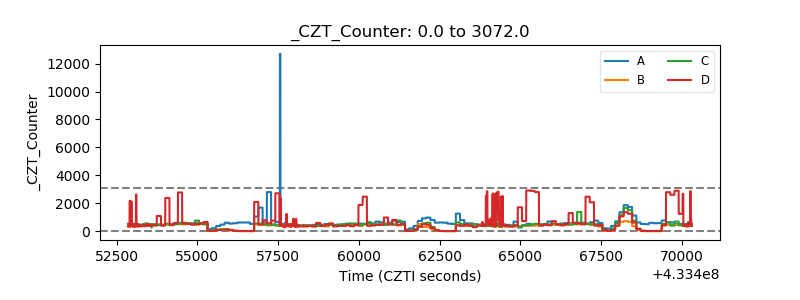 |
| +2.5 Volts monitor | 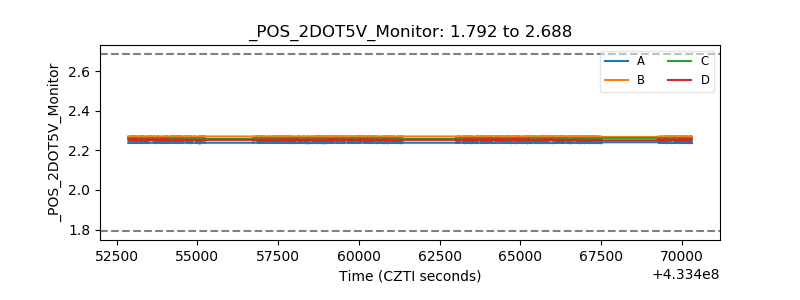 |
| +5 Volts monitor | 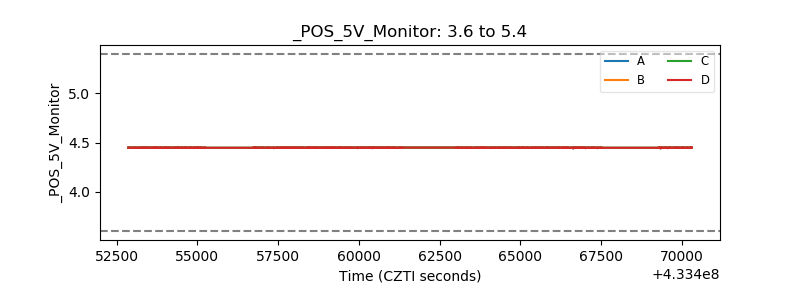 |
| _ROLL_ROT | 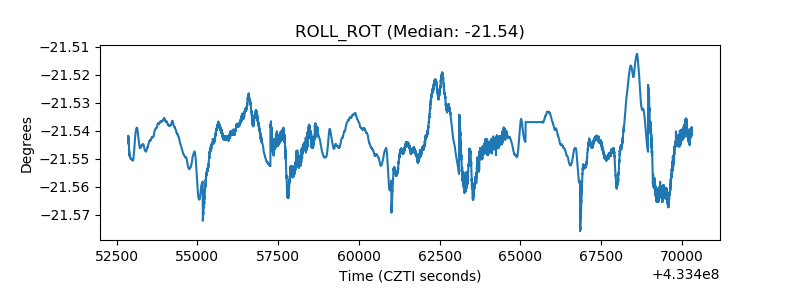 |
| _Roll_DEC | 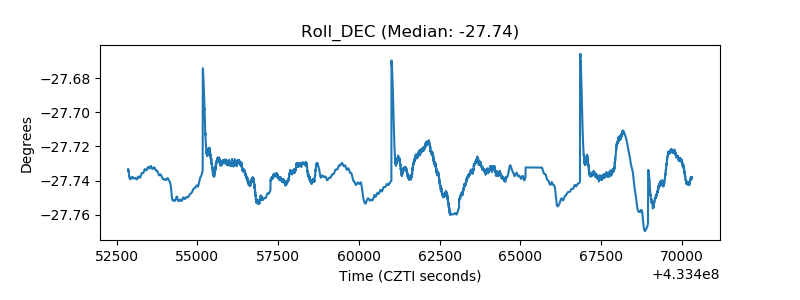 |
| _Roll_RA | 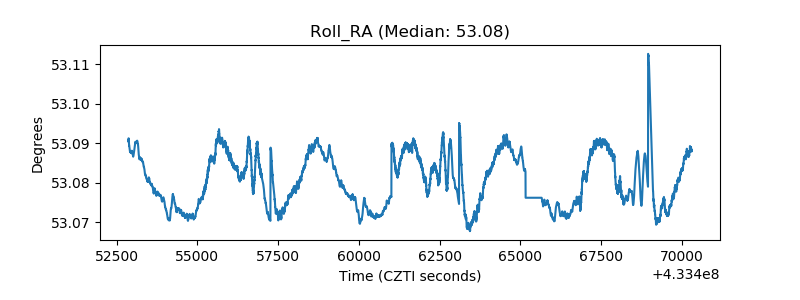 |
| Veto Counter | 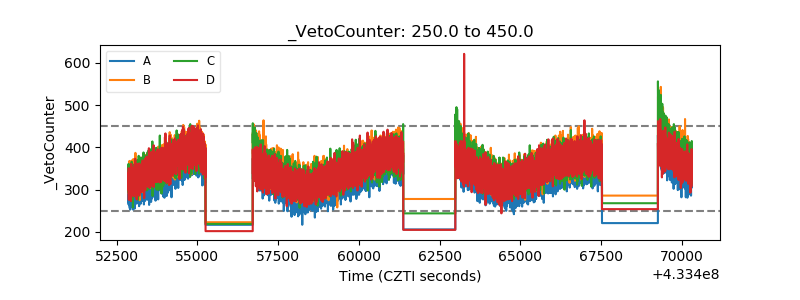 |