| Param | Original file | Final file |
|---|---|---|
| Filename | modeM0/AS1A06_006T01_9000005860_43240cztM0_level2.fits | modeM0/AS1A06_006T01_9000005860_43240cztM0_level2_quad_clean.evt |
| Size (bytes) | 383,385,600 | 89,366,400 |
| Size | 365.6 MB | 85.2 MB |
| Events in quadrant A | 4,093,454 | 556,571 |
| Events in quadrant B | 2,415,500 | 648,858 |
| Events in quadrant C | 2,910,844 | 611,441 |
| Events in quadrant D | 4,342,949 | 503,585 |
| Mode SS | |||
|---|---|---|---|
| Quadrant | BADHDUFLAG | Total packets | Discarded packets |
| A | 0 | 114 | 0 |
| B | 0 | 114 | 0 |
| C | 0 | 114 | 0 |
| D | 0 | 114 | 0 |
| Mode M9 | |||
|---|---|---|---|
| Quadrant | BADHDUFLAG | Total packets | Discarded packets |
| A | 0 | 29 | 0 |
| B | 0 | 30 | 0 |
| C | 0 | 30 | 0 |
| D | 0 | 30 | 0 |
| Mode M0 | |||
|---|---|---|---|
| Quadrant | BADHDUFLAG | Total packets | Discarded packets |
| A | 0 | 15528 | 3 |
| B | 0 | 11094 | 2 |
| C | 0 | 12030 | 2 |
| D | 0 | 16875 | 2 |
| Quadrant | Total seconds | Saturated seconds | Saturation percentage |
|---|---|---|---|
| A | 5504 | 553 | 10.047238% |
| B | 5504 | 7 | 0.127180% |
| C | 5504 | 31 | 0.563227% |
| D | 5504 | 664 | 12.063953% |
Noise dominated data is calculated using 1-second bins in cleaned event files. If a bin has >2000 counts, and if more than 50% of those come from <1% of pixels, then it is considered to be noise-dominated and hence unusable.
| Quadrant | # 1 sec bins | Bins with >0 counts | Bins with >2000 counts | High rate bins dominated by noise | Noise dominated (total time) | Noise dominated (detector-on time) | Marked lightcurve |
|---|---|---|---|---|---|---|---|
| A | 7356 | 5504 | 414 | 414 | 5.63% | 7.52% | 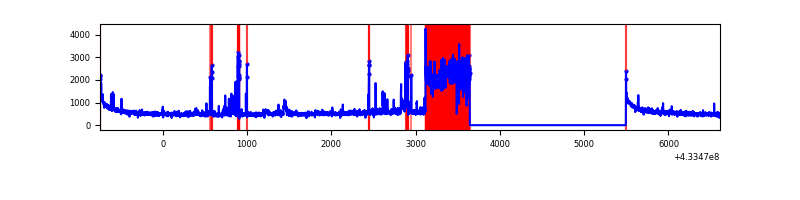 |
| B | 7356 | 5505 | 2 | 2 | 0.03% | 0.04% | 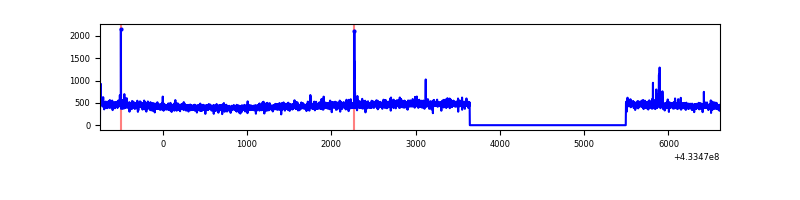 |
| C | 7356 | 5505 | 23 | 23 | 0.31% | 0.42% | 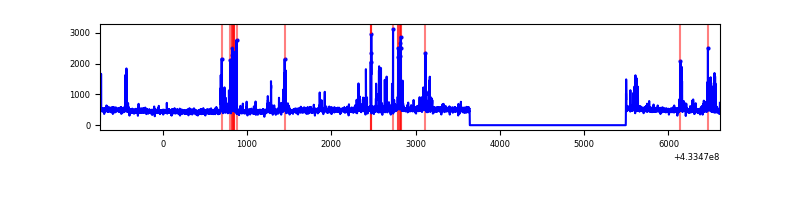 |
| D | 7356 | 5504 | 633 | 633 | 8.61% | 11.50% | 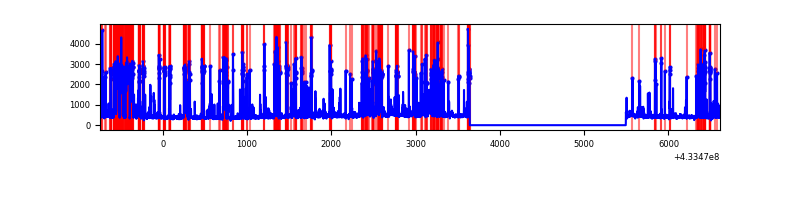 |
Top three noisy pixels from each quadrant. If the there are fewer than three noisy pixels in the level2.evt file, extra rows are filled as -1
| Pixel properties | Quadrant properties | ||||||
|---|---|---|---|---|---|---|---|
| Quadrant | DetID | PixID | Counts | Sigma | Mean | Median | Sigma |
| A | 15 | 237 | 1220605 | 10506.95 | 565 | 554 | 116.1 |
| A | 10 | 83 | 559695 | 4815.26 | 565 | 554 | 116.1 |
| A | 12 | 189 | 96325 | 824.77 | 565 | 554 | 116.1 |
| B | 5 | 255 | 26986 | 223.51 | 603 | 587 | 118.1 |
| B | 12 | 111 | 14679 | 119.31 | 603 | 587 | 118.1 |
| B | 11 | 111 | 13793 | 111.81 | 603 | 587 | 118.1 |
| C | 14 | 254 | 281291 | 1986.64 | 598 | 603 | 141.3 |
| C | 15 | 214 | 251156 | 1773.35 | 598 | 603 | 141.3 |
| C | 15 | 111 | 33377 | 231.97 | 598 | 603 | 141.3 |
| D | 1 | 52 | 1916788 | 13986.91 | 557 | 543 | 137.0 |
| D | 2 | 249 | 112690 | 818.57 | 557 | 543 | 137.0 |
| D | 12 | 233 | 109662 | 796.47 | 557 | 543 | 137.0 |
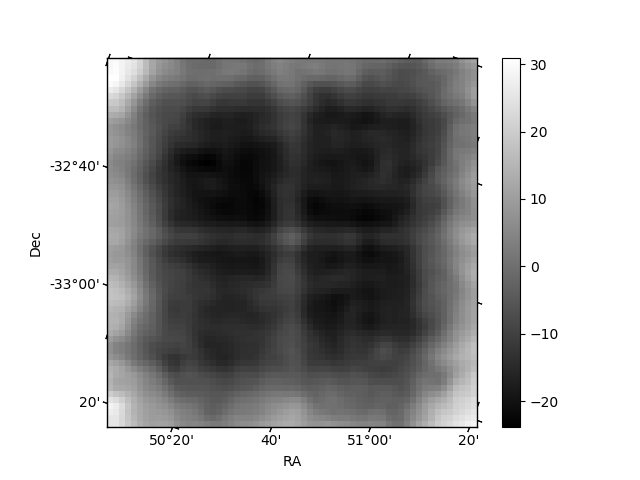
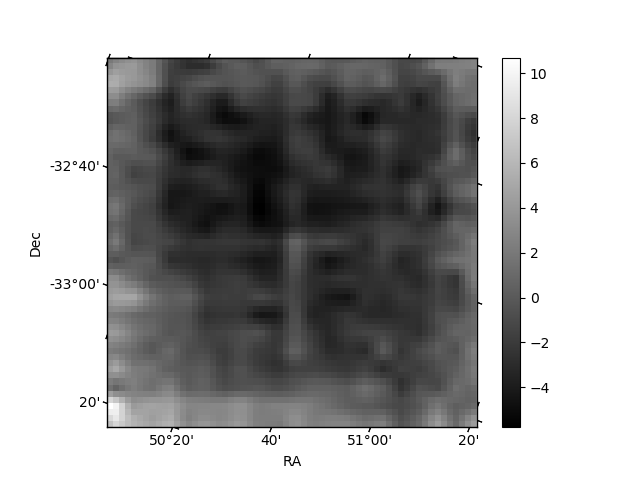
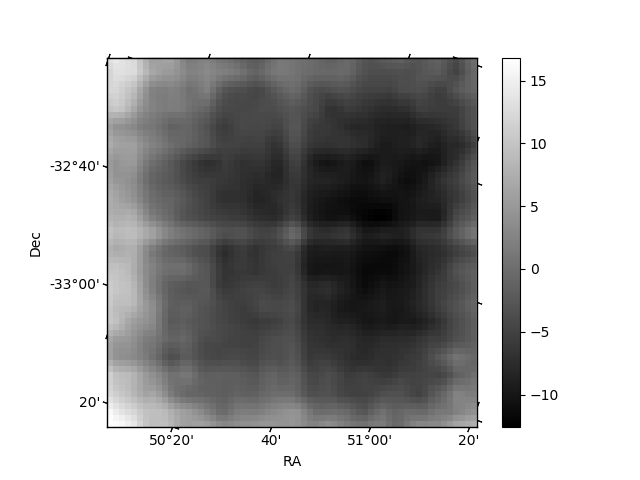
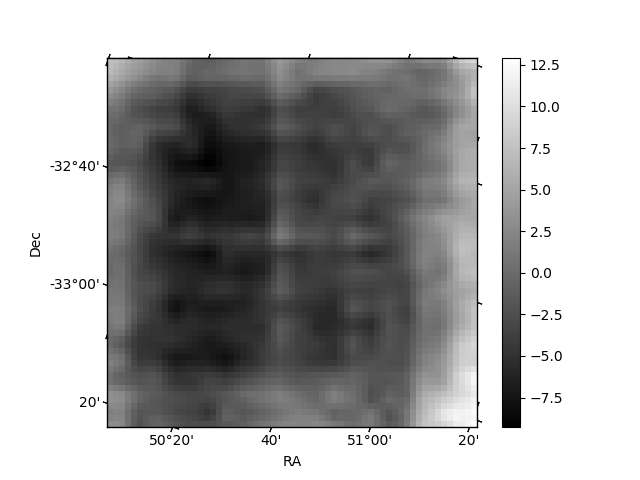
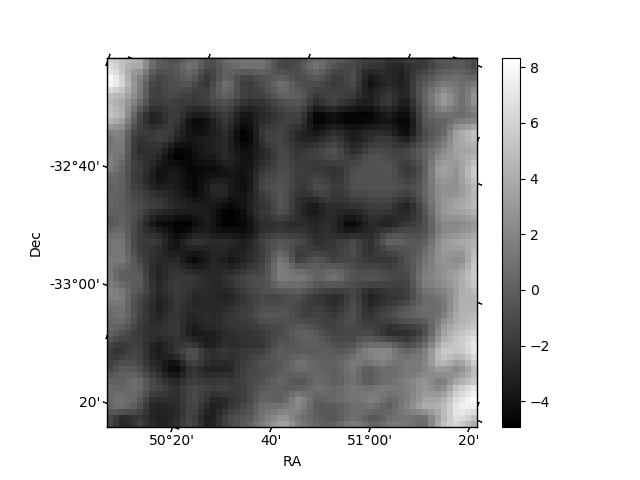
Histogram calculated using DETX and DETY for each event in the final _common_clean file
| Quadrant A | 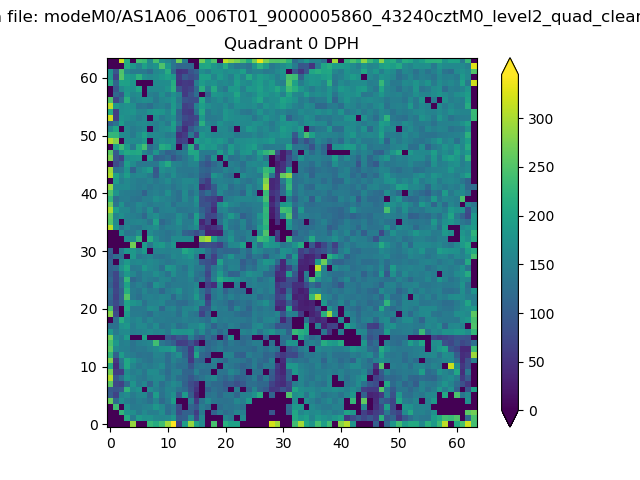 |
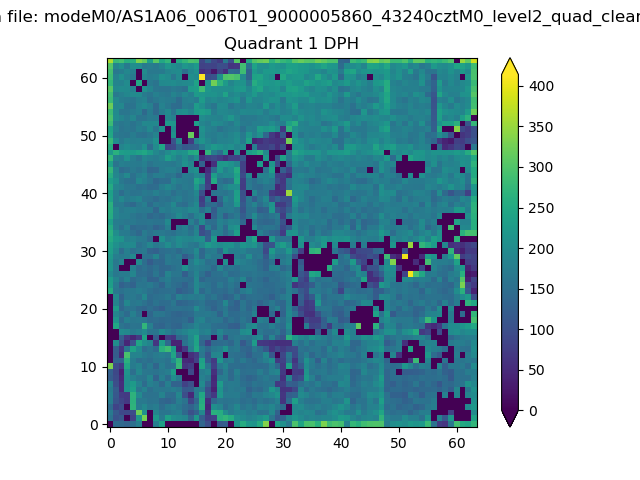 |
Quadrant B |
|---|---|---|---|
| Quadrant D | 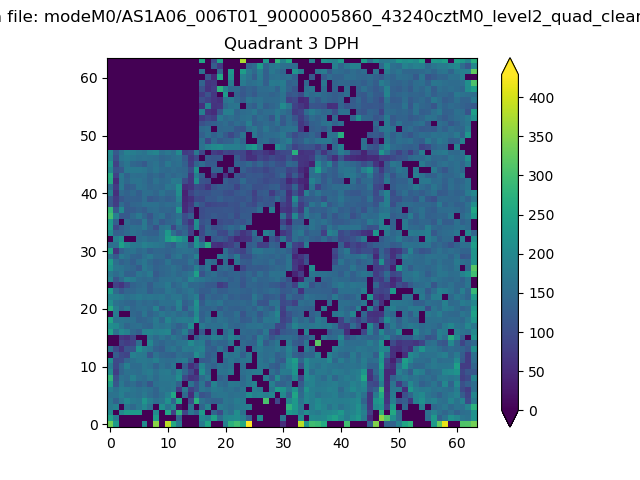 |
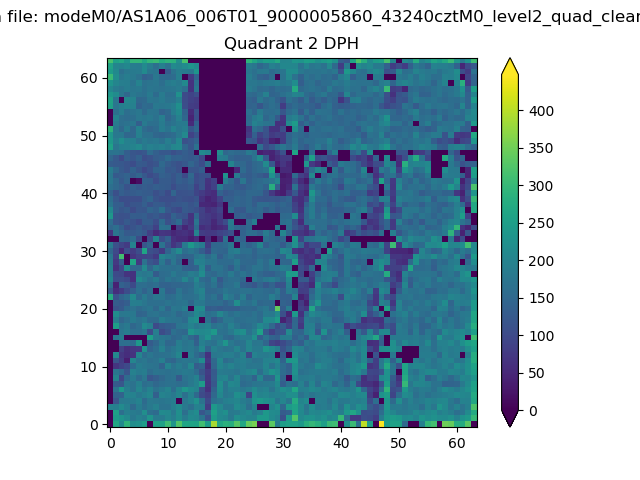 |
Quadrant C |
| Plot type | Count rate plots | Images |
|---|---|---|
| Comparison with Poisson distribution Blue bars denote a histogram of data divided into 1 sec bins. Red curve is a Poisson curve with rate = median count rate of data. |
 |
 |
| Quadrant-wise count rates Data is divided into 100 sec bins |
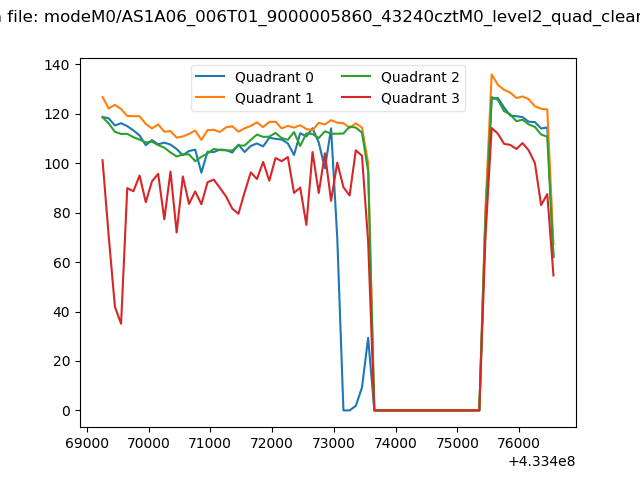 |
|
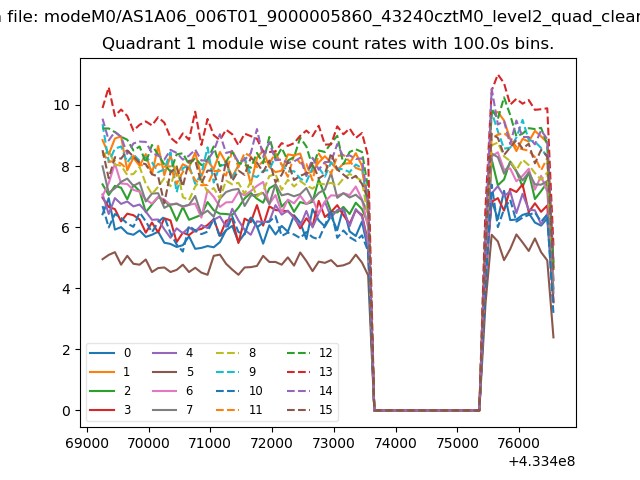
| Module-wise count rates for Quadrant A Data is divided into 100 sec bins |
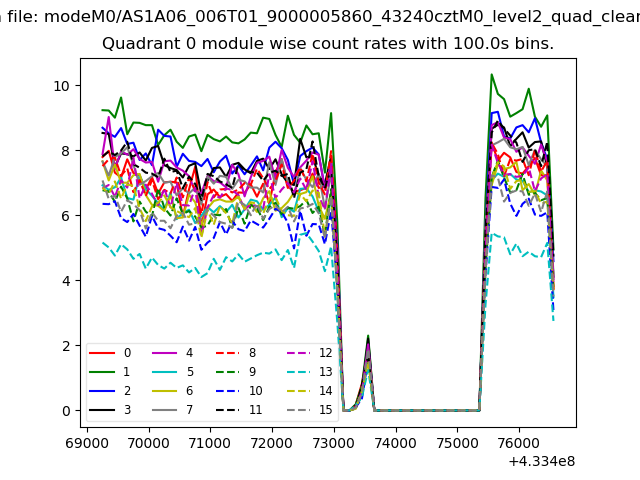 |
 |
| Module-wise count rates for Quadrant B Data is divided into 100 sec bins |
 |
 |
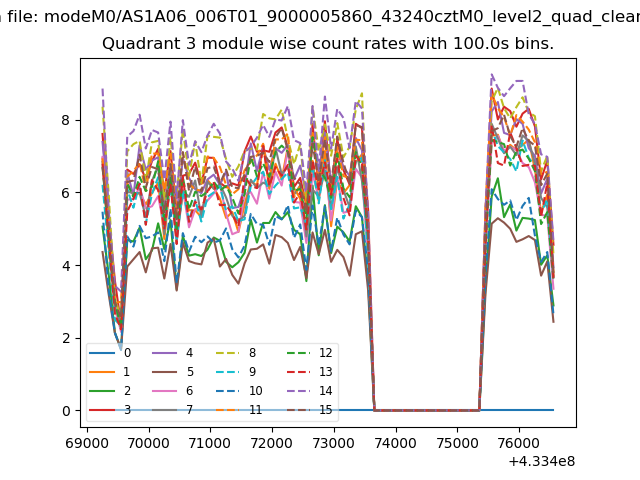
| Module-wise count rates for Quadrant C Data is divided into 100 sec bins |
 |
 |
| Module-wise count rates for Quadrant D Data is divided into 100 sec bins |
 |
 |
| Parameter | Plot |
|---|---|
| CZT HV Monitor | 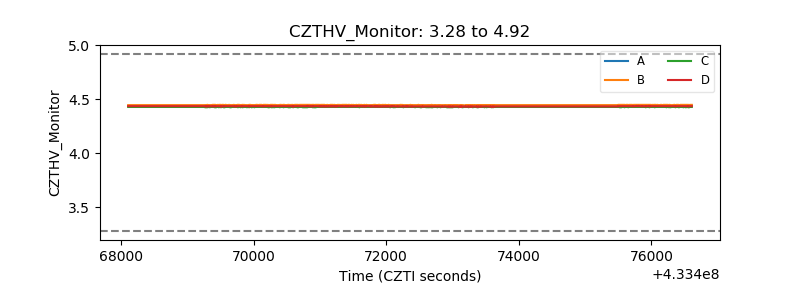 |
| D_VDD | 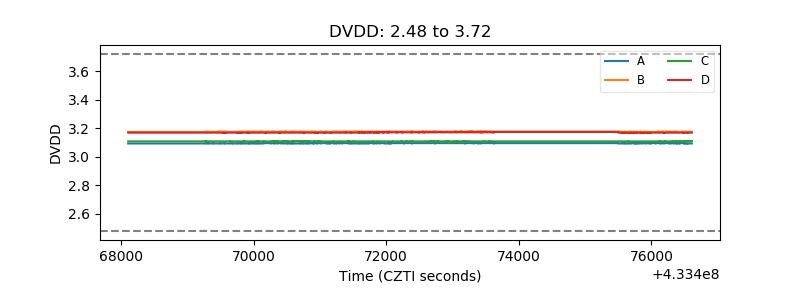 |
| Temperature 1 | 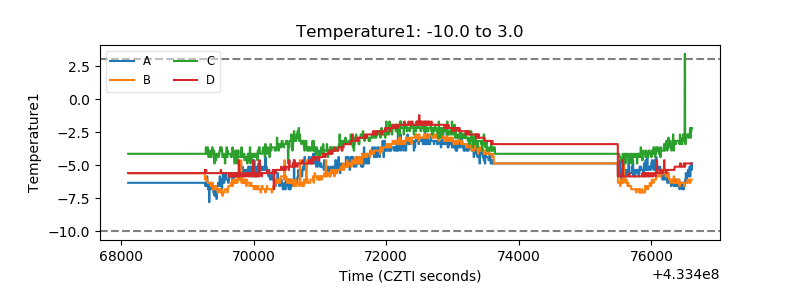 |
| Veto HV Monitor | 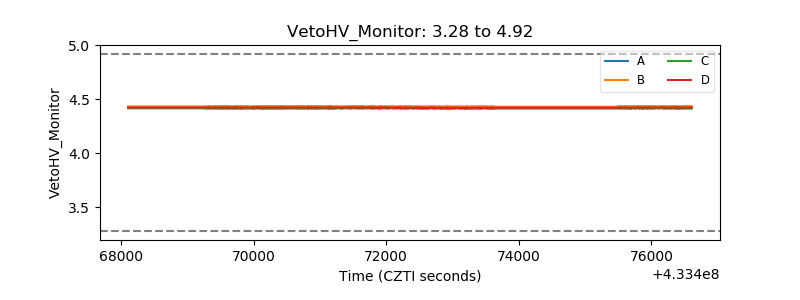 |
| Veto LLD | 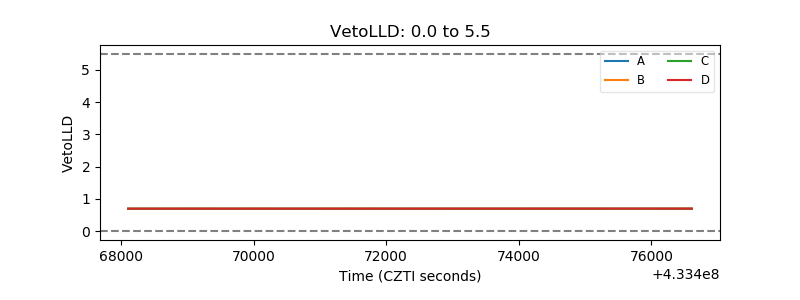 |
| Alpha Counter | 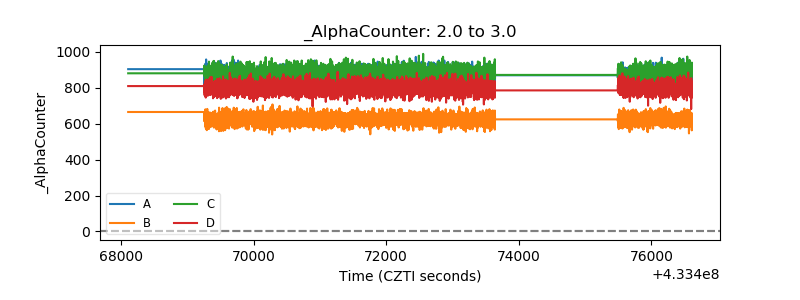 |
| _CPM_Rate | 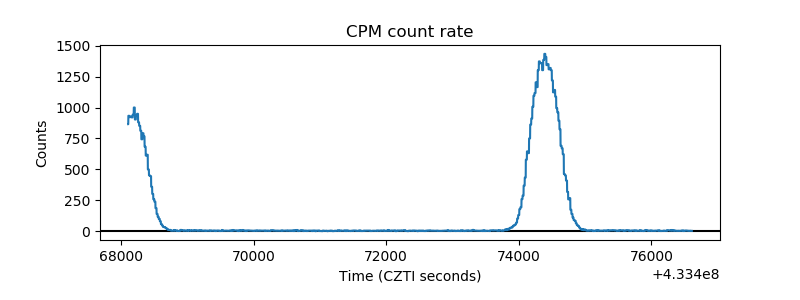 |
| CZT Counter | 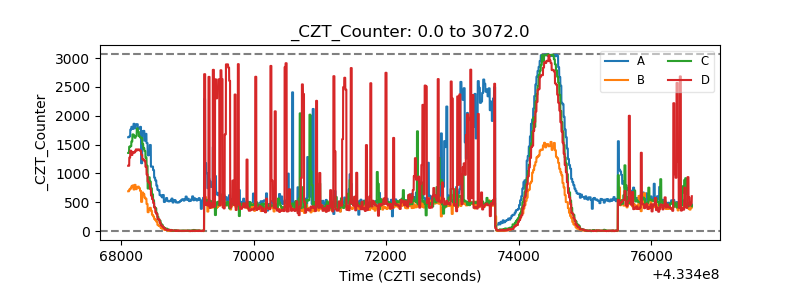 |
| +2.5 Volts monitor | 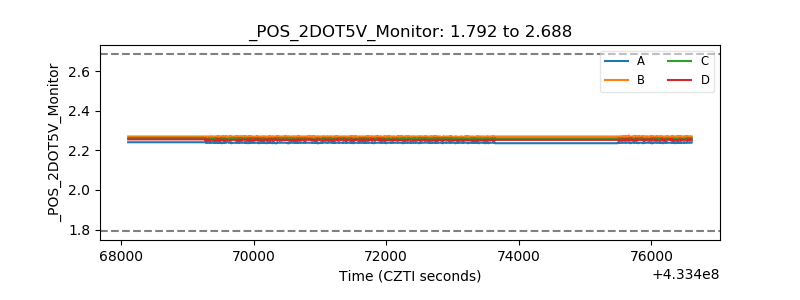 |
| +5 Volts monitor | 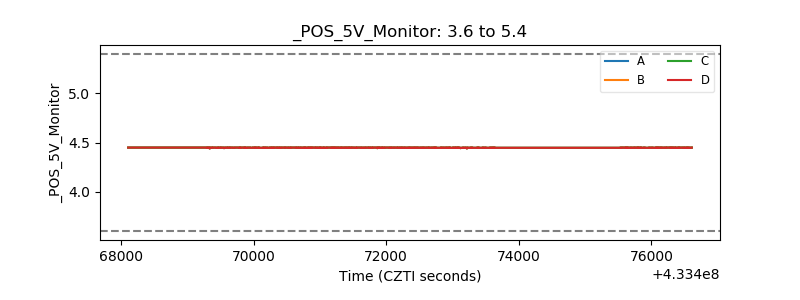 |
| _ROLL_ROT | 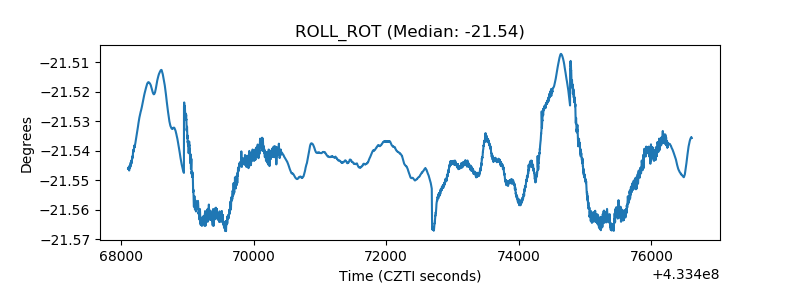 |
| _Roll_DEC |  |
| _Roll_RA | 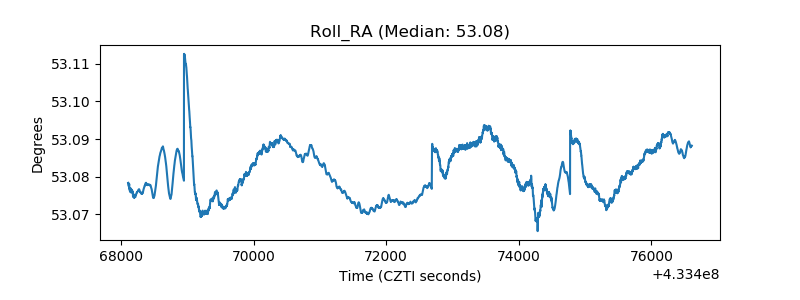 |
| Veto Counter | 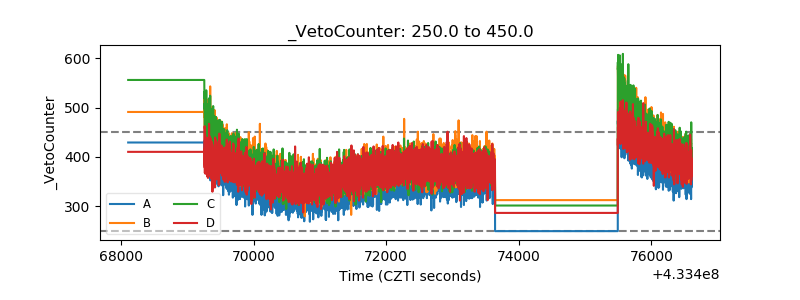 |