| Param | Original file | Final file |
|---|---|---|
| Filename | modeM0/AS1A06_006T01_9000005860_43241cztM0_level2.fits | modeM0/AS1A06_006T01_9000005860_43241cztM0_level2_quad_clean.evt |
| Size (bytes) | 337,852,800 | 87,073,920 |
| Size | 322.2 MB | 83.0 MB |
| Events in quadrant A | 3,082,439 | 587,329 |
| Events in quadrant B | 2,288,836 | 620,809 |
| Events in quadrant C | 2,623,075 | 590,530 |
| Events in quadrant D | 4,114,248 | 480,584 |
| Mode SS | |||
|---|---|---|---|
| Quadrant | BADHDUFLAG | Total packets | Discarded packets |
| A | 0 | 104 | 0 |
| B | 0 | 104 | 0 |
| C | 0 | 104 | 0 |
| D | 0 | 104 | 0 |
| Mode M9 | |||
|---|---|---|---|
| Quadrant | BADHDUFLAG | Total packets | Discarded packets |
| A | 0 | 31 | 0 |
| B | 0 | 32 | 0 |
| C | 0 | 32 | 0 |
| D | 0 | 32 | 0 |
| Mode M0 | |||
|---|---|---|---|
| Quadrant | BADHDUFLAG | Total packets | Discarded packets |
| A | 0 | 12336 | 2 |
| B | 0 | 10261 | 2 |
| C | 0 | 10711 | 2 |
| D | 0 | 15788 | 2 |
| Quadrant | Total seconds | Saturated seconds | Saturation percentage |
|---|---|---|---|
| A | 5100 | 47 | 0.921569% |
| B | 5100 | 4 | 0.078431% |
| C | 5100 | 8 | 0.156863% |
| D | 5100 | 663 | 13.000000% |
Noise dominated data is calculated using 1-second bins in cleaned event files. If a bin has >2000 counts, and if more than 50% of those come from <1% of pixels, then it is considered to be noise-dominated and hence unusable.
| Quadrant | # 1 sec bins | Bins with >0 counts | Bins with >2000 counts | High rate bins dominated by noise | Noise dominated (total time) | Noise dominated (detector-on time) | Marked lightcurve |
|---|---|---|---|---|---|---|---|
| A | 7074 | 5101 | 47 | 47 | 0.66% | 0.92% | 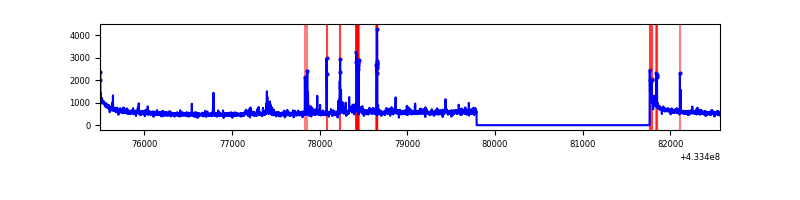 |
| B | 7074 | 5101 | 1 | 1 | 0.01% | 0.02% | 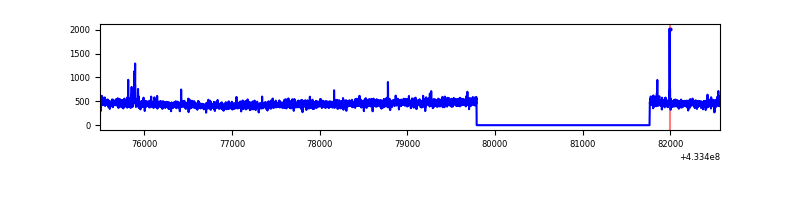 |
| C | 7074 | 5101 | 5 | 5 | 0.07% | 0.10% | 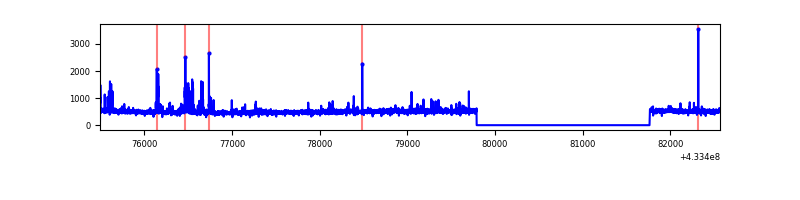 |
| D | 7074 | 5101 | 624 | 624 | 8.82% | 12.23% | 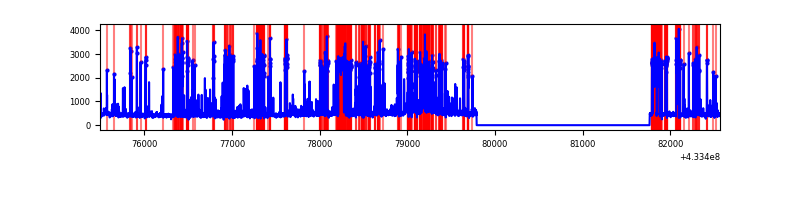 |
Top three noisy pixels from each quadrant. If the there are fewer than three noisy pixels in the level2.evt file, extra rows are filled as -1
| Pixel properties | Quadrant properties | ||||||
|---|---|---|---|---|---|---|---|
| Quadrant | DetID | PixID | Counts | Sigma | Mean | Median | Sigma |
| A | 10 | 83 | 558932 | 4759.27 | 574 | 564 | 117.3 |
| A | 15 | 237 | 197878 | 1681.81 | 574 | 564 | 117.3 |
| A | 12 | 189 | 81805 | 692.46 | 574 | 564 | 117.3 |
| B | 5 | 255 | 21617 | 189.24 | 575 | 560 | 111.3 |
| B | 12 | 111 | 13891 | 119.81 | 575 | 560 | 111.3 |
| B | 11 | 111 | 12885 | 110.76 | 575 | 560 | 111.3 |
| C | 15 | 214 | 234176 | 1730.82 | 573 | 578 | 135.0 |
| C | 14 | 254 | 125708 | 927.14 | 573 | 578 | 135.0 |
| C | 15 | 111 | 20514 | 147.71 | 573 | 578 | 135.0 |
| D | 1 | 52 | 1899418 | 14808.32 | 525 | 511 | 128.2 |
| D | 2 | 249 | 168142 | 1307.24 | 525 | 511 | 128.2 |
| D | 12 | 233 | 24899 | 190.19 | 525 | 511 | 128.2 |
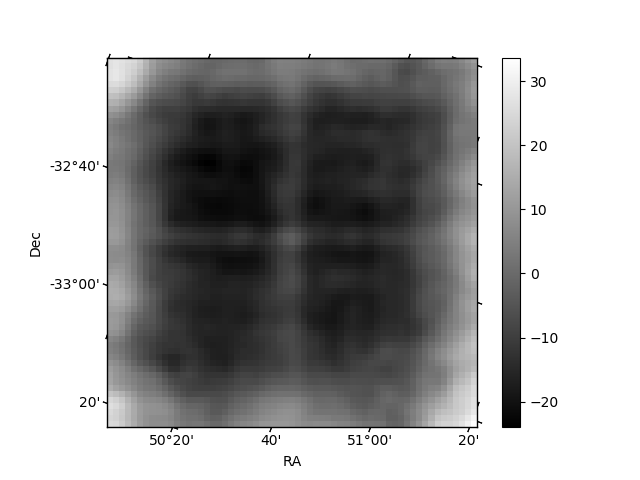
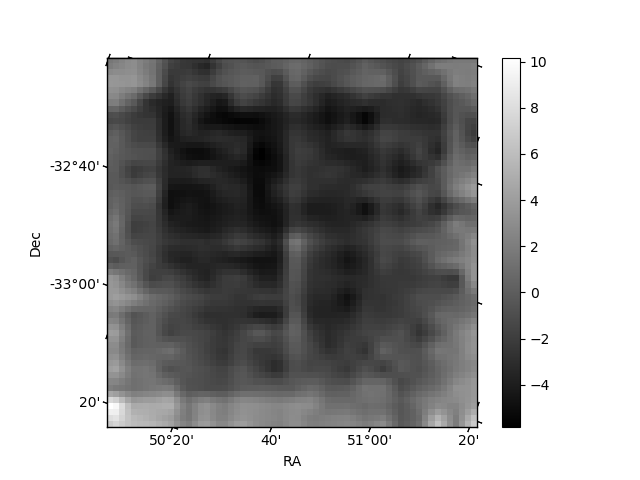
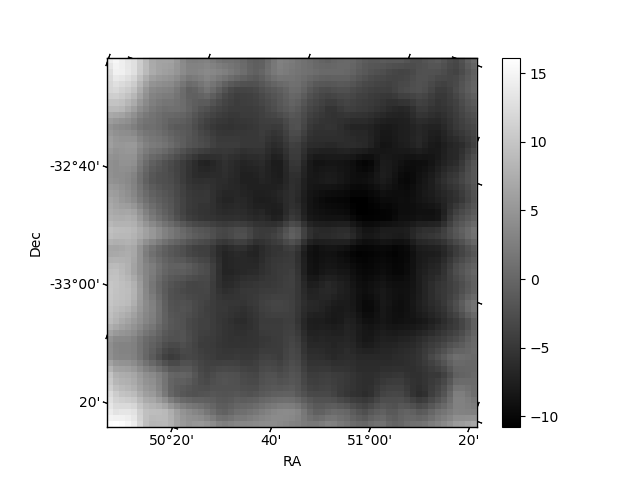
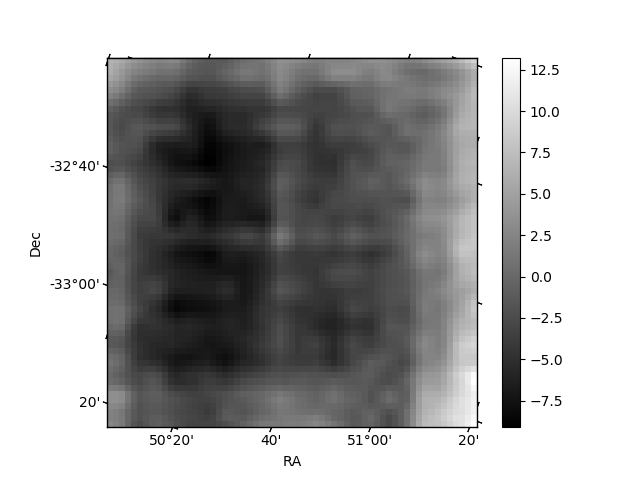
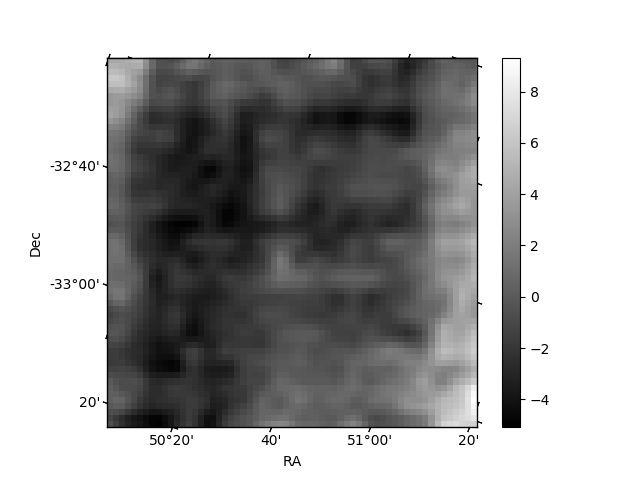
Histogram calculated using DETX and DETY for each event in the final _common_clean file
| Quadrant A | 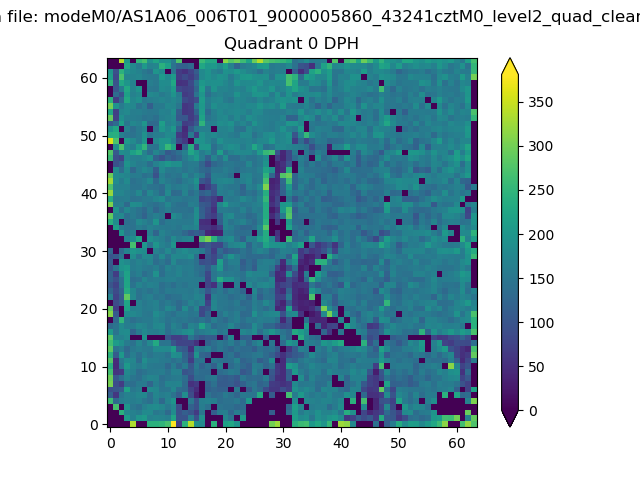 |
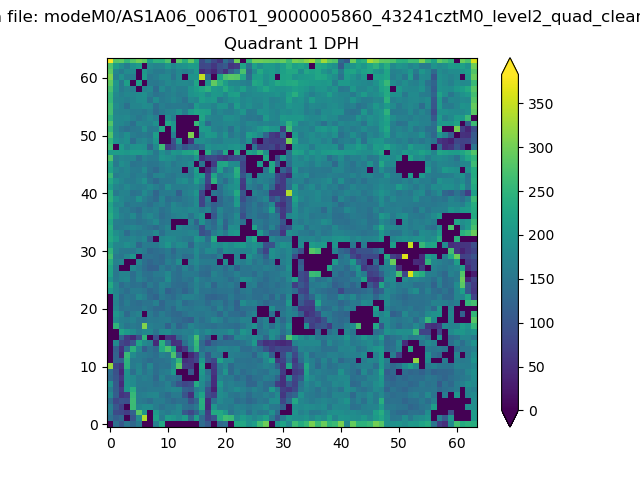 |
Quadrant B |
|---|---|---|---|
| Quadrant D | 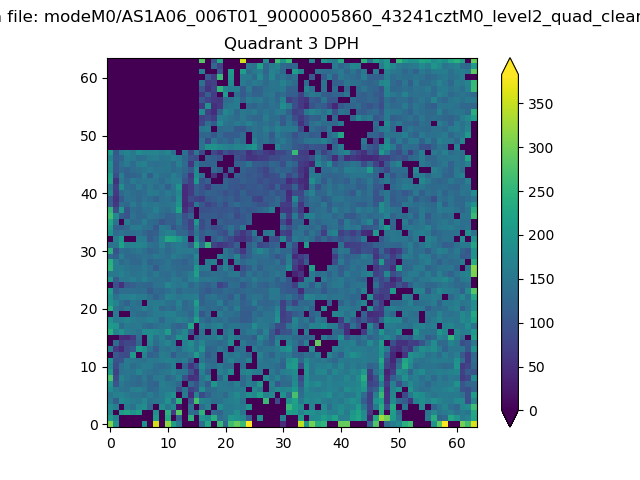 |
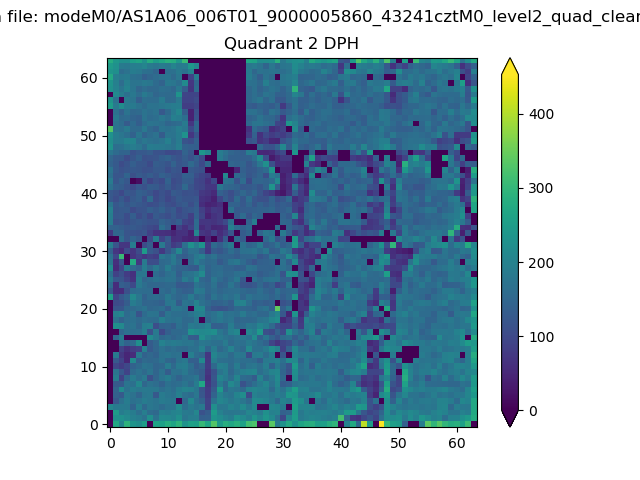 |
Quadrant C |
| Plot type | Count rate plots | Images |
|---|---|---|
| Comparison with Poisson distribution Blue bars denote a histogram of data divided into 1 sec bins. Red curve is a Poisson curve with rate = median count rate of data. |
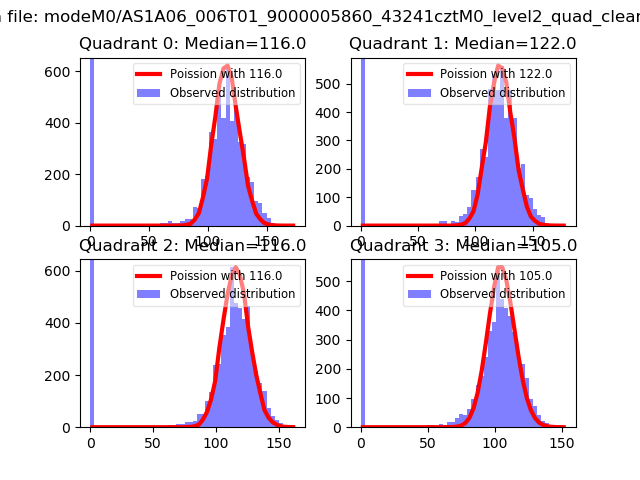 |
 |
| Quadrant-wise count rates Data is divided into 100 sec bins |
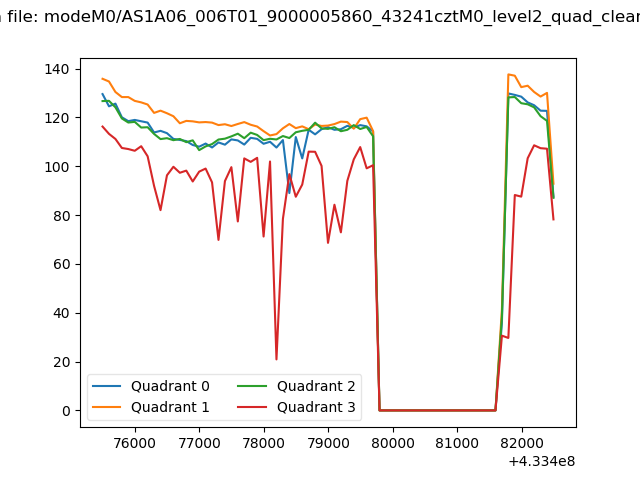 |
|
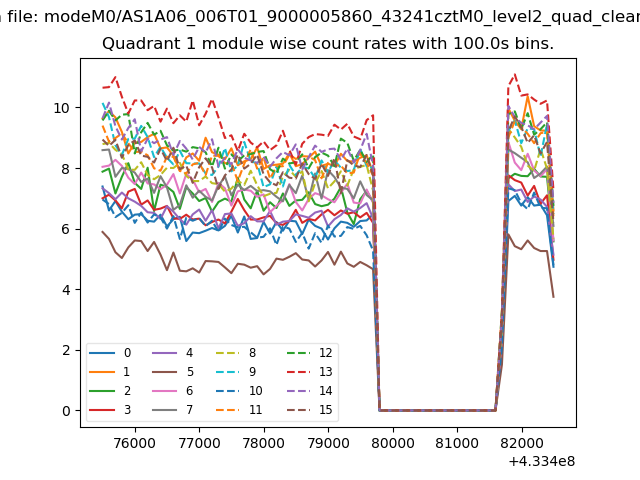
| Module-wise count rates for Quadrant A Data is divided into 100 sec bins |
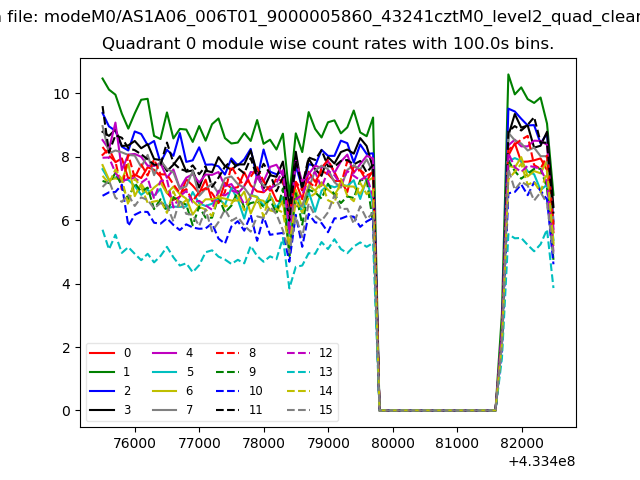 |
 |
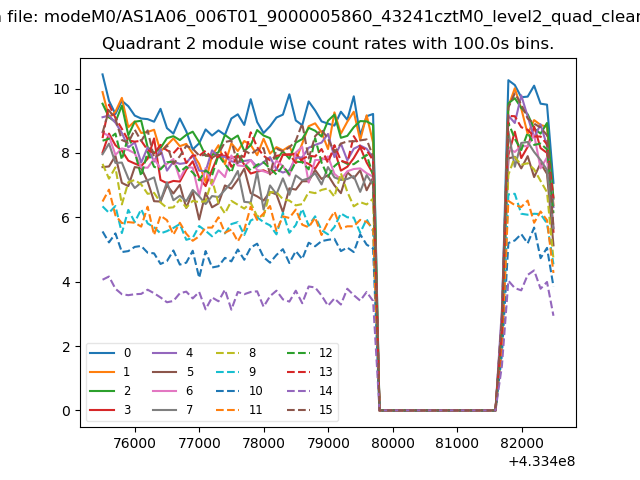
| Module-wise count rates for Quadrant B Data is divided into 100 sec bins |
 |
 |
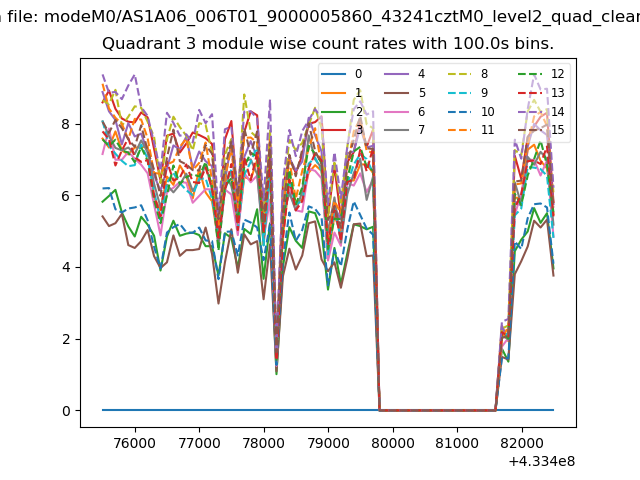
| Module-wise count rates for Quadrant C Data is divided into 100 sec bins |
 |
 |
| Module-wise count rates for Quadrant D Data is divided into 100 sec bins |
 |
 |
| Parameter | Plot |
|---|---|
| CZT HV Monitor | 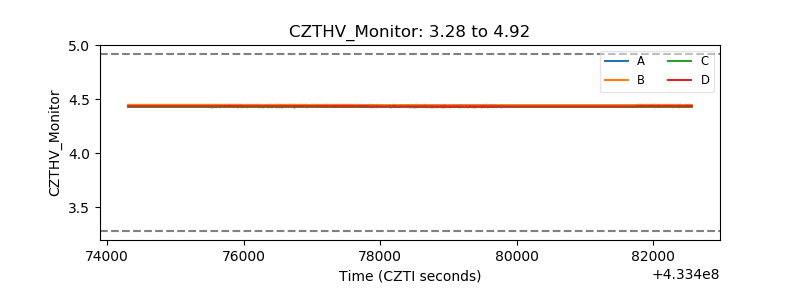 |
| D_VDD | 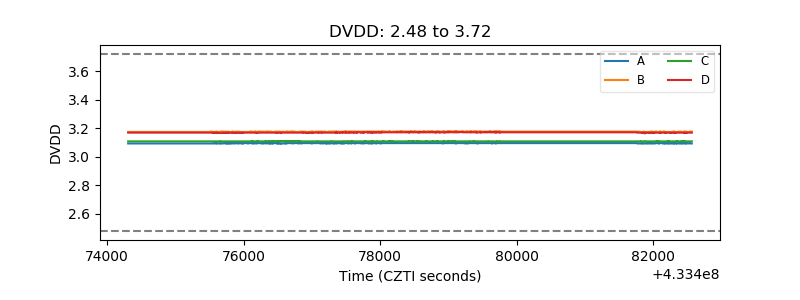 |
| Temperature 1 | 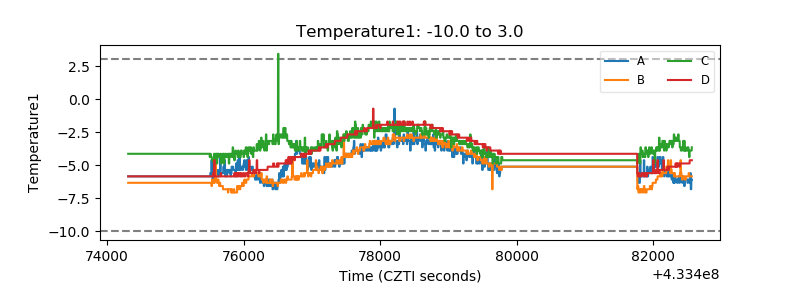 |
| Veto HV Monitor |  |
| Veto LLD | 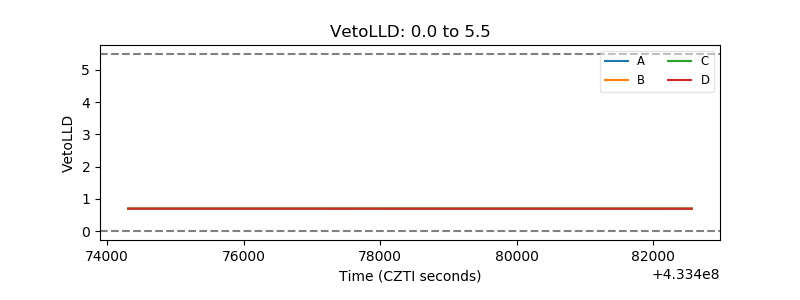 |
| Alpha Counter | 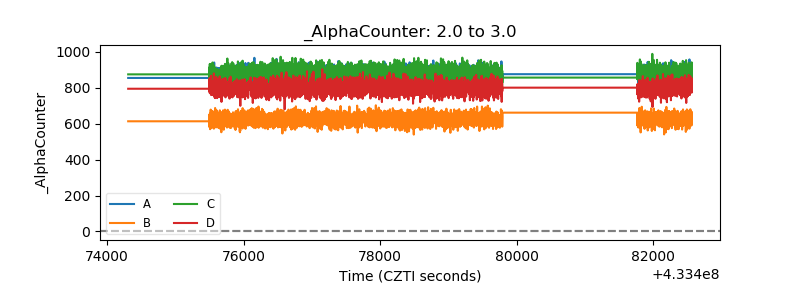 |
| _CPM_Rate | 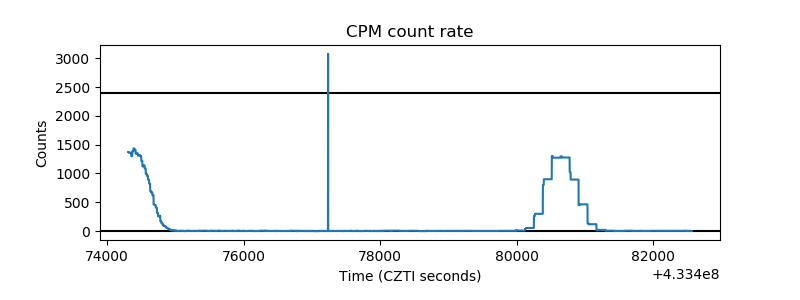 |
| CZT Counter | 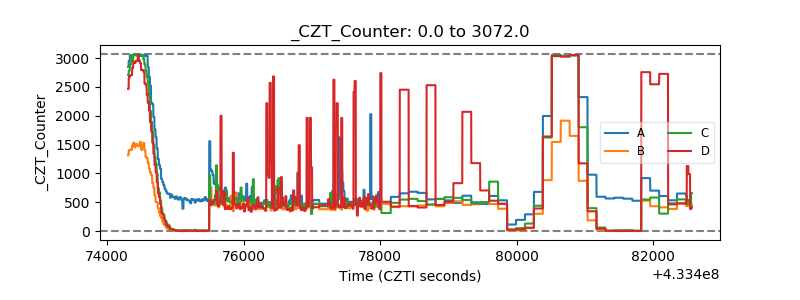 |
| +2.5 Volts monitor | 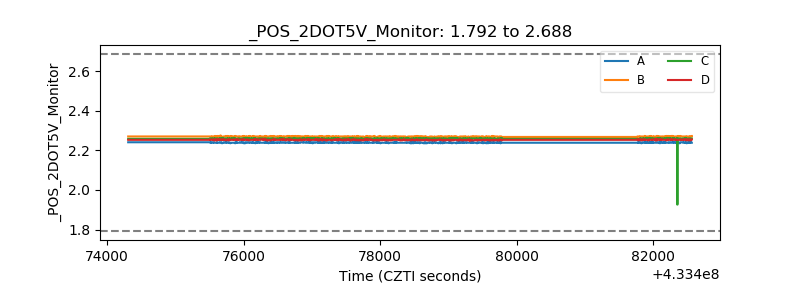 |
| +5 Volts monitor | 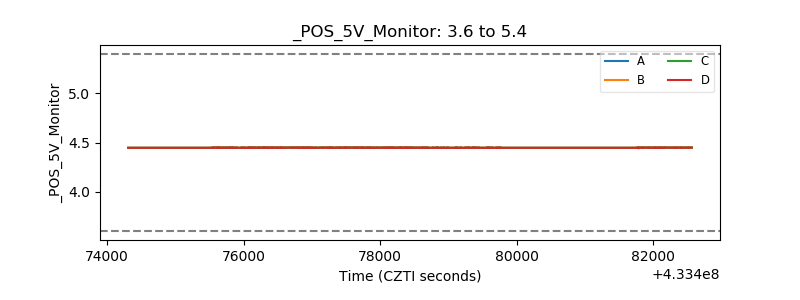 |
| _ROLL_ROT | 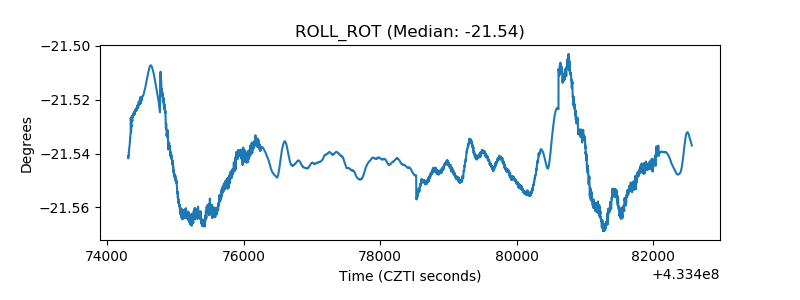 |
| _Roll_DEC | 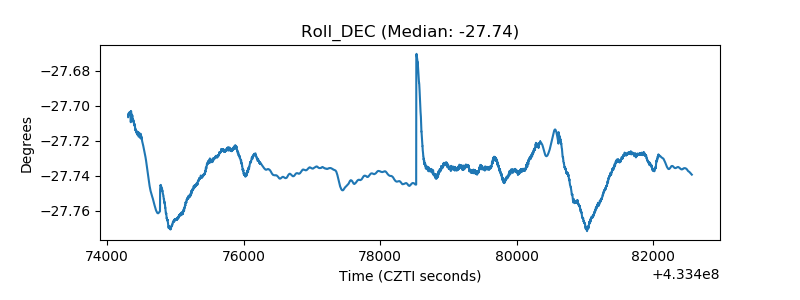 |
| _Roll_RA | 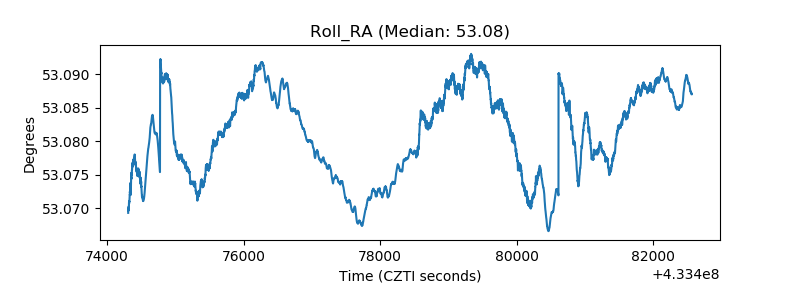 |
| Veto Counter | 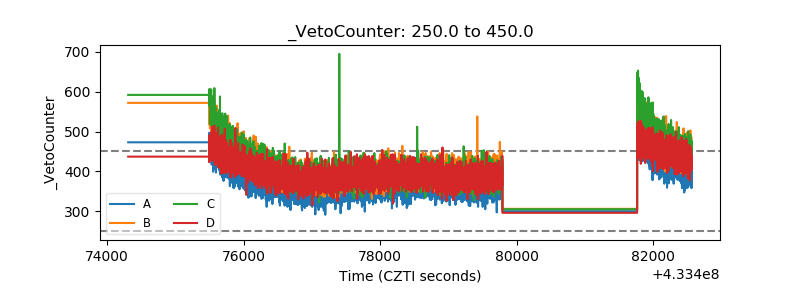 |