| Param | Original file | Final file |
|---|---|---|
| Filename | modeM0/AS1A06_006T01_9000005860_43242cztM0_level2.fits | modeM0/AS1A06_006T01_9000005860_43242cztM0_level2_quad_clean.evt |
| Size (bytes) | 301,976,640 | 86,702,400 |
| Size | 288.0 MB | 82.7 MB |
| Events in quadrant A | 2,870,309 | 582,127 |
| Events in quadrant B | 2,263,857 | 610,204 |
| Events in quadrant C | 2,461,204 | 583,489 |
| Events in quadrant D | 3,197,831 | 503,811 |
| Mode SS | |||
|---|---|---|---|
| Quadrant | BADHDUFLAG | Total packets | Discarded packets |
| A | 0 | 100 | 0 |
| B | 0 | 100 | 0 |
| C | 0 | 100 | 0 |
| D | 0 | 100 | 0 |
| Mode M9 | |||
|---|---|---|---|
| Quadrant | BADHDUFLAG | Total packets | Discarded packets |
| A | 0 | 32 | 0 |
| B | 0 | 33 | 0 |
| C | 0 | 33 | 0 |
| D | 0 | 33 | 0 |
| Mode M0 | |||
|---|---|---|---|
| Quadrant | BADHDUFLAG | Total packets | Discarded packets |
| A | 0 | 11449 | 2 |
| B | 0 | 9968 | 2 |
| C | 0 | 10047 | 2 |
| D | 0 | 12810 | 2 |
| Quadrant | Total seconds | Saturated seconds | Saturation percentage |
|---|---|---|---|
| A | 4934 | 20 | 0.405351% |
| B | 4934 | 7 | 0.141873% |
| C | 4934 | 5 | 0.101338% |
| D | 4934 | 328 | 6.647750% |
Noise dominated data is calculated using 1-second bins in cleaned event files. If a bin has >2000 counts, and if more than 50% of those come from <1% of pixels, then it is considered to be noise-dominated and hence unusable.
| Quadrant | # 1 sec bins | Bins with >0 counts | Bins with >2000 counts | High rate bins dominated by noise | Noise dominated (total time) | Noise dominated (detector-on time) | Marked lightcurve |
|---|---|---|---|---|---|---|---|
| A | 7025 | 4935 | 15 | 15 | 0.21% | 0.30% | 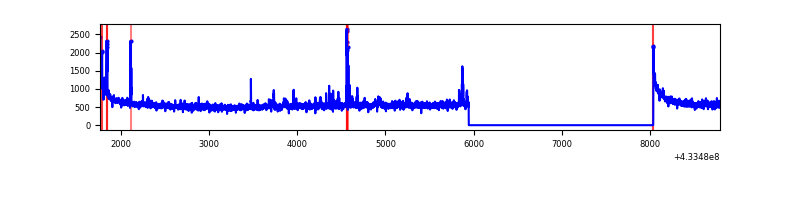 |
| B | 7025 | 4935 | 1 | 1 | 0.01% | 0.02% | 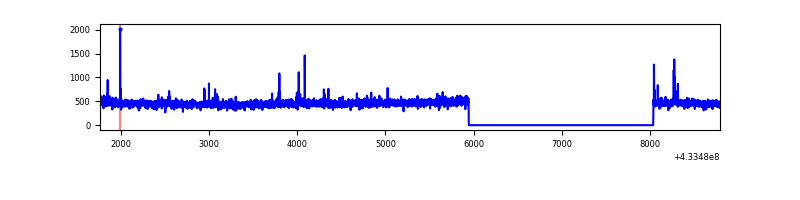 |
| C | 7025 | 4935 | 1 | 1 | 0.01% | 0.02% | 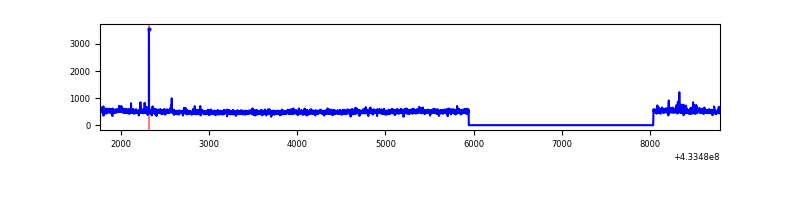 |
| D | 7025 | 4935 | 300 | 300 | 4.27% | 6.08% | 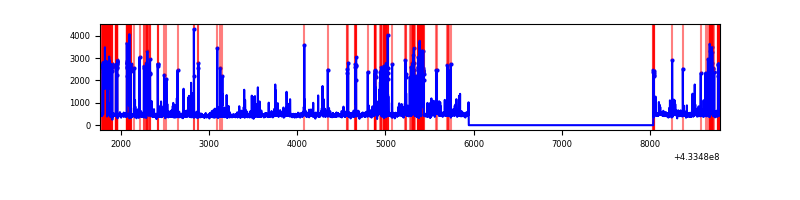 |
Top three noisy pixels from each quadrant. If the there are fewer than three noisy pixels in the level2.evt file, extra rows are filled as -1
| Pixel properties | Quadrant properties | ||||||
|---|---|---|---|---|---|---|---|
| Quadrant | DetID | PixID | Counts | Sigma | Mean | Median | Sigma |
| A | 10 | 83 | 529780 | 4569.05 | 566 | 554 | 115.8 |
| A | 12 | 189 | 87244 | 748.43 | 566 | 554 | 115.8 |
| A | 13 | 248 | 34013 | 288.87 | 566 | 554 | 115.8 |
| B | 5 | 255 | 37183 | 335.99 | 563 | 548 | 109.0 |
| B | 0 | 189 | 17409 | 154.63 | 563 | 548 | 109.0 |
| B | 12 | 111 | 13647 | 120.13 | 563 | 548 | 109.0 |
| C | 15 | 214 | 227183 | 1718.79 | 563 | 568 | 131.8 |
| C | 14 | 254 | 23527 | 174.13 | 563 | 568 | 131.8 |
| C | 7 | 220 | 11154 | 80.29 | 563 | 568 | 131.8 |
| D | 1 | 52 | 1022841 | 7749.33 | 539 | 525 | 131.9 |
| D | 2 | 249 | 55188 | 414.35 | 539 | 525 | 131.9 |
| D | 1 | 47 | 29736 | 221.42 | 539 | 525 | 131.9 |
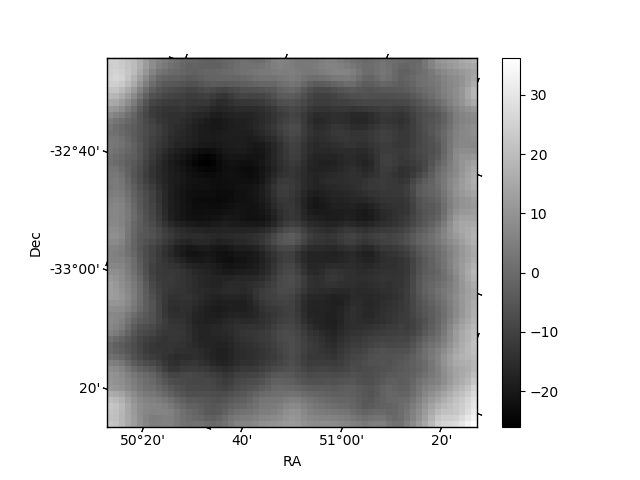
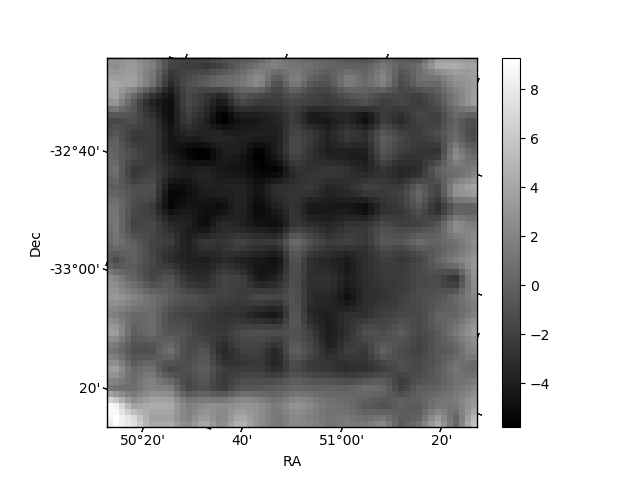
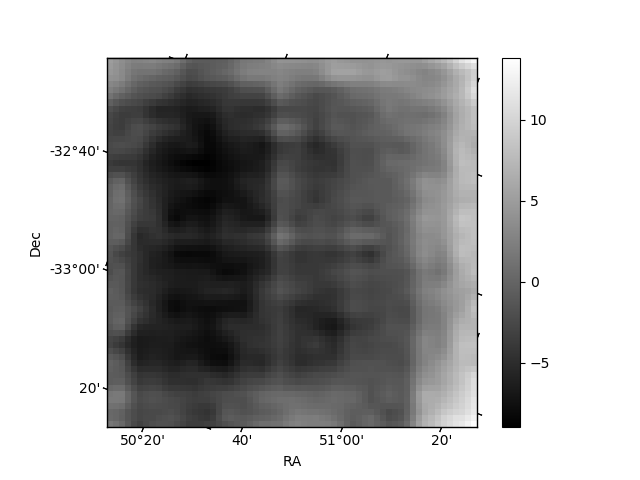
Histogram calculated using DETX and DETY for each event in the final _common_clean file
| Quadrant A | 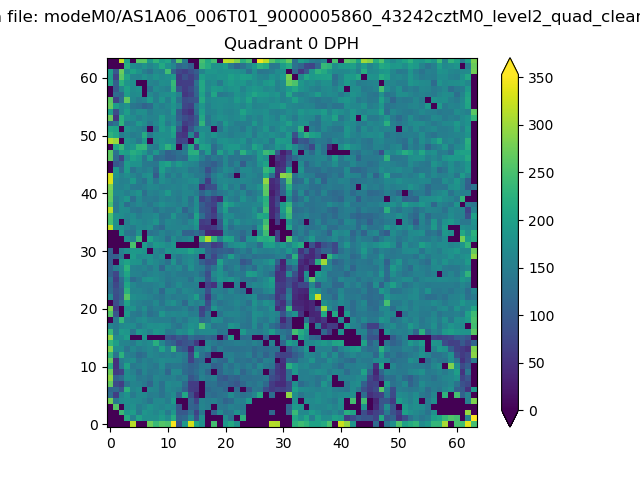 |
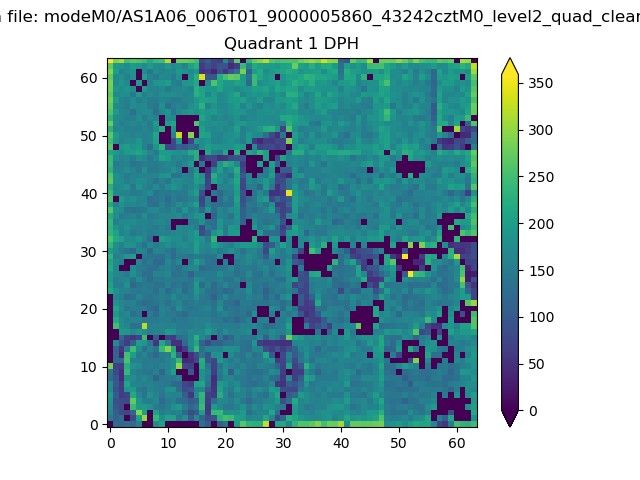 |
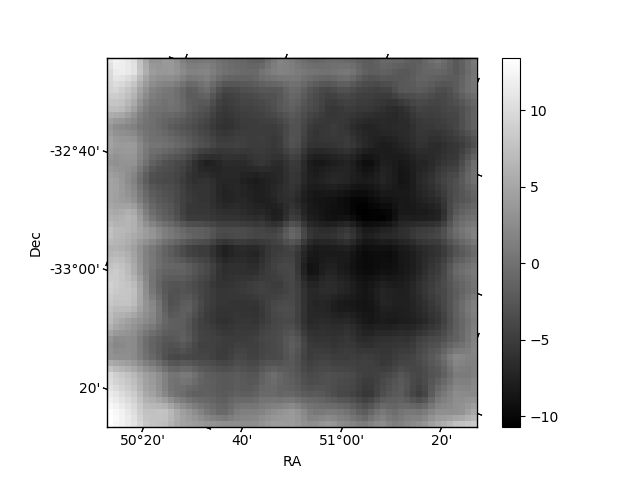
Quadrant B |
|---|---|---|---|
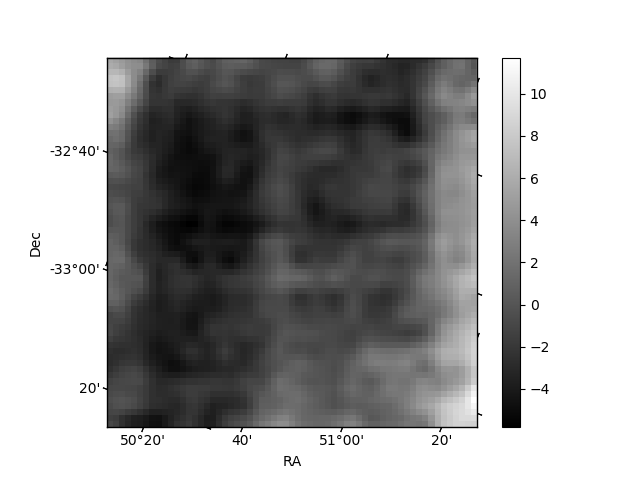
| Quadrant D | 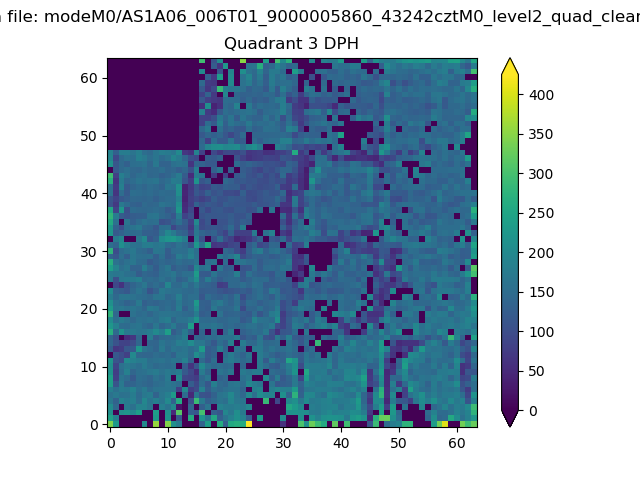 |
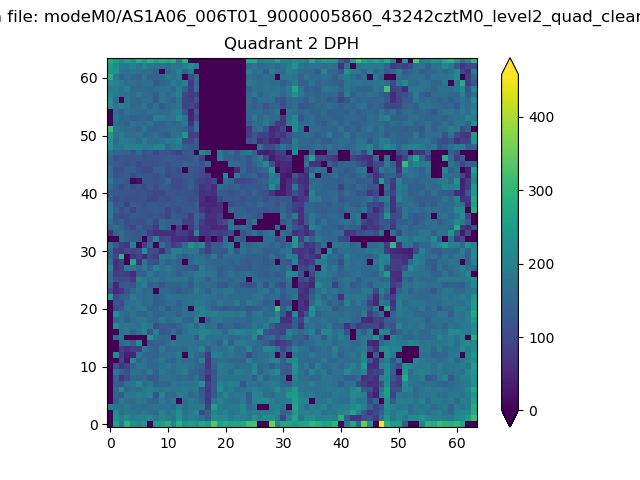 |
Quadrant C |
| Plot type | Count rate plots | Images |
|---|---|---|
| Comparison with Poisson distribution Blue bars denote a histogram of data divided into 1 sec bins. Red curve is a Poisson curve with rate = median count rate of data. |
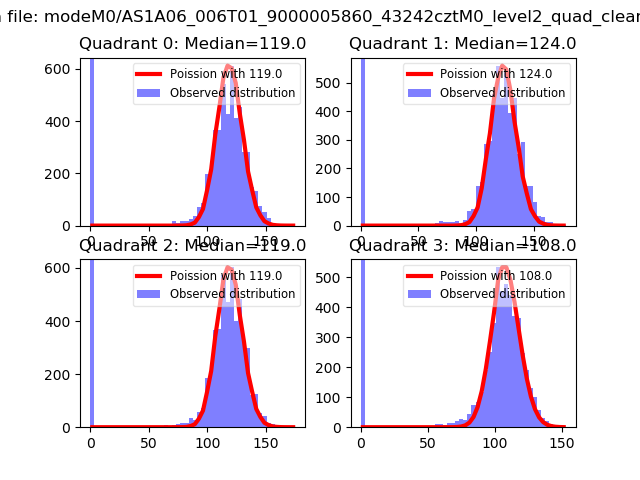 |
 |
| Quadrant-wise count rates Data is divided into 100 sec bins |
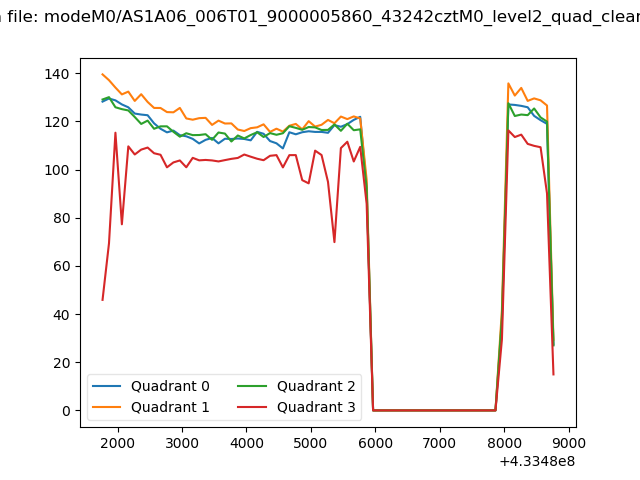 |
|
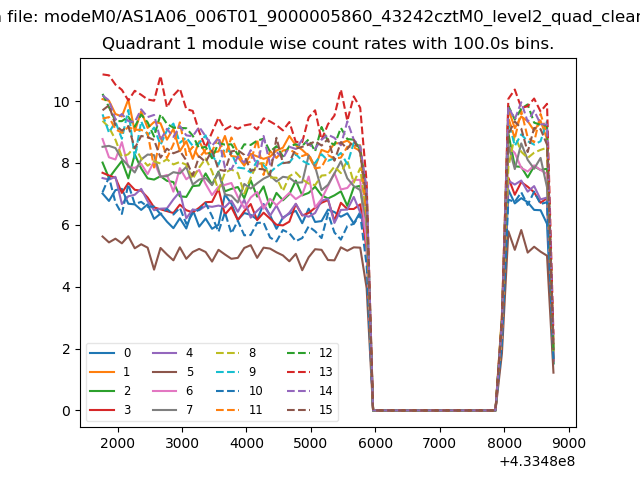
| Module-wise count rates for Quadrant A Data is divided into 100 sec bins |
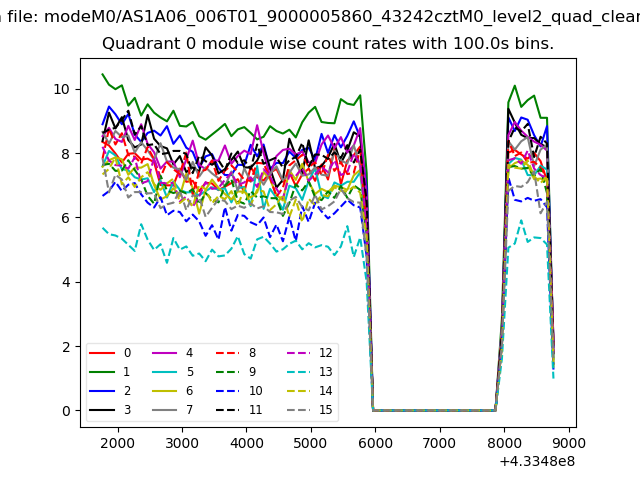 |
 |
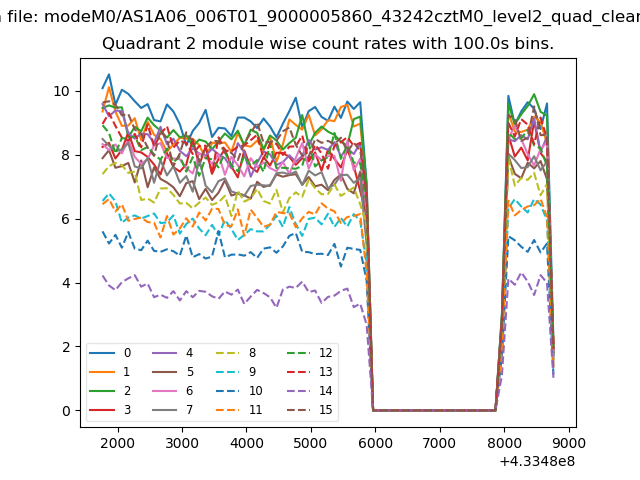
| Module-wise count rates for Quadrant B Data is divided into 100 sec bins |
 |
 |
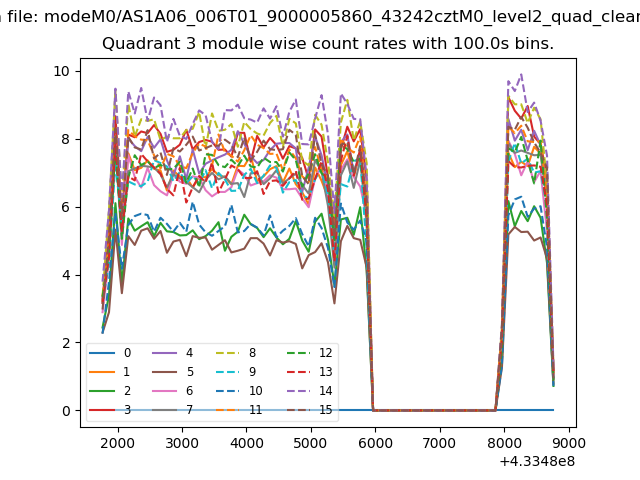
| Module-wise count rates for Quadrant C Data is divided into 100 sec bins |
 |
 |
| Module-wise count rates for Quadrant D Data is divided into 100 sec bins |
 |
 |
| Parameter | Plot |
|---|---|
| CZT HV Monitor | 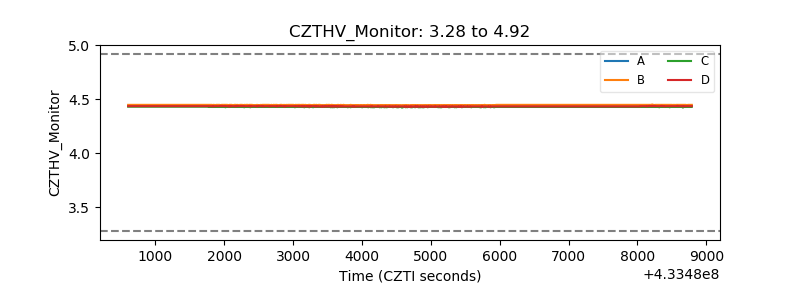 |
| D_VDD | 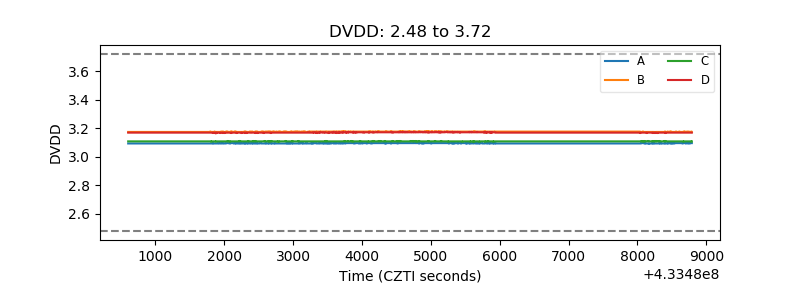 |
| Temperature 1 | 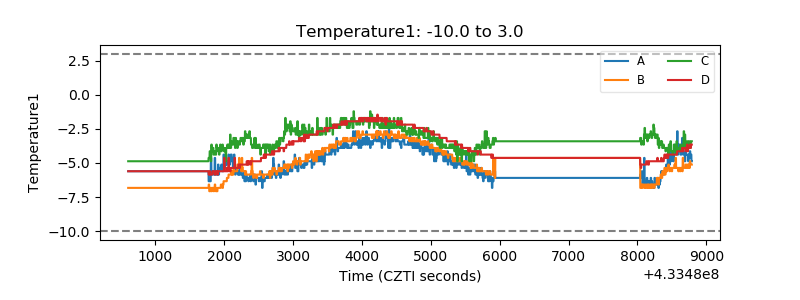 |
| Veto HV Monitor | 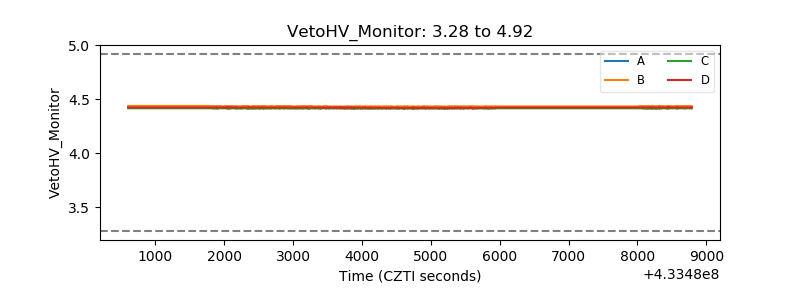 |
| Veto LLD | 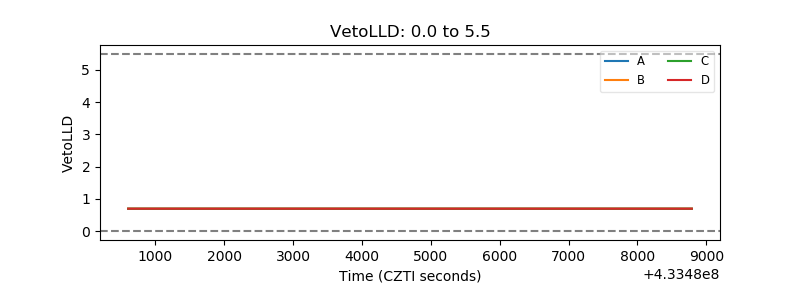 |
| Alpha Counter | 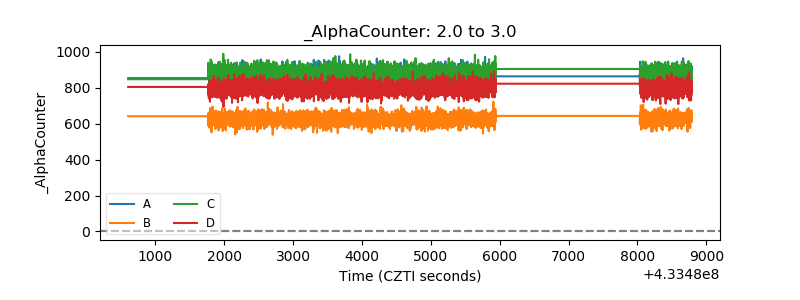 |
| _CPM_Rate | 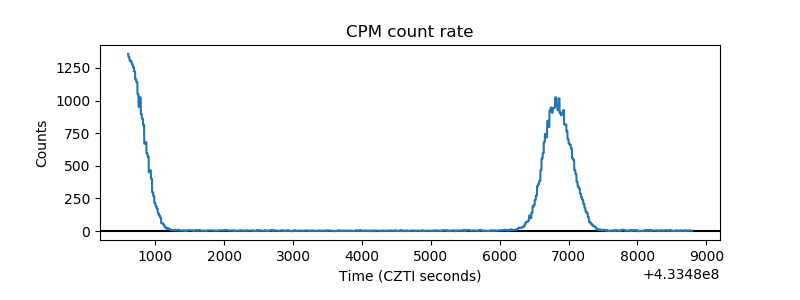 |
| CZT Counter | 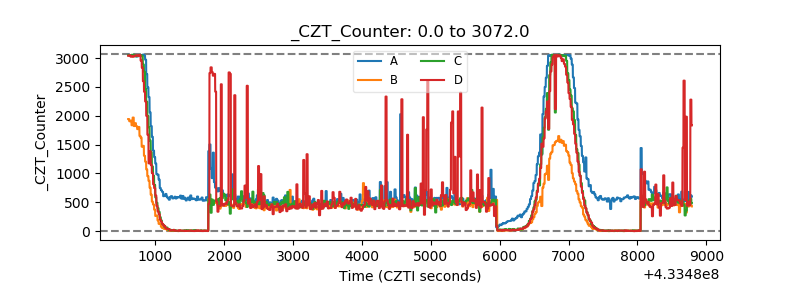 |
| +2.5 Volts monitor | 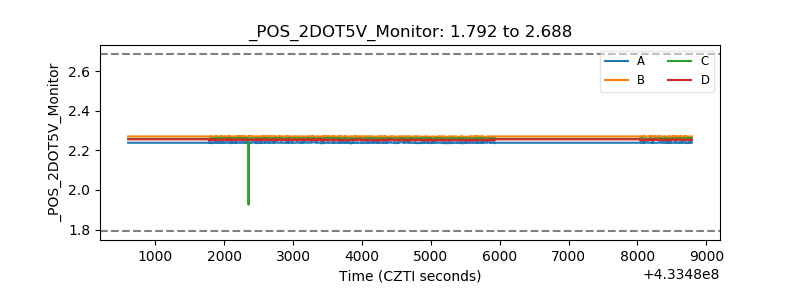 |
| +5 Volts monitor | 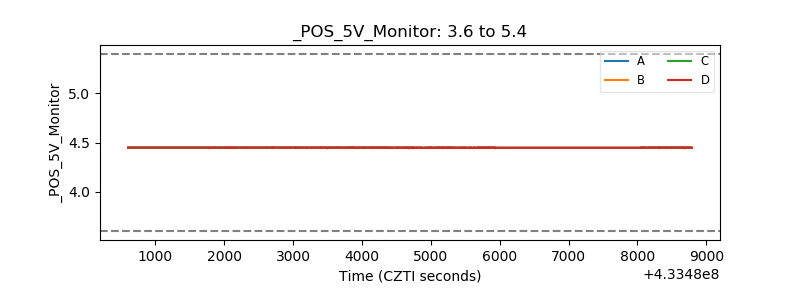 |
| _ROLL_ROT | 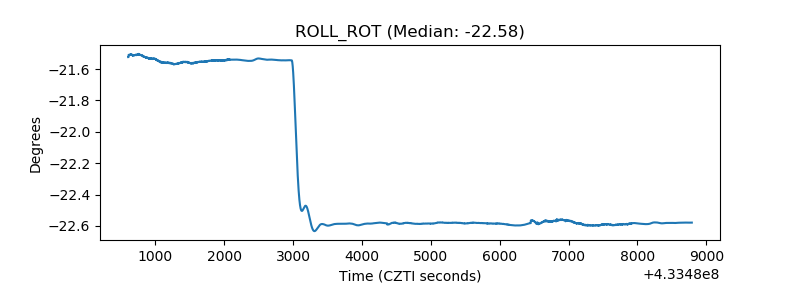 |
| _Roll_DEC | 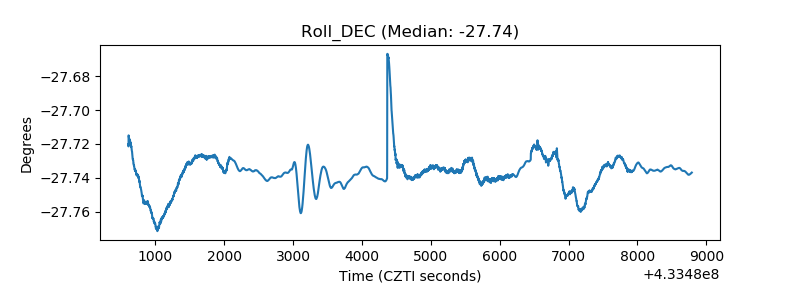 |
| _Roll_RA | 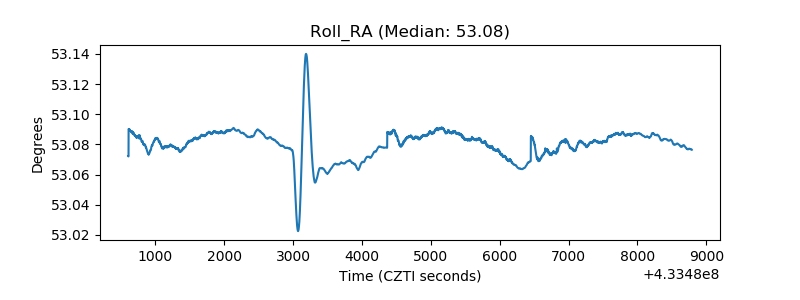 |
| Veto Counter | 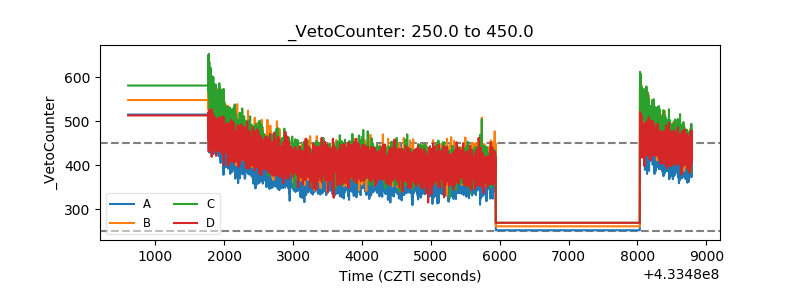 |