| Param | Original file | Final file |
|---|---|---|
| Filename | modeM0/AS1A06_006T01_9000005860_43243cztM0_level2.fits | modeM0/AS1A06_006T01_9000005860_43243cztM0_level2_quad_clean.evt |
| Size (bytes) | 354,283,200 | 82,287,360 |
| Size | 337.9 MB | 78.5 MB |
| Events in quadrant A | 3,123,441 | 562,462 |
| Events in quadrant B | 2,318,141 | 596,387 |
| Events in quadrant C | 2,488,495 | 573,683 |
| Events in quadrant D | 4,800,103 | 413,332 |
| Mode SS | |||
|---|---|---|---|
| Quadrant | BADHDUFLAG | Total packets | Discarded packets |
| A | 0 | 102 | 0 |
| B | 0 | 102 | 0 |
| C | 0 | 102 | 0 |
| D | 0 | 102 | 0 |
| Mode M9 | |||
|---|---|---|---|
| Quadrant | BADHDUFLAG | Total packets | Discarded packets |
| A | 0 | 31 | 0 |
| B | 0 | 32 | 0 |
| C | 0 | 32 | 0 |
| D | 0 | 32 | 0 |
| Mode M0 | |||
|---|---|---|---|
| Quadrant | BADHDUFLAG | Total packets | Discarded packets |
| A | 0 | 12218 | 2 |
| B | 0 | 10138 | 2 |
| C | 0 | 10179 | 2 |
| D | 0 | 17563 | 2 |
| Quadrant | Total seconds | Saturated seconds | Saturation percentage |
|---|---|---|---|
| A | 4927 | 127 | 2.577633% |
| B | 4927 | 27 | 0.548001% |
| C | 4927 | 6 | 0.121778% |
| D | 4926 | 1163 | 23.609419% |
Noise dominated data is calculated using 1-second bins in cleaned event files. If a bin has >2000 counts, and if more than 50% of those come from <1% of pixels, then it is considered to be noise-dominated and hence unusable.
| Quadrant | # 1 sec bins | Bins with >0 counts | Bins with >2000 counts | High rate bins dominated by noise | Noise dominated (total time) | Noise dominated (detector-on time) | Marked lightcurve |
|---|---|---|---|---|---|---|---|
| A | 7078 | 4928 | 89 | 89 | 1.26% | 1.81% | 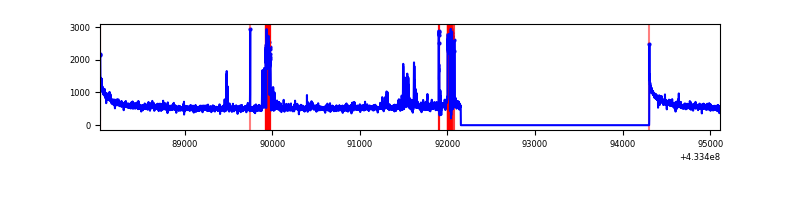 |
| B | 7078 | 4928 | 19 | 19 | 0.27% | 0.39% | 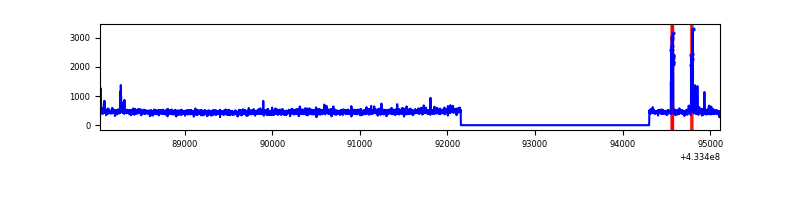 |
| C | 7078 | 4928 | 2 | 2 | 0.03% | 0.04% | 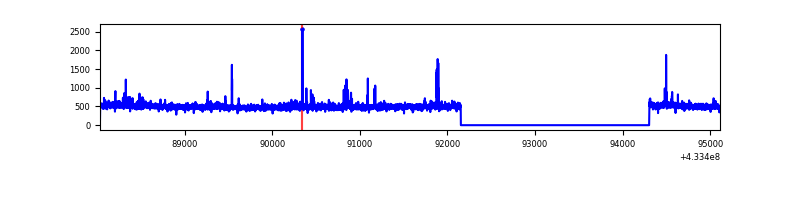 |
| D | 7077 | 4927 | 831 | 831 | 11.74% | 16.87% | 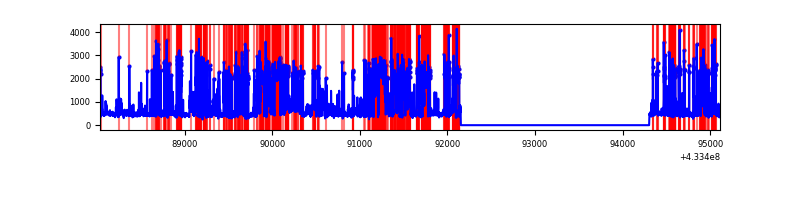 |
Top three noisy pixels from each quadrant. If the there are fewer than three noisy pixels in the level2.evt file, extra rows are filled as -1
| Pixel properties | Quadrant properties | ||||||
|---|---|---|---|---|---|---|---|
| Quadrant | DetID | PixID | Counts | Sigma | Mean | Median | Sigma |
| A | 10 | 83 | 544611 | 4765.29 | 556 | 545 | 114.2 |
| A | 15 | 237 | 349673 | 3057.89 | 556 | 545 | 114.2 |
| A | 12 | 189 | 73886 | 642.37 | 556 | 545 | 114.2 |
| B | 5 | 255 | 98949 | 914.06 | 558 | 543 | 107.7 |
| B | 0 | 189 | 30063 | 274.2 | 558 | 543 | 107.7 |
| B | 12 | 111 | 13119 | 116.81 | 558 | 543 | 107.7 |
| C | 15 | 214 | 226385 | 1733.89 | 557 | 560 | 130.2 |
| C | 7 | 220 | 32114 | 242.27 | 557 | 560 | 130.2 |
| C | 14 | 254 | 30565 | 230.38 | 557 | 560 | 130.2 |
| D | 1 | 52 | 2688467 | 23621.25 | 457 | 444 | 113.8 |
| D | 2 | 249 | 118948 | 1041.36 | 457 | 444 | 113.8 |
| D | 12 | 233 | 99410 | 869.67 | 457 | 444 | 113.8 |
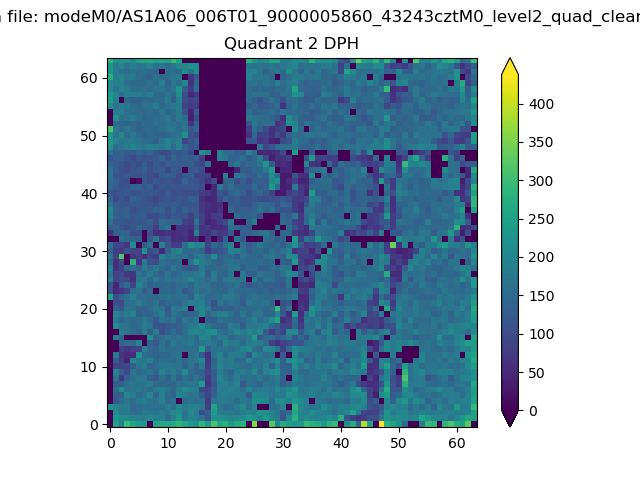
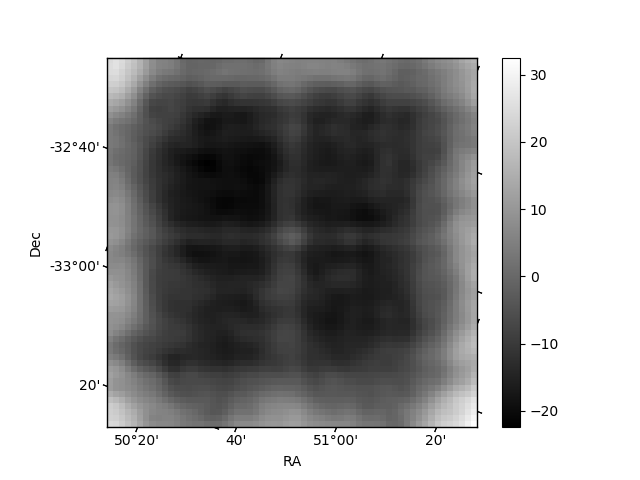
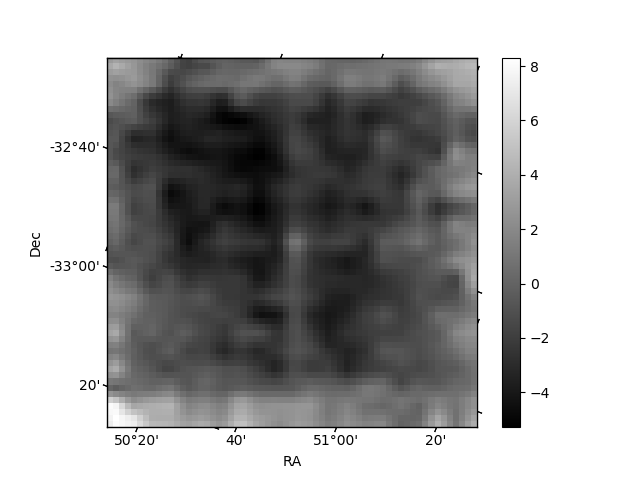
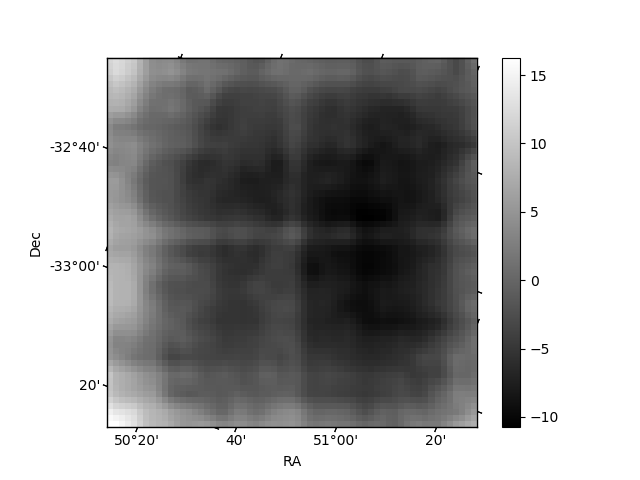
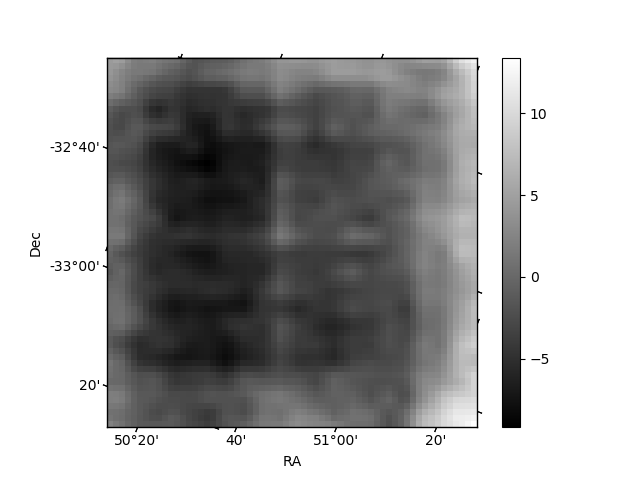
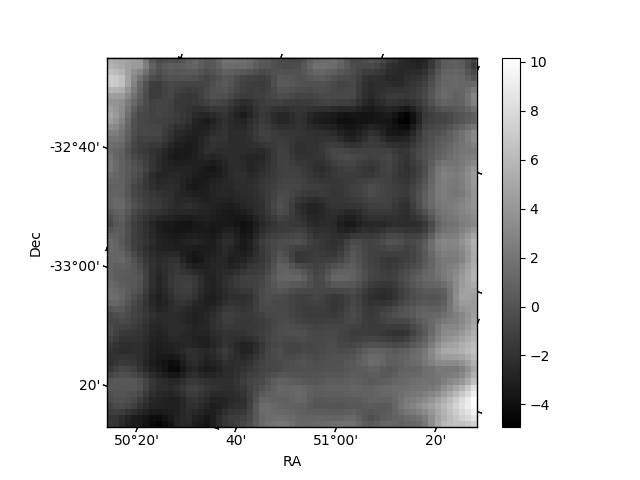
Histogram calculated using DETX and DETY for each event in the final _common_clean file
| Quadrant A | 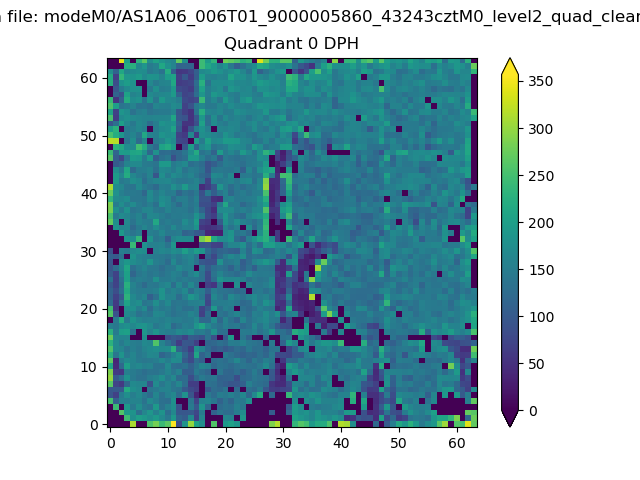 |
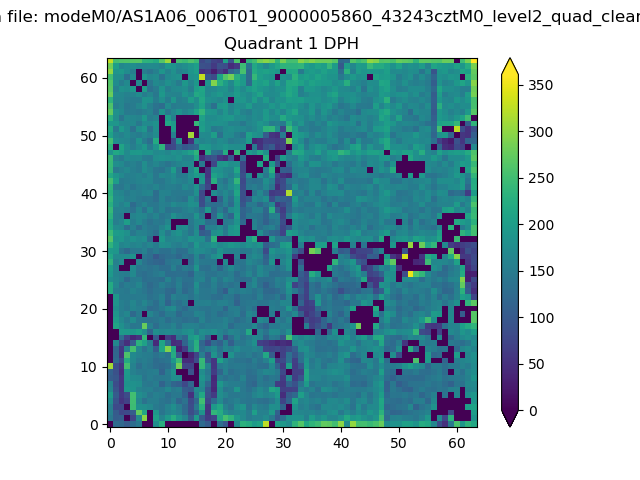 |
Quadrant B |
|---|---|---|---|
| Quadrant D | 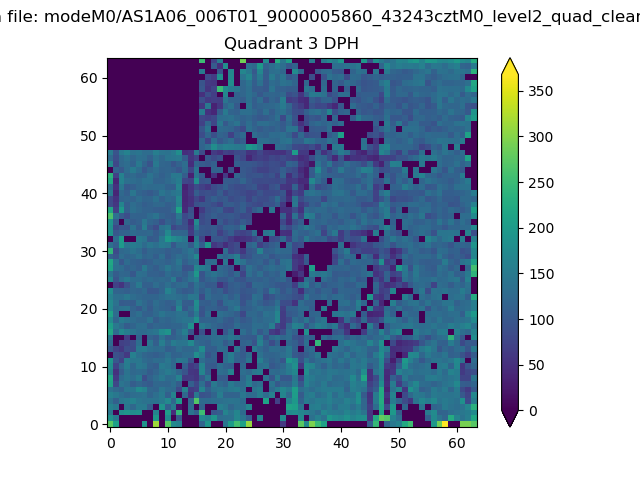 |
 |
Quadrant C |
| Plot type | Count rate plots | Images |
|---|---|---|
| Comparison with Poisson distribution Blue bars denote a histogram of data divided into 1 sec bins. Red curve is a Poisson curve with rate = median count rate of data. |
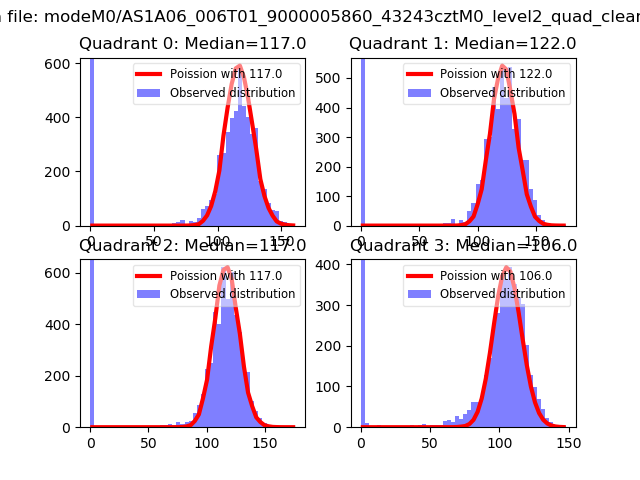 |
 |
| Quadrant-wise count rates Data is divided into 100 sec bins |
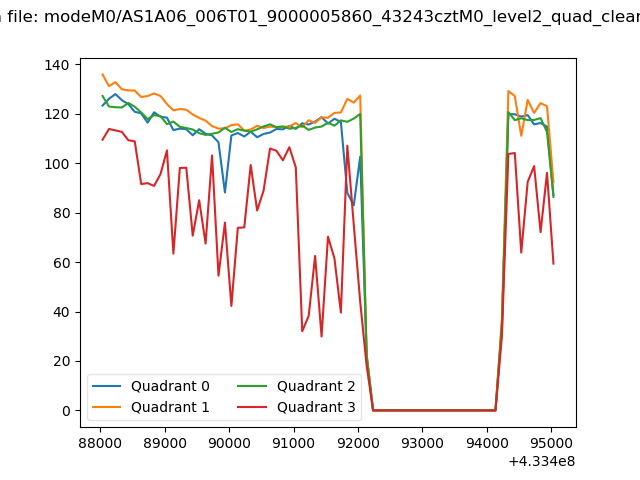 |
|
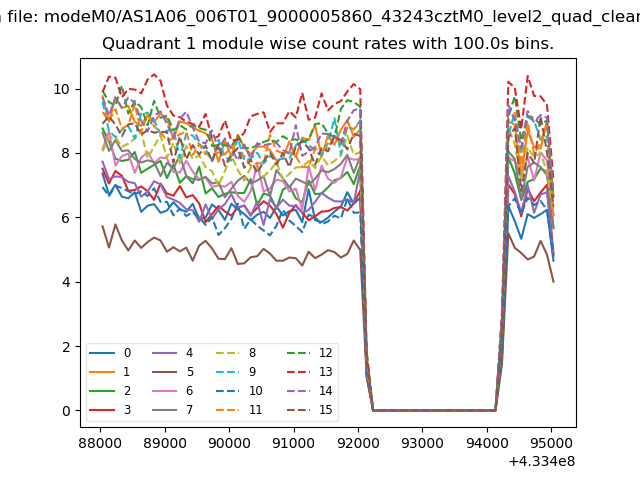
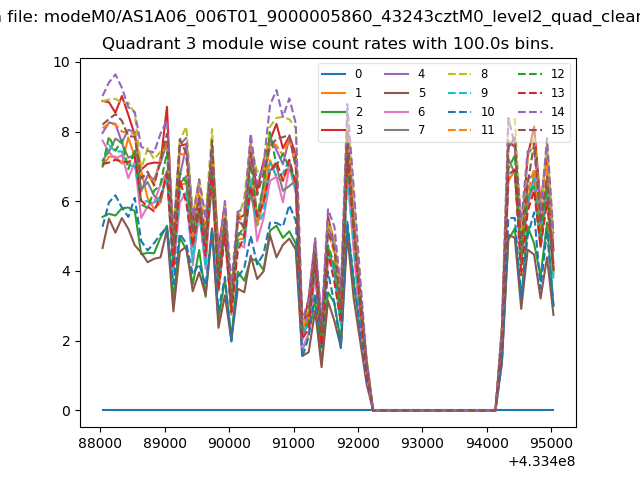
| Module-wise count rates for Quadrant A Data is divided into 100 sec bins |
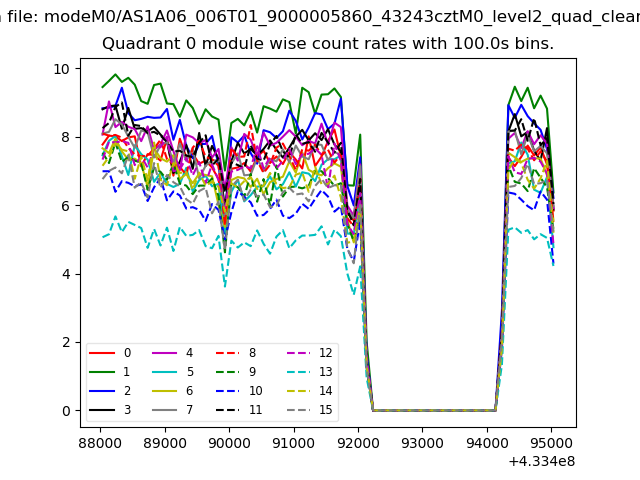 |
 |
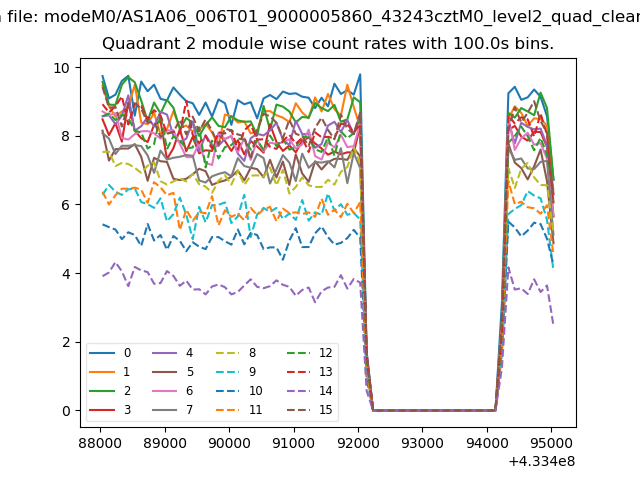
| Module-wise count rates for Quadrant B Data is divided into 100 sec bins |
 |
 |
| Module-wise count rates for Quadrant C Data is divided into 100 sec bins |
 |
 |
| Module-wise count rates for Quadrant D Data is divided into 100 sec bins |
 |
 |
| Parameter | Plot |
|---|---|
| CZT HV Monitor | 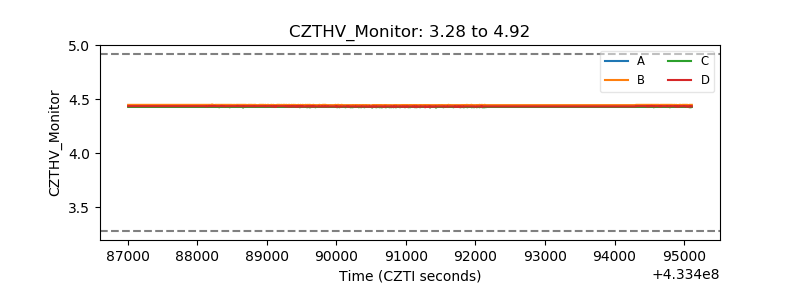 |
| D_VDD | 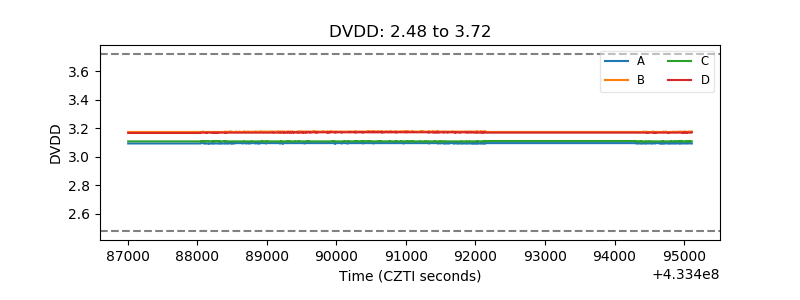 |
| Temperature 1 | 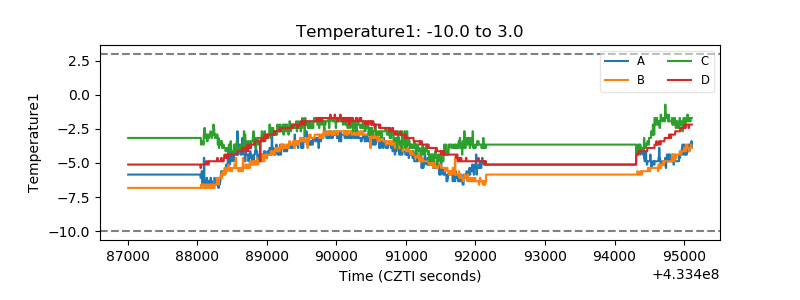 |
| Veto HV Monitor | 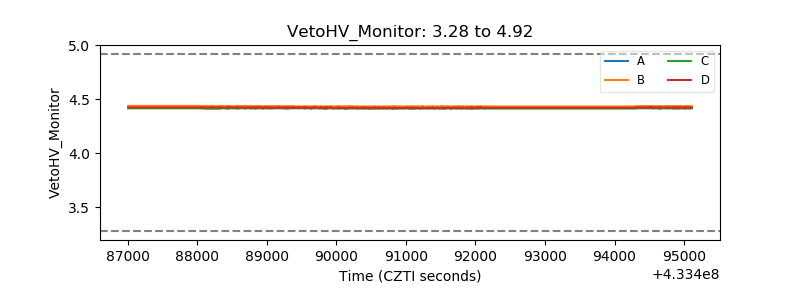 |
| Veto LLD | 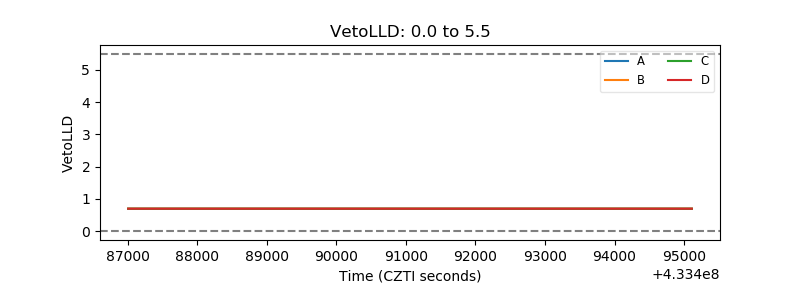 |
| Alpha Counter | 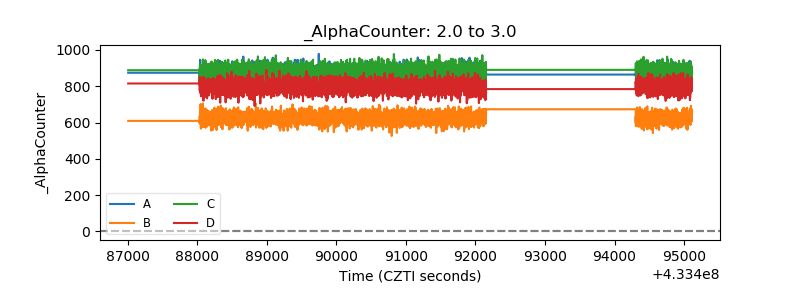 |
| _CPM_Rate | 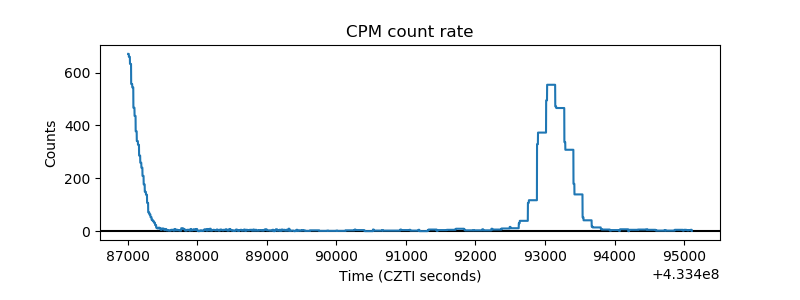 |
| CZT Counter | 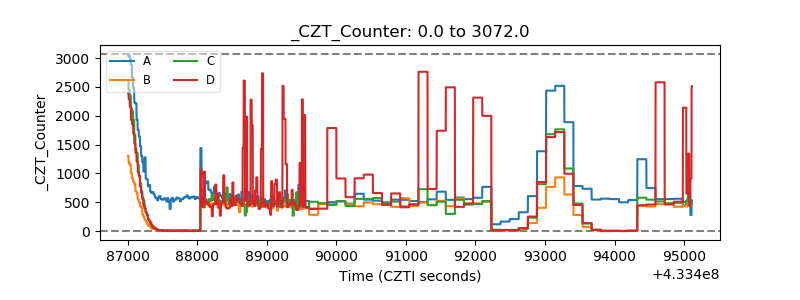 |
| +2.5 Volts monitor | 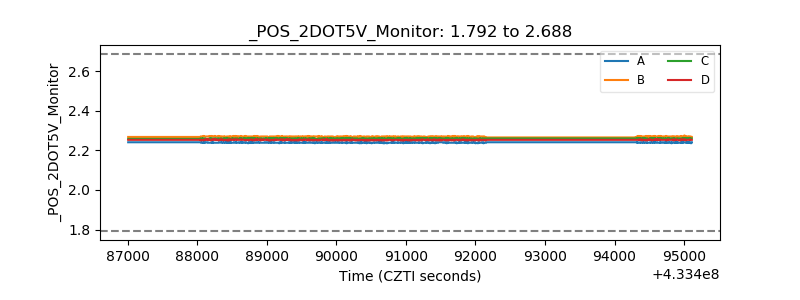 |
| +5 Volts monitor | 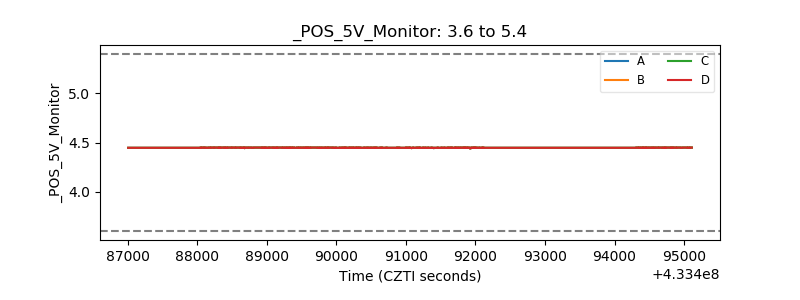 |
| _ROLL_ROT |  |
| _Roll_DEC | 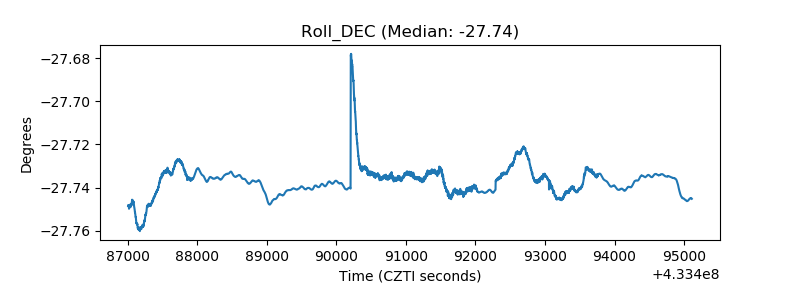 |
| _Roll_RA | 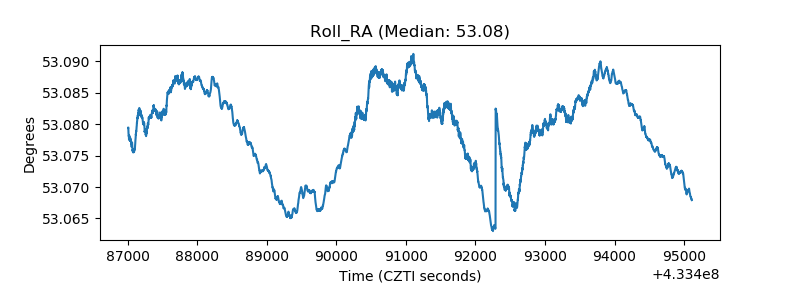 |
| Veto Counter | 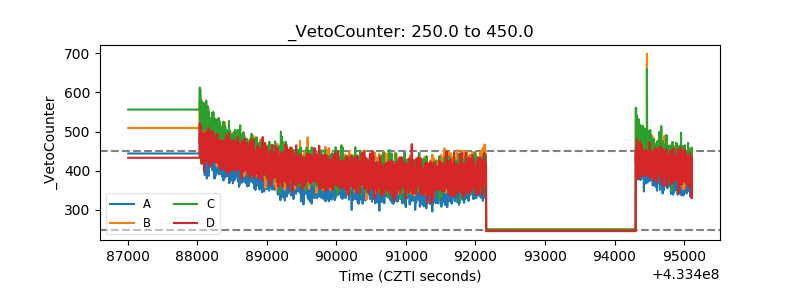 |