| Param | Original file | Final file |
|---|---|---|
| Filename | modeM0/AS1A06_006T01_9000005860_43244cztM0_level2.fits | modeM0/AS1A06_006T01_9000005860_43244cztM0_level2_quad_clean.evt |
| Size (bytes) | 315,601,920 | 83,062,080 |
| Size | 301.0 MB | 79.2 MB |
| Events in quadrant A | 2,900,645 | 555,397 |
| Events in quadrant B | 2,398,552 | 574,861 |
| Events in quadrant C | 2,410,123 | 557,579 |
| Events in quadrant D | 3,587,972 | 480,648 |
| Mode SS | |||
|---|---|---|---|
| Quadrant | BADHDUFLAG | Total packets | Discarded packets |
| A | 0 | 102 | 0 |
| B | 0 | 102 | 0 |
| C | 0 | 102 | 0 |
| D | 0 | 102 | 0 |
| Mode M9 | |||
|---|---|---|---|
| Quadrant | BADHDUFLAG | Total packets | Discarded packets |
| A | 0 | 26 | 0 |
| B | 0 | 27 | 0 |
| C | 0 | 27 | 0 |
| D | 0 | 27 | 0 |
| Mode M0 | |||
|---|---|---|---|
| Quadrant | BADHDUFLAG | Total packets | Discarded packets |
| A | 0 | 11480 | 2 |
| B | 0 | 10474 | 3 |
| C | 0 | 10047 | 2 |
| D | 0 | 13970 | 2 |
| Quadrant | Total seconds | Saturated seconds | Saturation percentage |
|---|---|---|---|
| A | 4942 | 26 | 0.526103% |
| B | 4941 | 41 | 0.829792% |
| C | 4941 | 4 | 0.080955% |
| D | 4941 | 376 | 7.609796% |
Noise dominated data is calculated using 1-second bins in cleaned event files. If a bin has >2000 counts, and if more than 50% of those come from <1% of pixels, then it is considered to be noise-dominated and hence unusable.
| Quadrant | # 1 sec bins | Bins with >0 counts | Bins with >2000 counts | High rate bins dominated by noise | Noise dominated (total time) | Noise dominated (detector-on time) | Marked lightcurve |
|---|---|---|---|---|---|---|---|
| A | 7065 | 4943 | 14 | 14 | 0.20% | 0.28% | 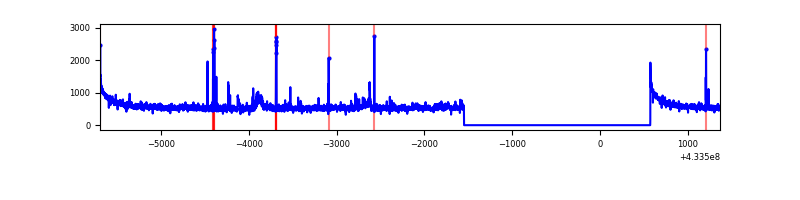 |
| B | 7064 | 4942 | 33 | 33 | 0.47% | 0.67% | 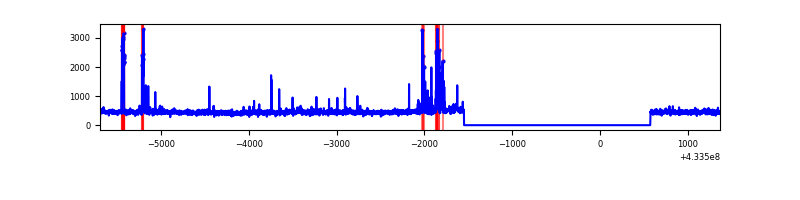 |
| C | 7064 | 4942 | 0 | 0 | 0.00% | 0.00% | 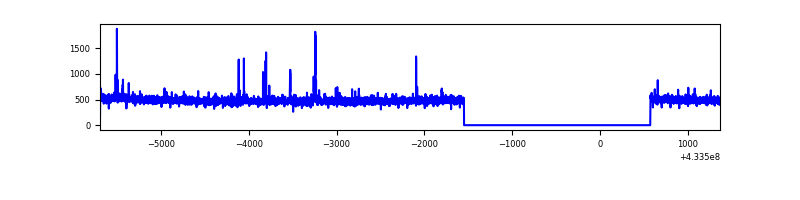 |
| D | 7064 | 4942 | 341 | 341 | 4.83% | 6.90% | 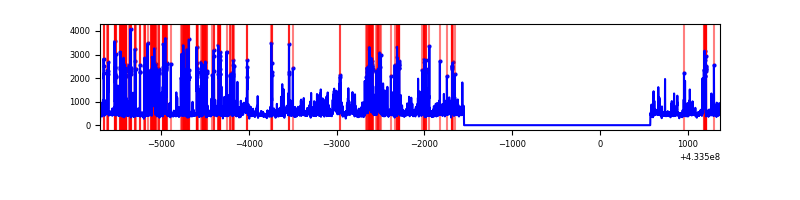 |
Top three noisy pixels from each quadrant. If the there are fewer than three noisy pixels in the level2.evt file, extra rows are filled as -1
| Pixel properties | Quadrant properties | ||||||
|---|---|---|---|---|---|---|---|
| Quadrant | DetID | PixID | Counts | Sigma | Mean | Median | Sigma |
| A | 10 | 83 | 544300 | 4728.01 | 556 | 544 | 115.0 |
| A | 15 | 237 | 102049 | 882.6 | 556 | 544 | 115.0 |
| A | 12 | 189 | 99968 | 864.5 | 556 | 544 | 115.0 |
| B | 5 | 255 | 199129 | 1846.24 | 548 | 531 | 107.6 |
| B | 0 | 189 | 38161 | 349.82 | 548 | 531 | 107.6 |
| B | 12 | 111 | 13491 | 120.48 | 548 | 531 | 107.6 |
| C | 15 | 214 | 223382 | 1742.71 | 546 | 548 | 127.9 |
| C | 14 | 254 | 29022 | 222.69 | 546 | 548 | 127.9 |
| C | 15 | 111 | 16805 | 127.14 | 546 | 548 | 127.9 |
| D | 1 | 52 | 1003695 | 7616.4 | 525 | 510 | 131.7 |
| D | 12 | 233 | 231222 | 1751.61 | 525 | 510 | 131.7 |
| D | 13 | 249 | 92534 | 698.67 | 525 | 510 | 131.7 |
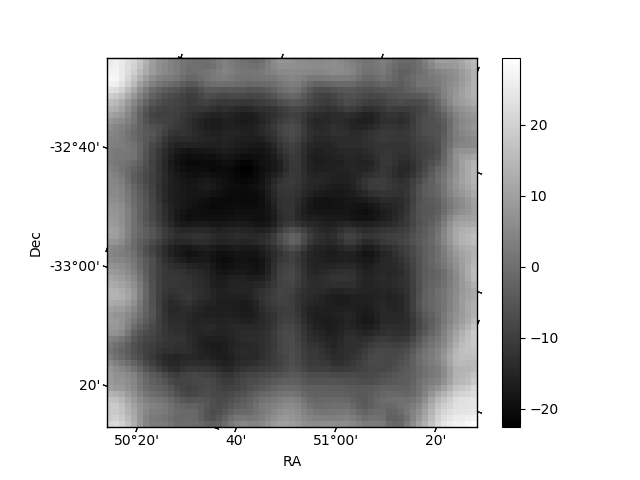
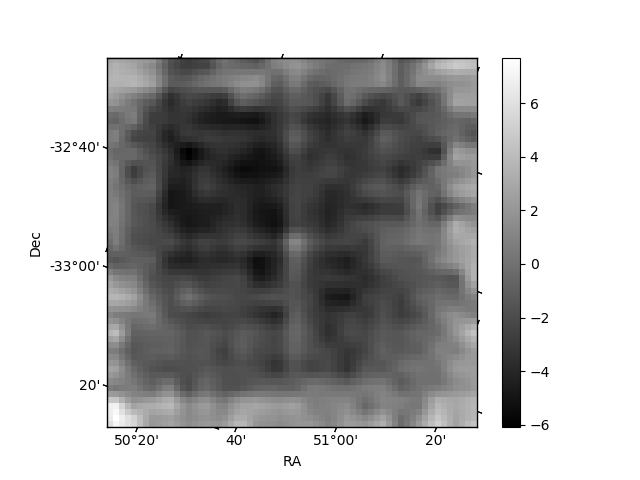
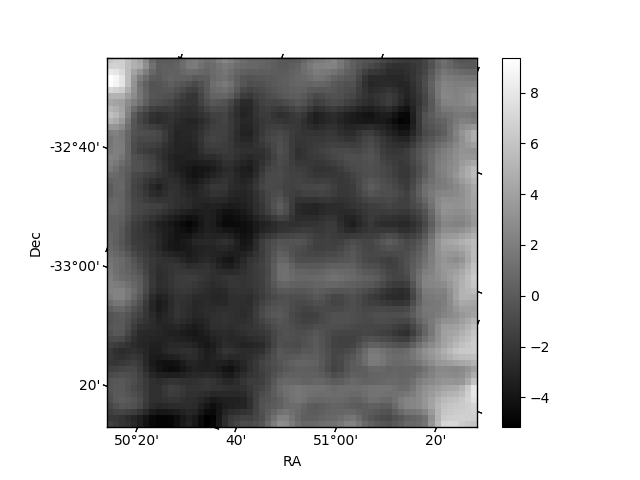
Histogram calculated using DETX and DETY for each event in the final _common_clean file
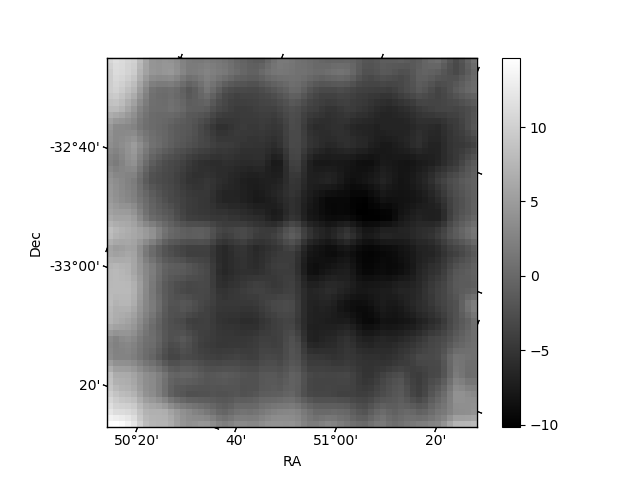
| Quadrant A | 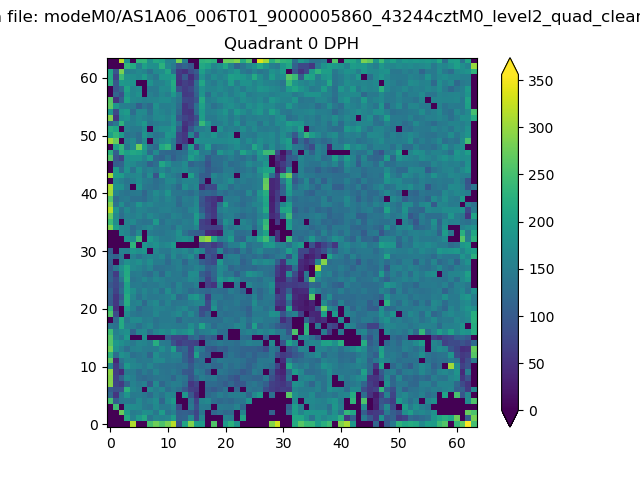 |
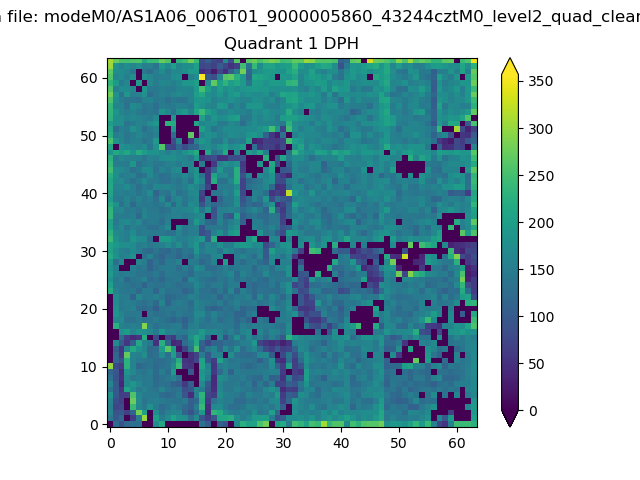 |
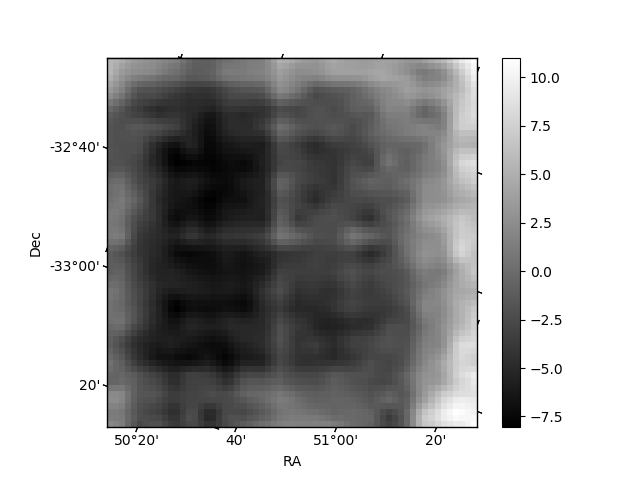
Quadrant B |
|---|---|---|---|
| Quadrant D | 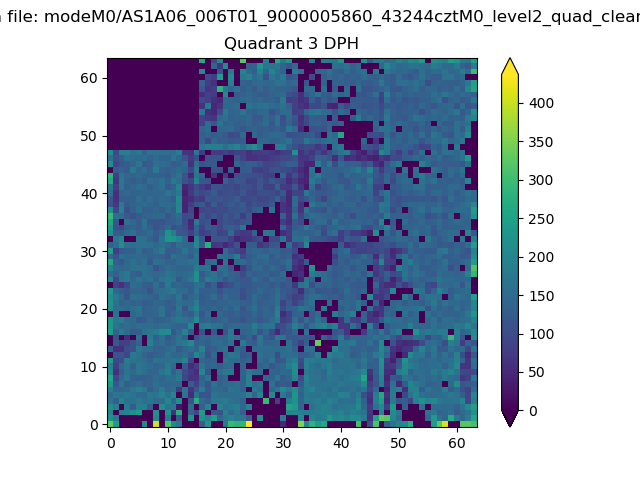 |
 |
Quadrant C |
| Plot type | Count rate plots | Images |
|---|---|---|
| Comparison with Poisson distribution Blue bars denote a histogram of data divided into 1 sec bins. Red curve is a Poisson curve with rate = median count rate of data. |
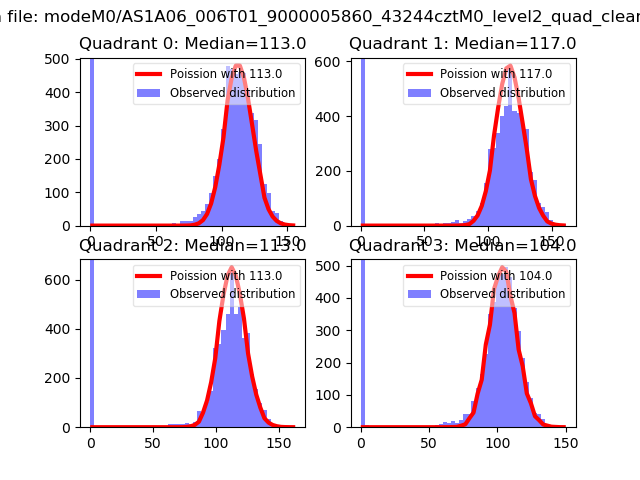 |
 |
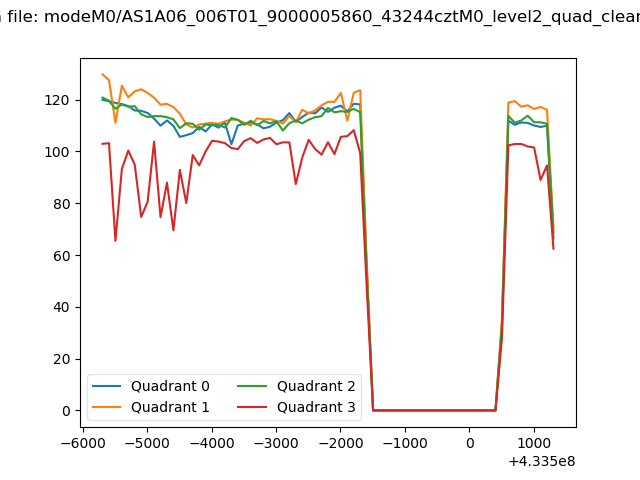
| Quadrant-wise count rates Data is divided into 100 sec bins |
 |
|
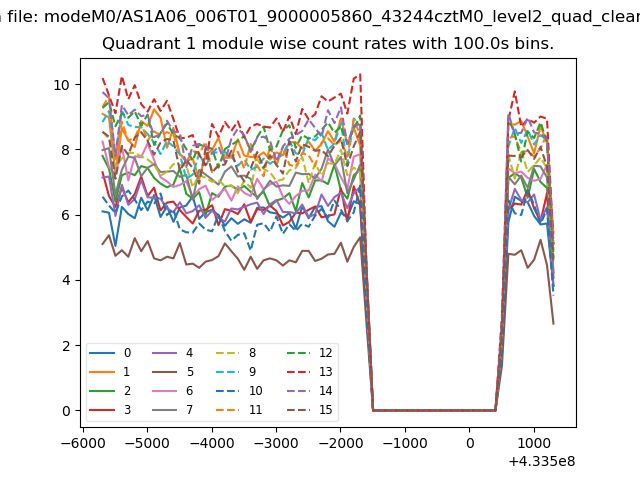
| Module-wise count rates for Quadrant A Data is divided into 100 sec bins |
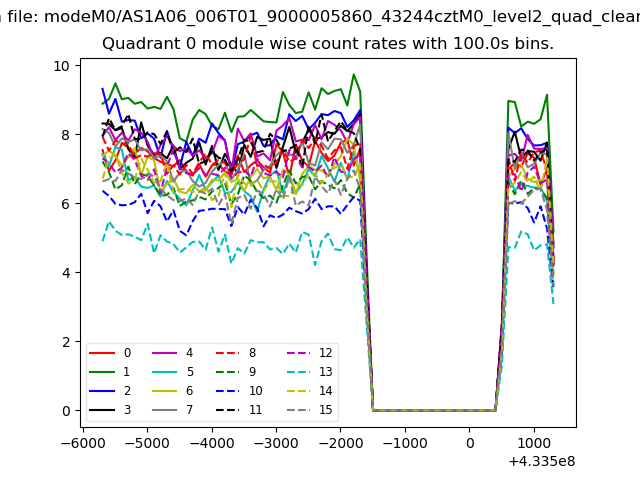 |
 |
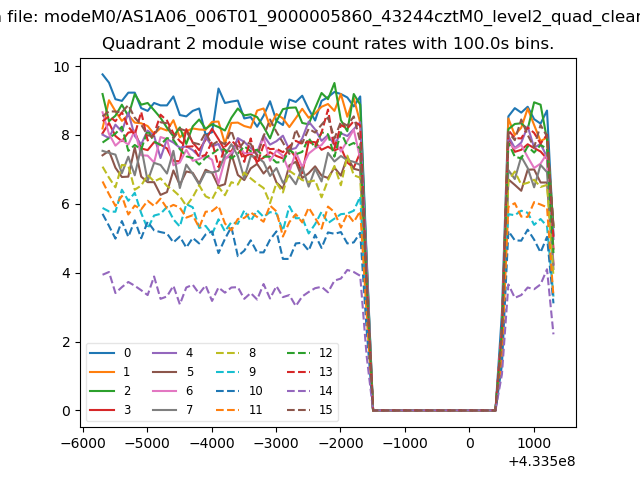
| Module-wise count rates for Quadrant B Data is divided into 100 sec bins |
 |
 |
| Module-wise count rates for Quadrant C Data is divided into 100 sec bins |
 |
 |
| Module-wise count rates for Quadrant D Data is divided into 100 sec bins |
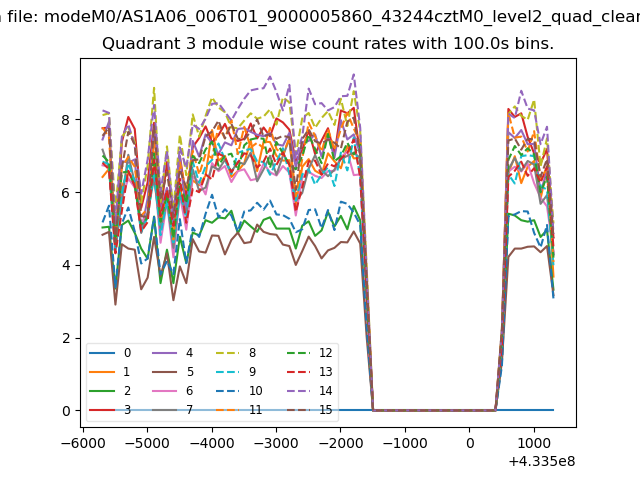 |
 |
| Parameter | Plot |
|---|---|
| CZT HV Monitor | 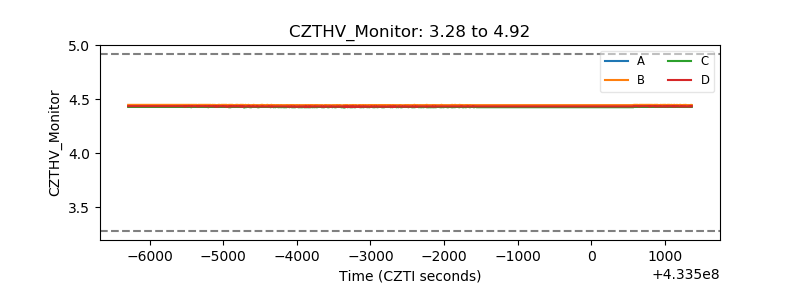 |
| D_VDD | 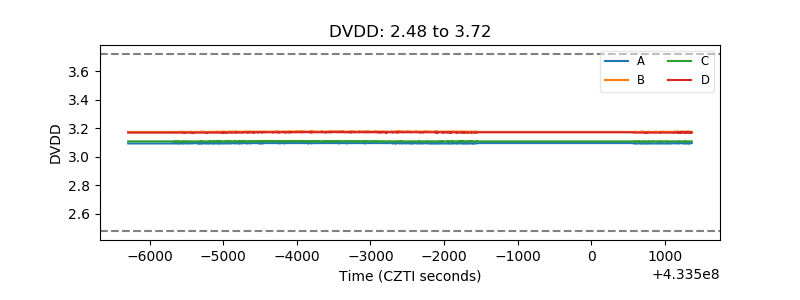 |
| Temperature 1 | 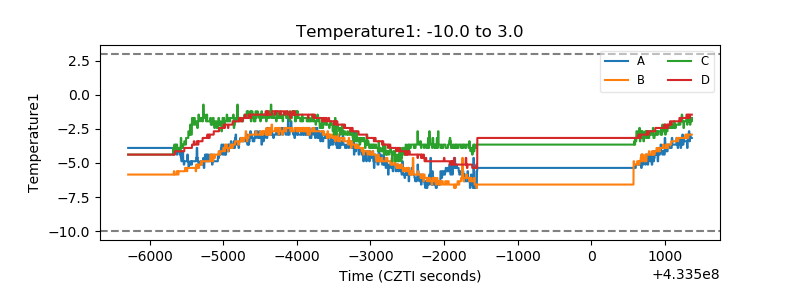 |
| Veto HV Monitor | 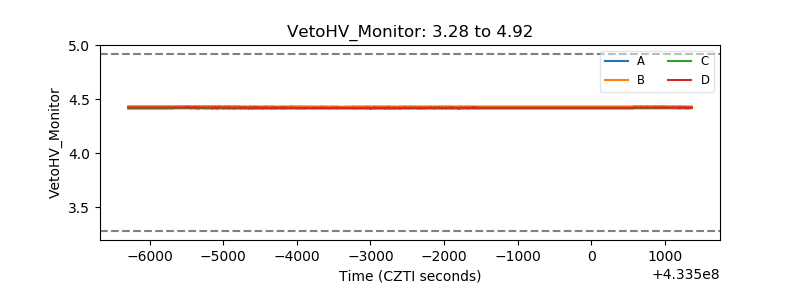 |
| Veto LLD | 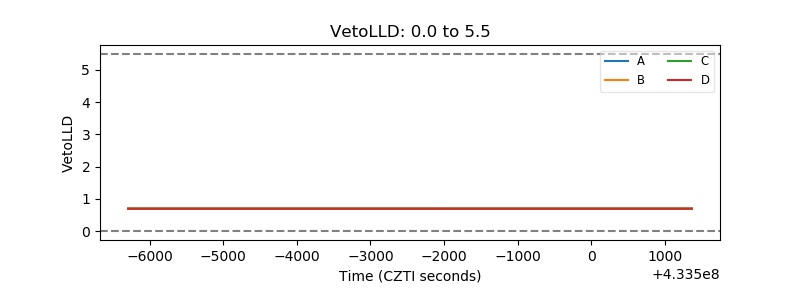 |
| Alpha Counter | 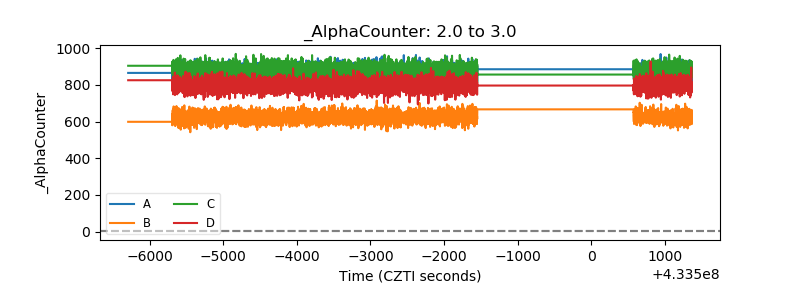 |
| _CPM_Rate | 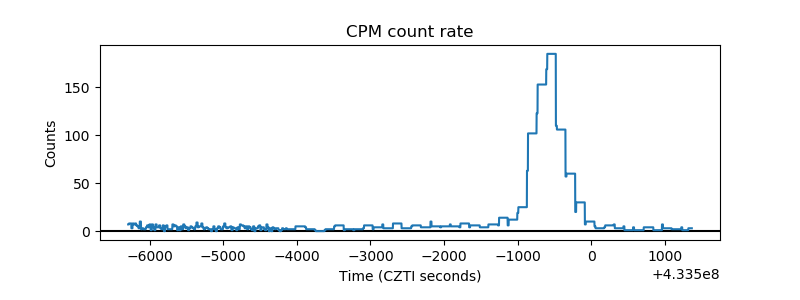 |
| CZT Counter | 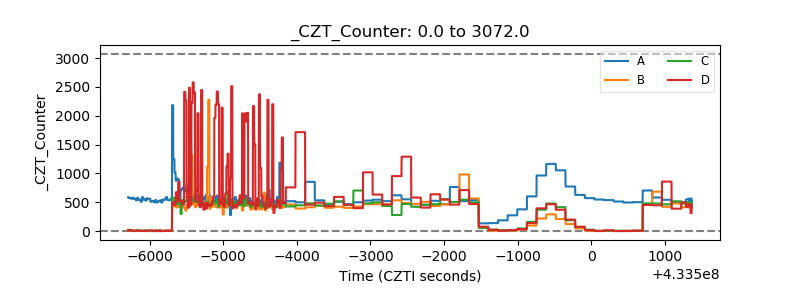 |
| +2.5 Volts monitor | 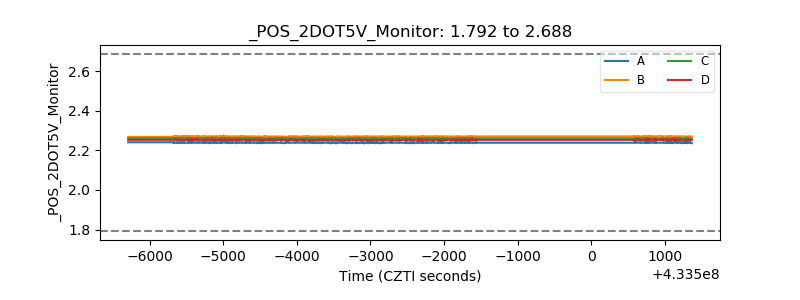 |
| +5 Volts monitor | 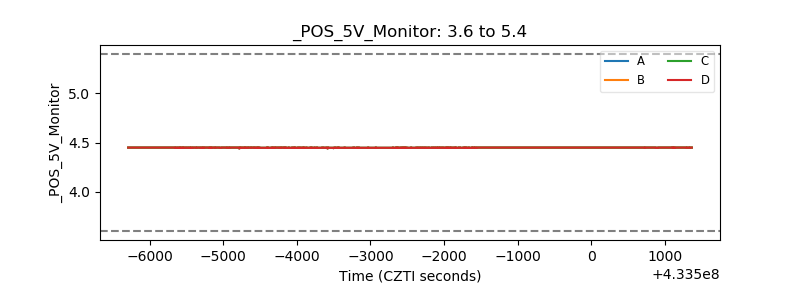 |
| _ROLL_ROT | 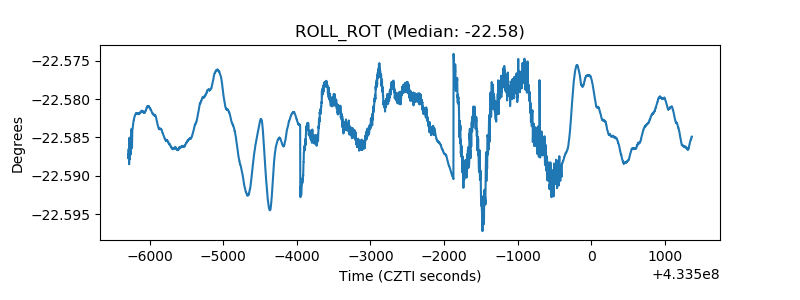 |
| _Roll_DEC | 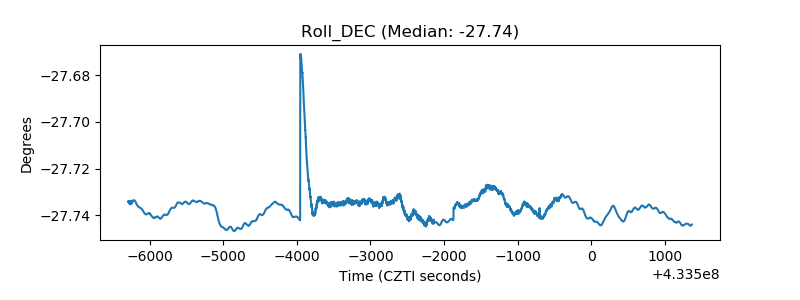 |
| _Roll_RA | 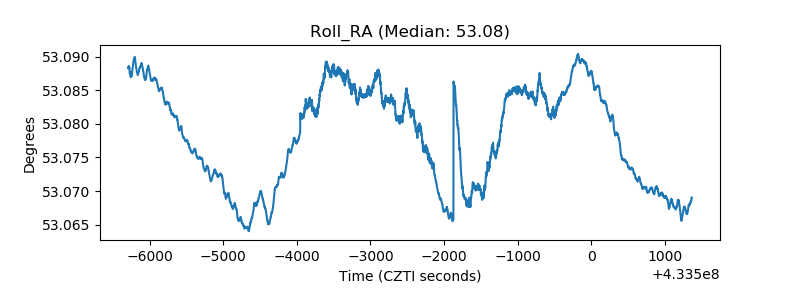 |
| Veto Counter | 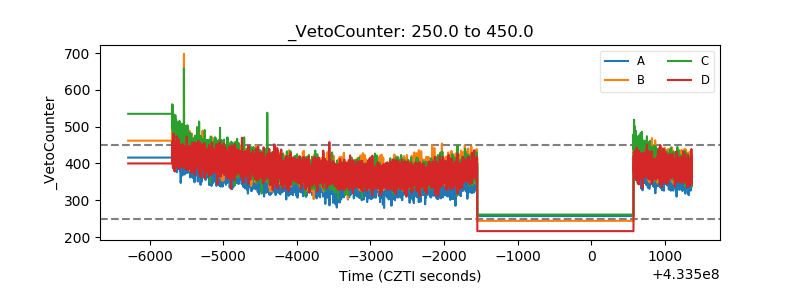 |