| Param | Original file | Final file |
|---|---|---|
| Filename | modeM0/AS1A06_006T01_9000005860_43246cztM0_level2.fits | modeM0/AS1A06_006T01_9000005860_43246cztM0_level2_quad_clean.evt |
| Size (bytes) | 355,020,480 | 93,545,280 |
| Size | 338.6 MB | 89.2 MB |
| Events in quadrant A | 3,294,324 | 614,007 |
| Events in quadrant B | 2,933,380 | 634,356 |
| Events in quadrant C | 2,708,883 | 617,088 |
| Events in quadrant D | 3,753,331 | 561,438 |
| Mode SS | |||
|---|---|---|---|
| Quadrant | BADHDUFLAG | Total packets | Discarded packets |
| A | 0 | 118 | 0 |
| B | 0 | 118 | 0 |
| C | 0 | 118 | 0 |
| D | 0 | 118 | 0 |
| Mode M9 | |||
|---|---|---|---|
| Quadrant | BADHDUFLAG | Total packets | Discarded packets |
| A | 0 | 24 | 0 |
| B | 0 | 25 | 0 |
| C | 0 | 25 | 0 |
| D | 0 | 25 | 0 |
| Mode M0 | |||
|---|---|---|---|
| Quadrant | BADHDUFLAG | Total packets | Discarded packets |
| A | 0 | 13240 | 2 |
| B | 0 | 12778 | 2 |
| C | 0 | 11773 | 2 |
| D | 0 | 15119 | 2 |
| Quadrant | Total seconds | Saturated seconds | Saturation percentage |
|---|---|---|---|
| A | 5802 | 72 | 1.240951% |
| B | 5802 | 81 | 1.396070% |
| C | 5802 | 7 | 0.120648% |
| D | 5802 | 172 | 2.964495% |
Noise dominated data is calculated using 1-second bins in cleaned event files. If a bin has >2000 counts, and if more than 50% of those come from <1% of pixels, then it is considered to be noise-dominated and hence unusable.
| Quadrant | # 1 sec bins | Bins with >0 counts | Bins with >2000 counts | High rate bins dominated by noise | Noise dominated (total time) | Noise dominated (detector-on time) | Marked lightcurve |
|---|---|---|---|---|---|---|---|
| A | 7355 | 5803 | 46 | 46 | 0.63% | 0.79% | 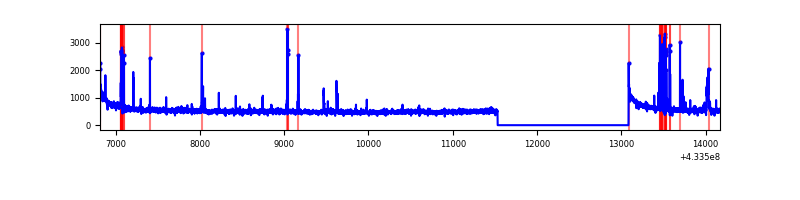 |
| B | 7355 | 5803 | 72 | 72 | 0.98% | 1.24% | 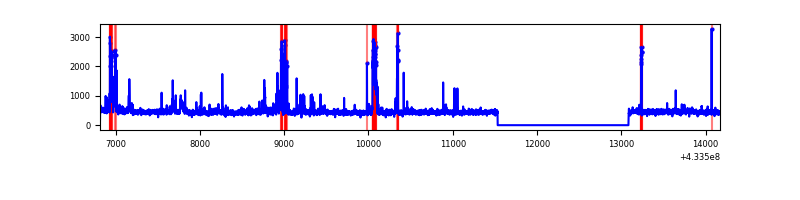 |
| C | 7355 | 5803 | 3 | 3 | 0.04% | 0.05% | 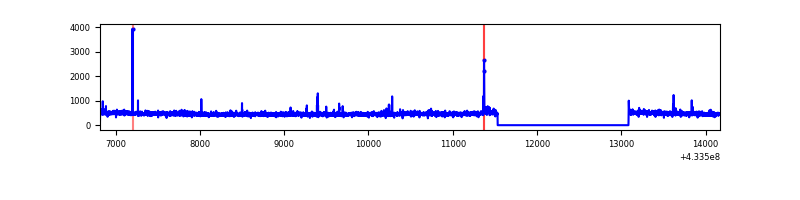 |
| D | 7355 | 5803 | 155 | 155 | 2.11% | 2.67% | 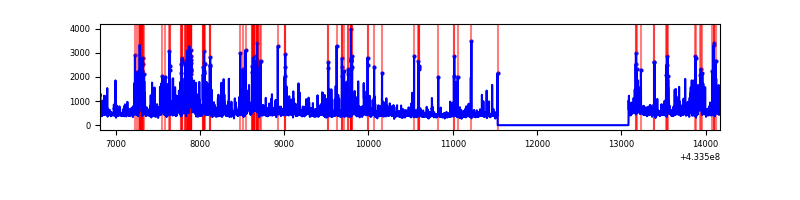 |
Top three noisy pixels from each quadrant. If the there are fewer than three noisy pixels in the level2.evt file, extra rows are filled as -1
| Pixel properties | Quadrant properties | ||||||
|---|---|---|---|---|---|---|---|
| Quadrant | DetID | PixID | Counts | Sigma | Mean | Median | Sigma |
| A | 10 | 83 | 616483 | 4747.95 | 624 | 612 | 129.7 |
| A | 15 | 237 | 217321 | 1670.68 | 624 | 612 | 129.7 |
| A | 12 | 189 | 26031 | 195.96 | 624 | 612 | 129.7 |
| B | 5 | 255 | 410165 | 3376.36 | 622 | 606 | 121.3 |
| B | 0 | 189 | 31623 | 255.7 | 622 | 606 | 121.3 |
| B | 0 | 186 | 20864 | 167.0 | 622 | 606 | 121.3 |
| C | 15 | 214 | 241680 | 1666.23 | 617 | 621 | 144.7 |
| C | 3 | 233 | 27721 | 187.32 | 617 | 621 | 144.7 |
| C | 14 | 254 | 25175 | 169.72 | 617 | 621 | 144.7 |
| D | 1 | 52 | 664393 | 4373.62 | 609 | 590 | 151.8 |
| D | 2 | 249 | 222600 | 1462.77 | 609 | 590 | 151.8 |
| D | 12 | 233 | 123418 | 809.28 | 609 | 590 | 151.8 |
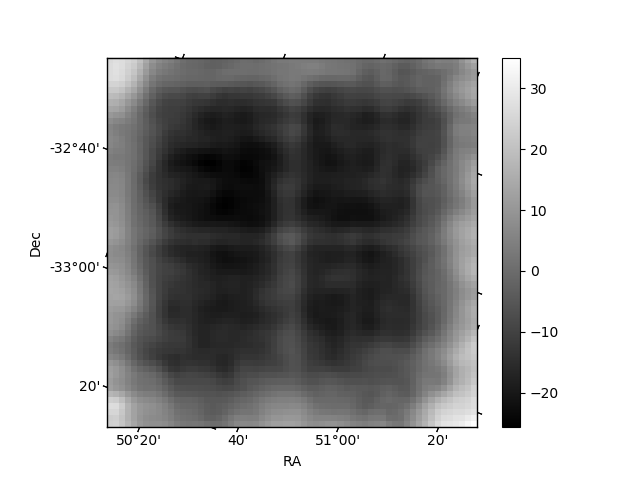
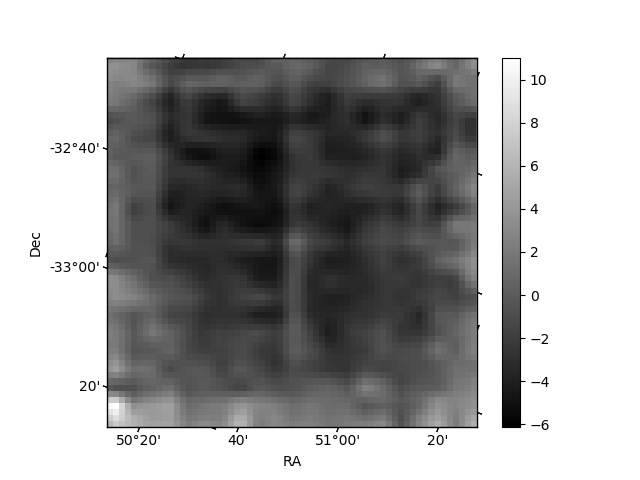
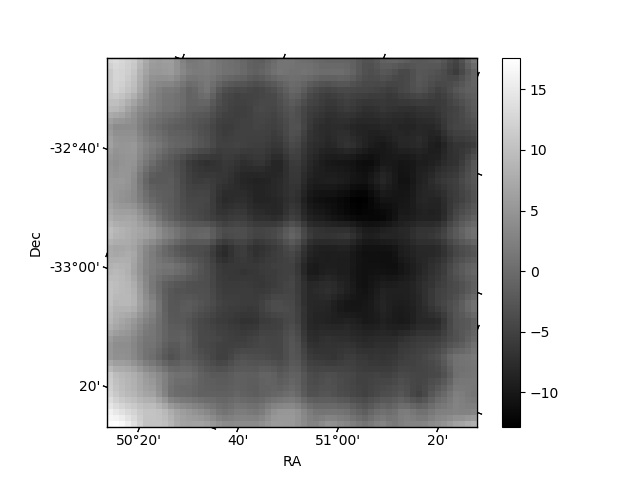
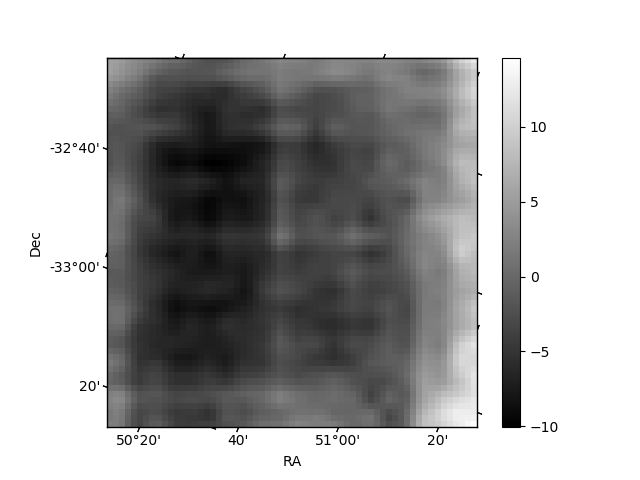
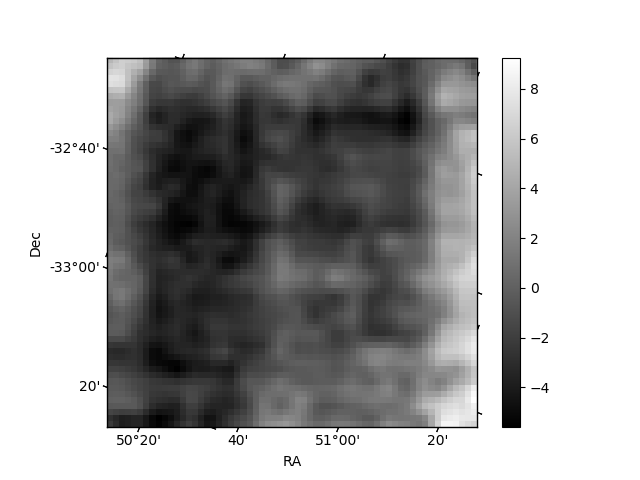
Histogram calculated using DETX and DETY for each event in the final _common_clean file
| Quadrant A | 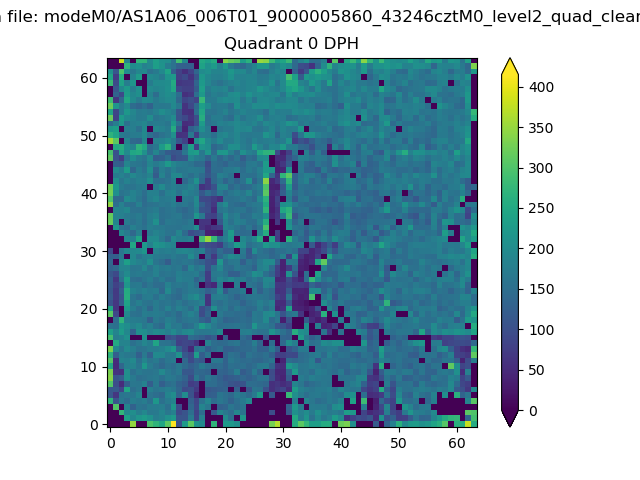 |
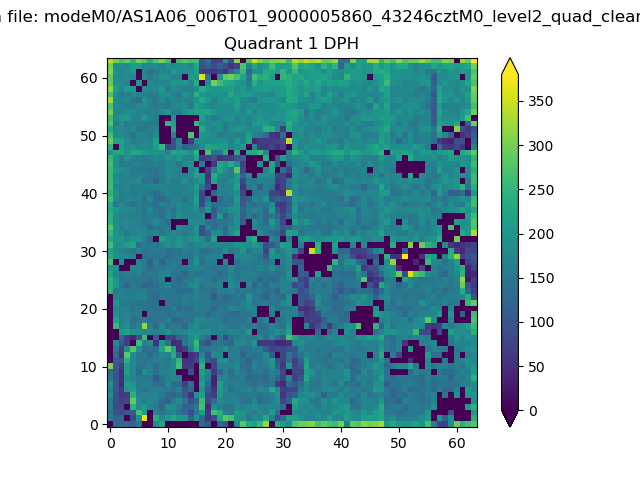 |
Quadrant B |
|---|---|---|---|
| Quadrant D | 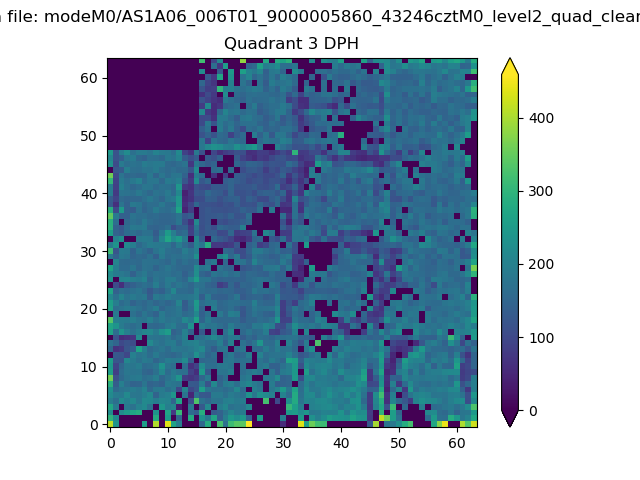 |
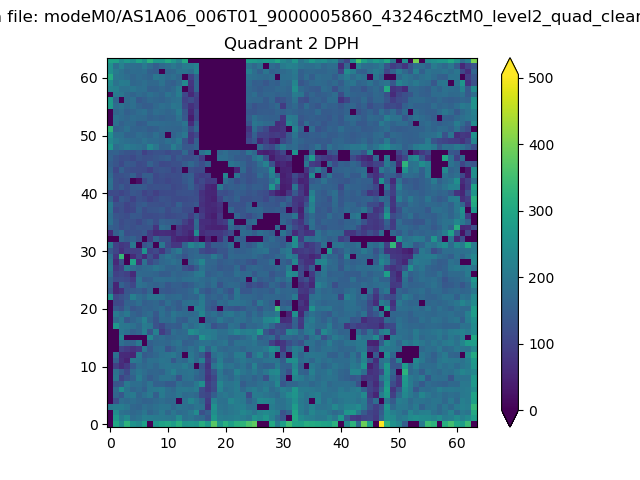 |
Quadrant C |
| Plot type | Count rate plots | Images |
|---|---|---|
| Comparison with Poisson distribution Blue bars denote a histogram of data divided into 1 sec bins. Red curve is a Poisson curve with rate = median count rate of data. |
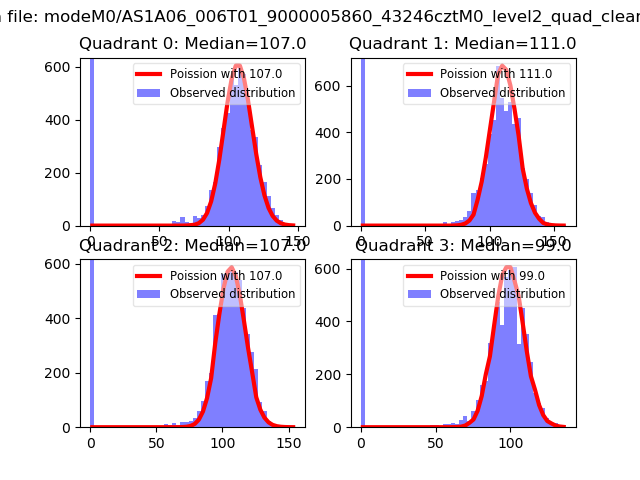 |
 |
| Quadrant-wise count rates Data is divided into 100 sec bins |
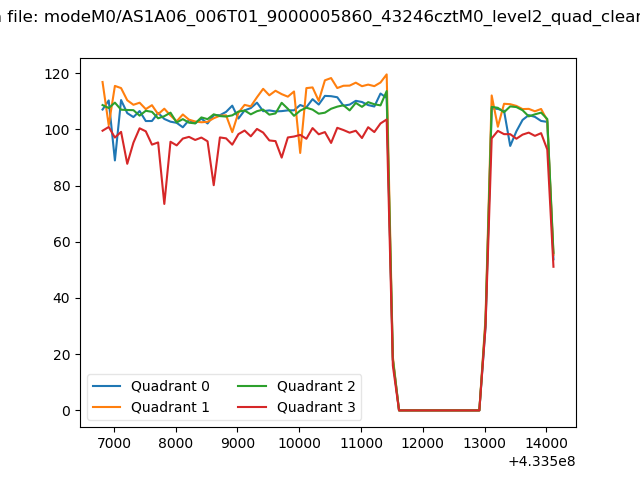 |
|
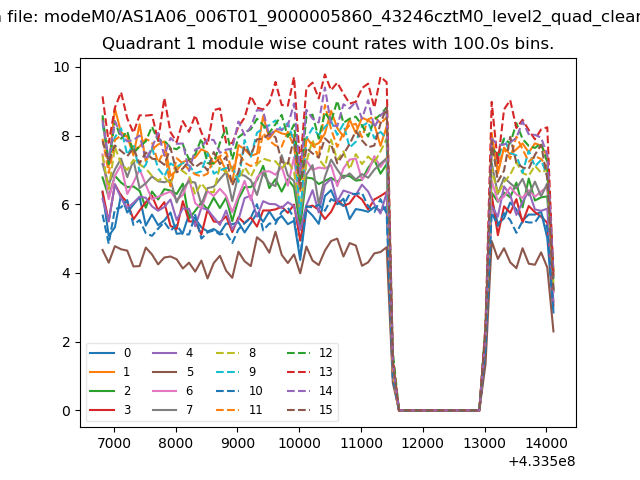
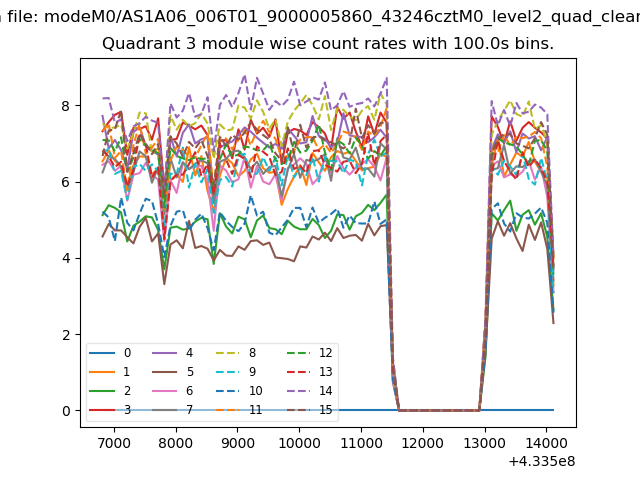
| Module-wise count rates for Quadrant A Data is divided into 100 sec bins |
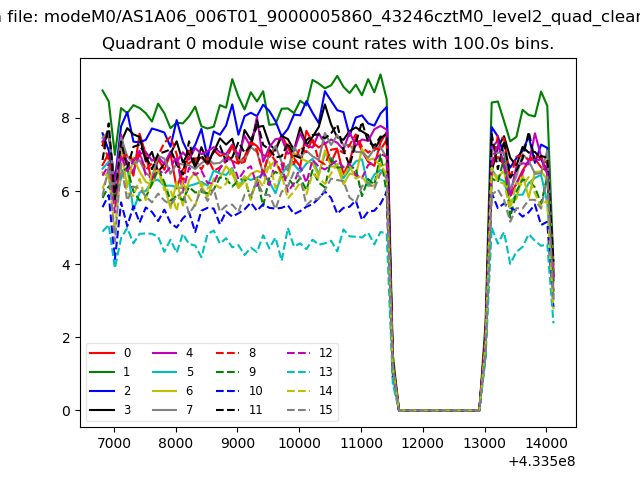 |
 |
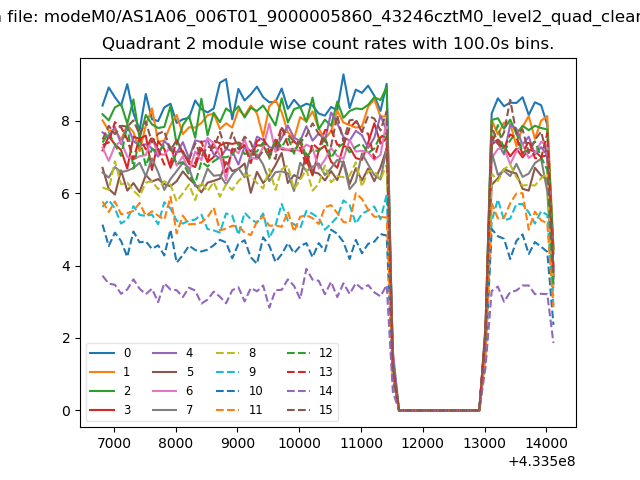
| Module-wise count rates for Quadrant B Data is divided into 100 sec bins |
 |
 |
| Module-wise count rates for Quadrant C Data is divided into 100 sec bins |
 |
 |
| Module-wise count rates for Quadrant D Data is divided into 100 sec bins |
 |
 |
| Parameter | Plot |
|---|---|
| CZT HV Monitor | 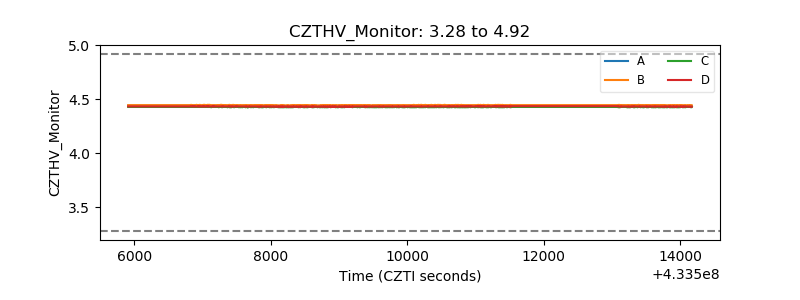 |
| D_VDD | 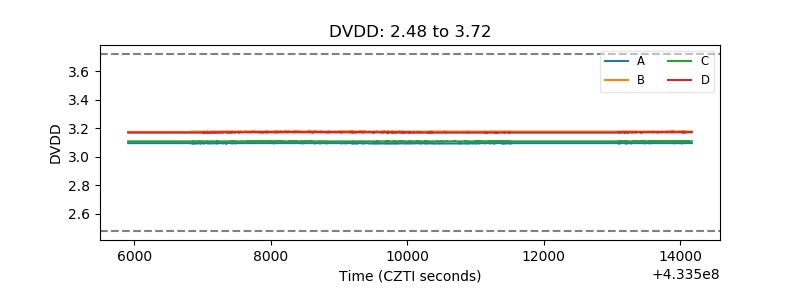 |
| Temperature 1 | 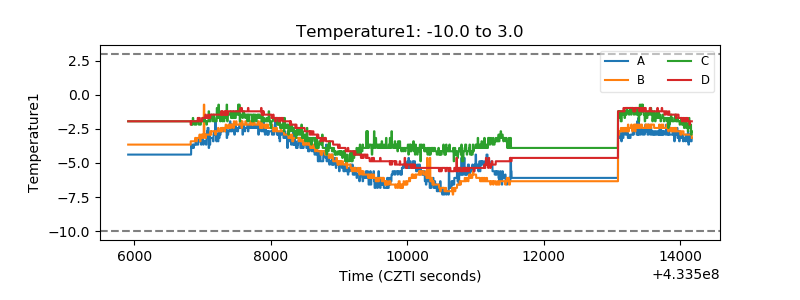 |
| Veto HV Monitor |  |
| Veto LLD | 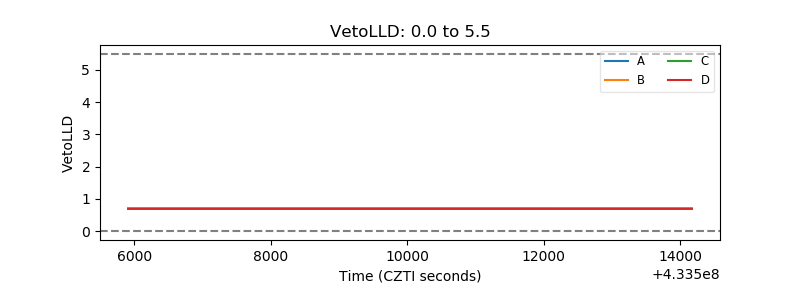 |
| Alpha Counter | 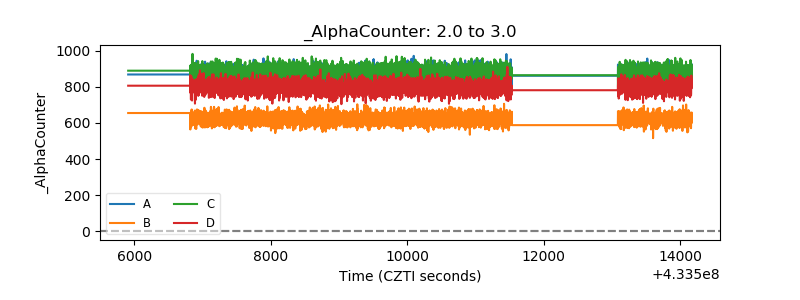 |
| _CPM_Rate | 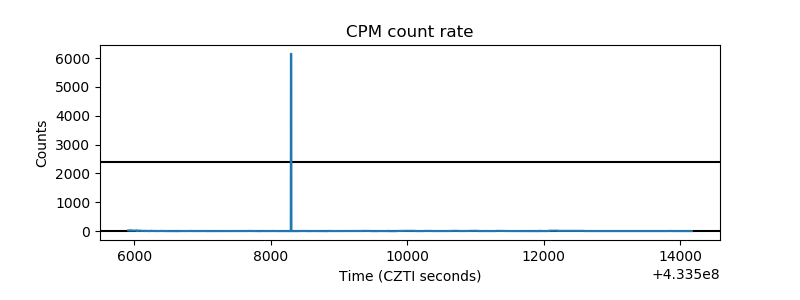 |
| CZT Counter | 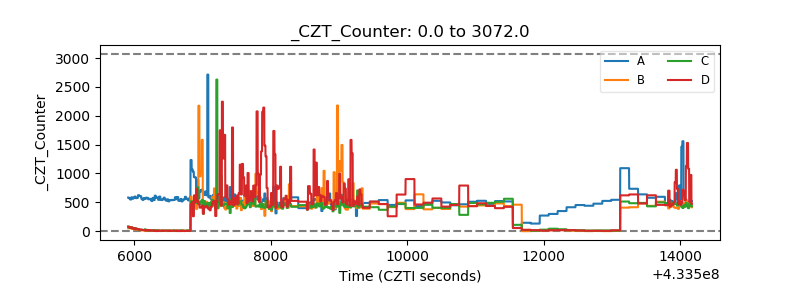 |
| +2.5 Volts monitor | 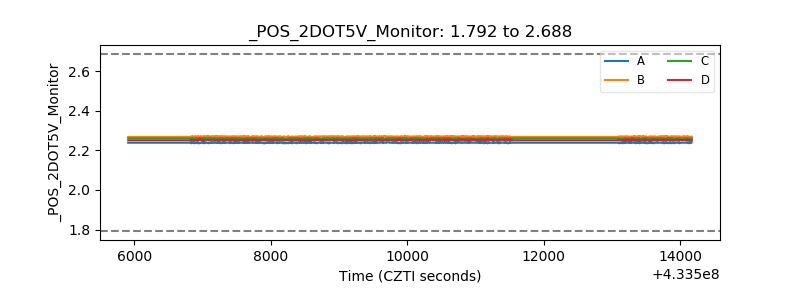 |
| +5 Volts monitor | 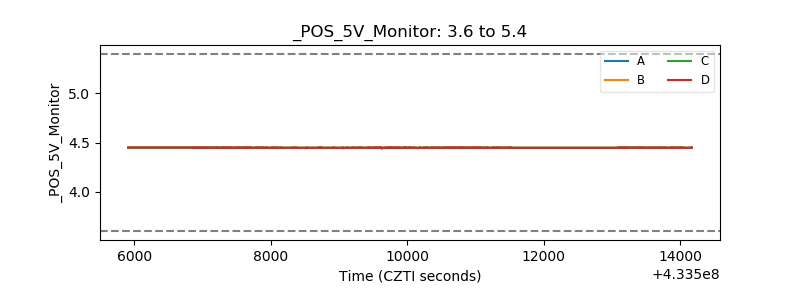 |
| _ROLL_ROT | 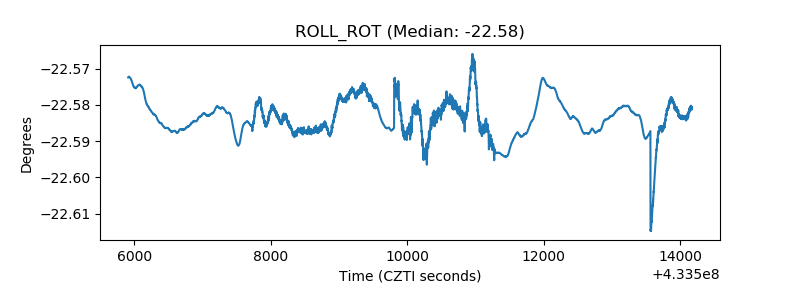 |
| _Roll_DEC | 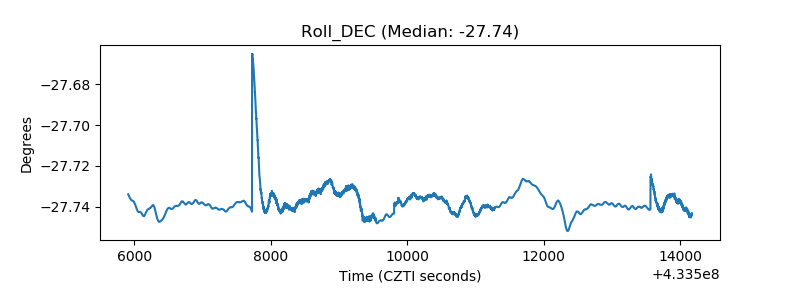 |
| _Roll_RA | 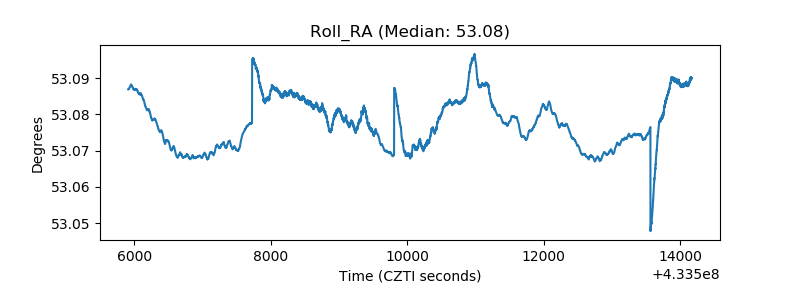 |
| Veto Counter | 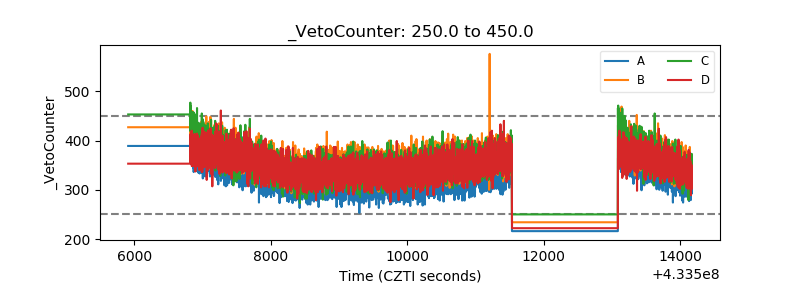 |