| Param | Original file | Final file |
|---|---|---|
| Filename | modeM0/AS1A06_006T01_9000005860_43247cztM0_level2.fits | modeM0/AS1A06_006T01_9000005860_43247cztM0_level2_quad_clean.evt |
| Size (bytes) | 375,045,120 | 95,097,600 |
| Size | 357.7 MB | 90.7 MB |
| Events in quadrant A | 3,320,462 | 629,063 |
| Events in quadrant B | 2,706,721 | 650,053 |
| Events in quadrant C | 2,925,500 | 626,735 |
| Events in quadrant D | 4,465,879 | 556,454 |
| Mode SS | |||
|---|---|---|---|
| Quadrant | BADHDUFLAG | Total packets | Discarded packets |
| A | 0 | 122 | 0 |
| B | 0 | 122 | 0 |
| C | 0 | 122 | 0 |
| D | 0 | 122 | 0 |
| Mode M9 | |||
|---|---|---|---|
| Quadrant | BADHDUFLAG | Total packets | Discarded packets |
| A | 0 | 19 | 0 |
| B | 0 | 20 | 0 |
| C | 0 | 20 | 0 |
| D | 0 | 20 | 0 |
| Mode M0 | |||
|---|---|---|---|
| Quadrant | BADHDUFLAG | Total packets | Discarded packets |
| A | 0 | 13470 | 2 |
| B | 0 | 12310 | 2 |
| C | 0 | 12592 | 2 |
| D | 0 | 17373 | 2 |
| Quadrant | Total seconds | Saturated seconds | Saturation percentage |
|---|---|---|---|
| A | 5966 | 56 | 0.938652% |
| B | 5966 | 25 | 0.419041% |
| C | 5966 | 25 | 0.419041% |
| D | 5966 | 379 | 6.352665% |
Noise dominated data is calculated using 1-second bins in cleaned event files. If a bin has >2000 counts, and if more than 50% of those come from <1% of pixels, then it is considered to be noise-dominated and hence unusable.
| Quadrant | # 1 sec bins | Bins with >0 counts | Bins with >2000 counts | High rate bins dominated by noise | Noise dominated (total time) | Noise dominated (detector-on time) | Marked lightcurve |
|---|---|---|---|---|---|---|---|
| A | 7309 | 5967 | 30 | 30 | 0.41% | 0.50% | 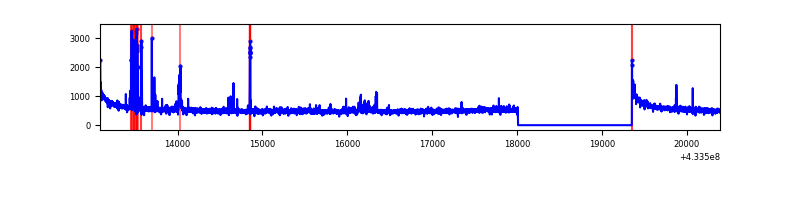 |
| B | 7309 | 5967 | 15 | 15 | 0.21% | 0.25% | 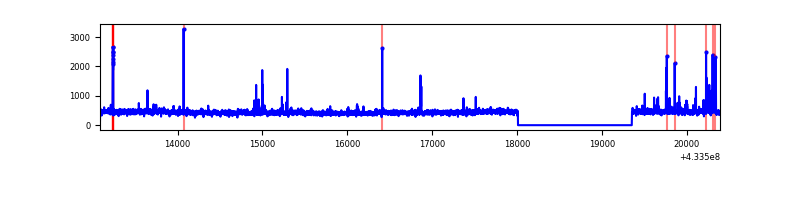 |
| C | 7309 | 5967 | 13 | 13 | 0.18% | 0.22% | 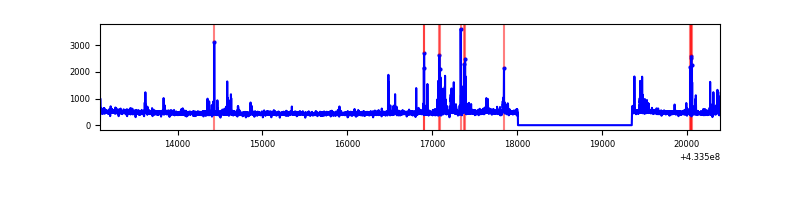 |
| D | 7309 | 5966 | 353 | 353 | 4.83% | 5.92% |  |
Top three noisy pixels from each quadrant. If the there are fewer than three noisy pixels in the level2.evt file, extra rows are filled as -1
| Pixel properties | Quadrant properties | ||||||
|---|---|---|---|---|---|---|---|
| Quadrant | DetID | PixID | Counts | Sigma | Mean | Median | Sigma |
| A | 10 | 83 | 623043 | 4728.93 | 638 | 626 | 131.6 |
| A | 15 | 237 | 143333 | 1084.24 | 638 | 626 | 131.6 |
| A | 12 | 189 | 69194 | 520.96 | 638 | 626 | 131.6 |
| B | 5 | 255 | 129542 | 1031.08 | 638 | 619 | 125.0 |
| B | 0 | 189 | 35494 | 278.91 | 638 | 619 | 125.0 |
| B | 12 | 111 | 15833 | 121.67 | 638 | 619 | 125.0 |
| C | 15 | 214 | 251774 | 1696.04 | 630 | 634 | 148.1 |
| C | 14 | 254 | 202988 | 1366.57 | 630 | 634 | 148.1 |
| C | 3 | 233 | 6283 | 38.15 | 630 | 634 | 148.1 |
| D | 1 | 52 | 1318693 | 8654.52 | 612 | 593 | 152.3 |
| D | 2 | 249 | 295076 | 1933.55 | 612 | 593 | 152.3 |
| D | 12 | 6 | 193503 | 1266.63 | 612 | 593 | 152.3 |
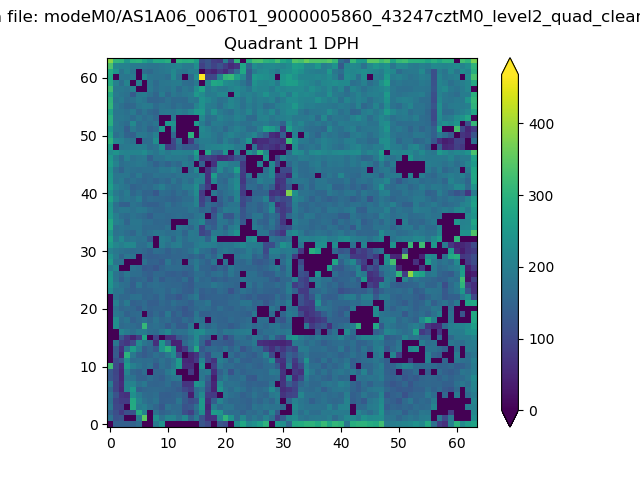
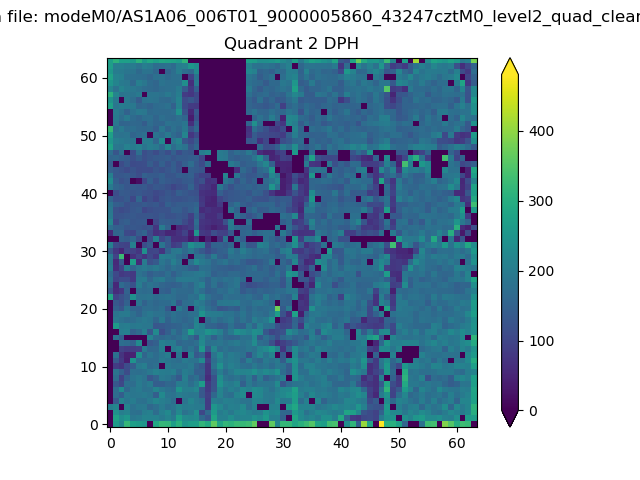
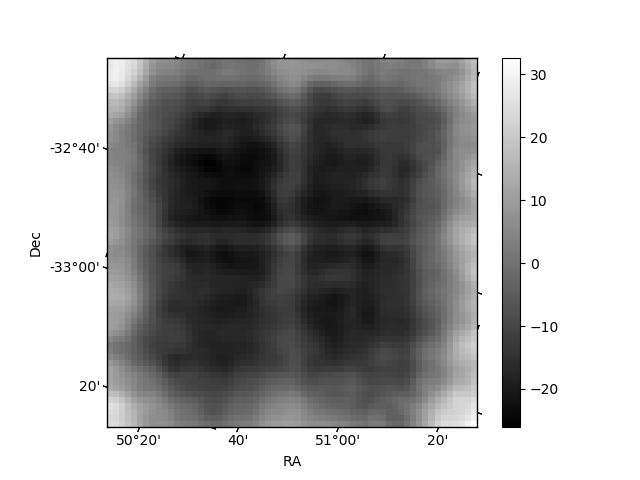
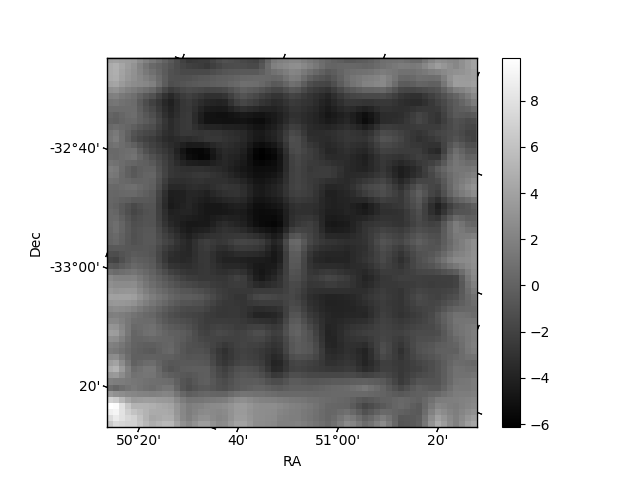
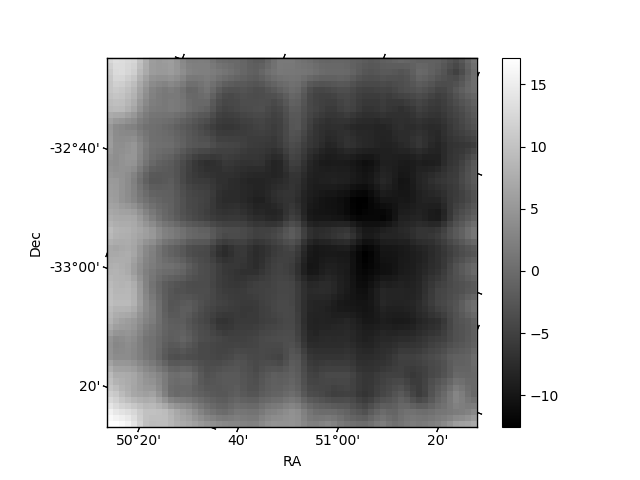
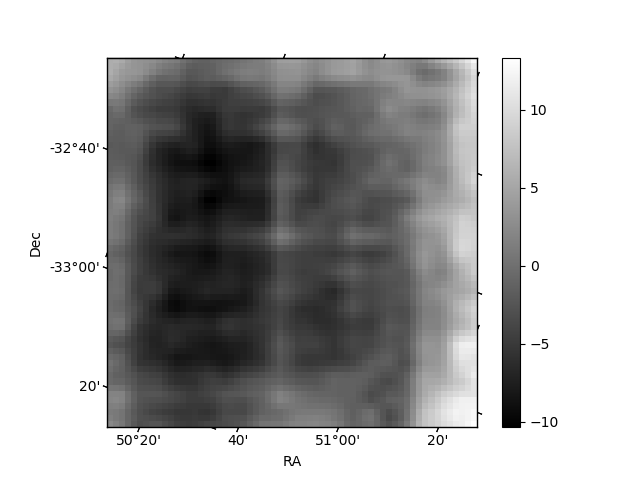
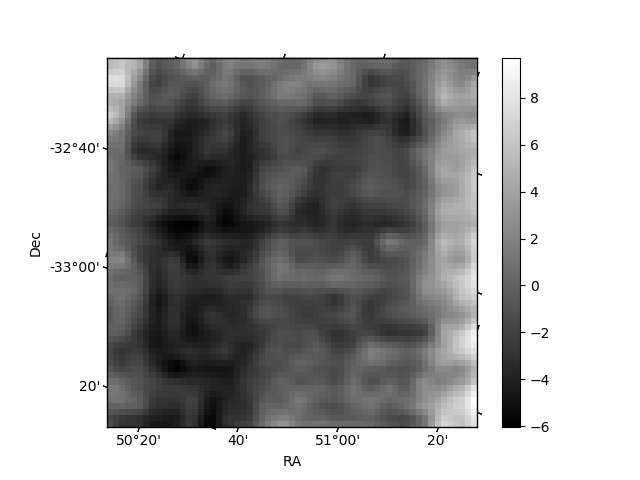
Histogram calculated using DETX and DETY for each event in the final _common_clean file
| Quadrant A | 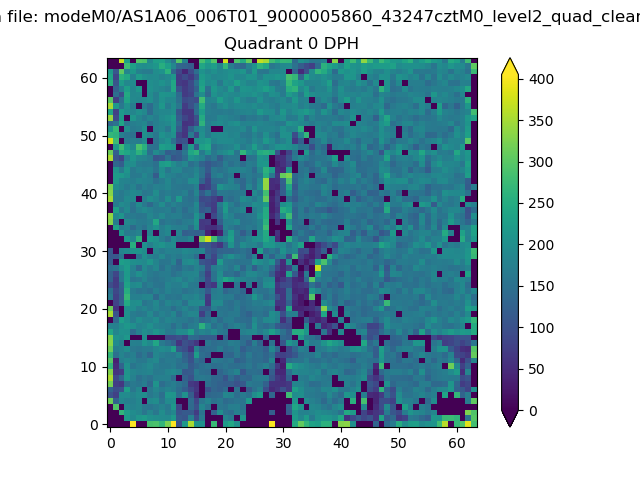 |
 |
Quadrant B |
|---|---|---|---|
| Quadrant D | 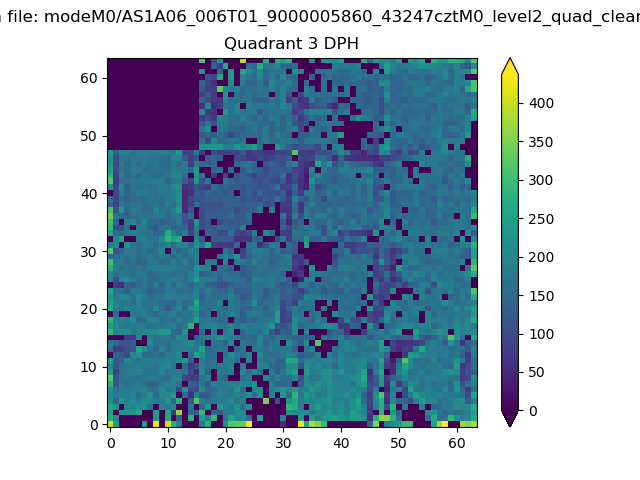 |
 |
Quadrant C |
| Plot type | Count rate plots | Images |
|---|---|---|
| Comparison with Poisson distribution Blue bars denote a histogram of data divided into 1 sec bins. Red curve is a Poisson curve with rate = median count rate of data. |
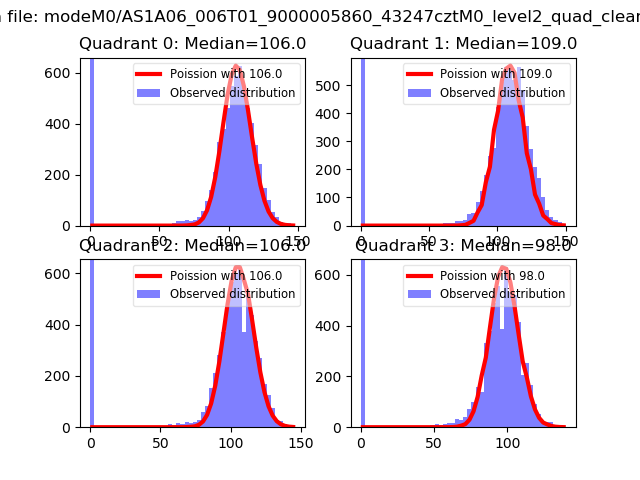 |
 |
| Quadrant-wise count rates Data is divided into 100 sec bins |
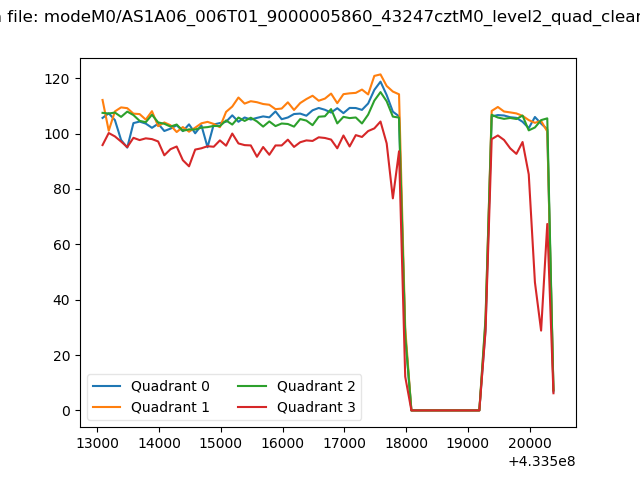 |
|
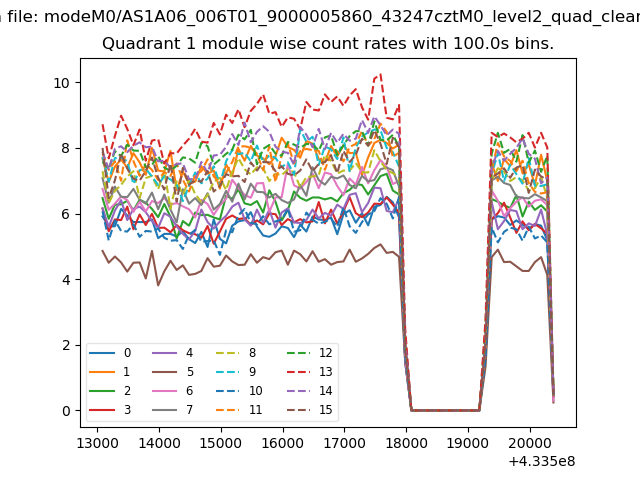
| Module-wise count rates for Quadrant A Data is divided into 100 sec bins |
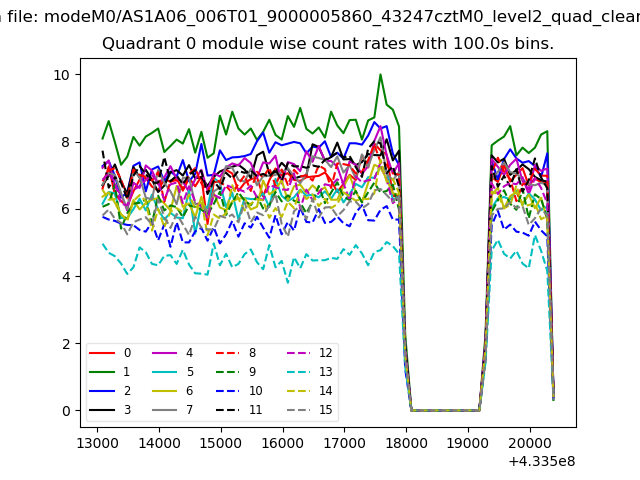 |
 |
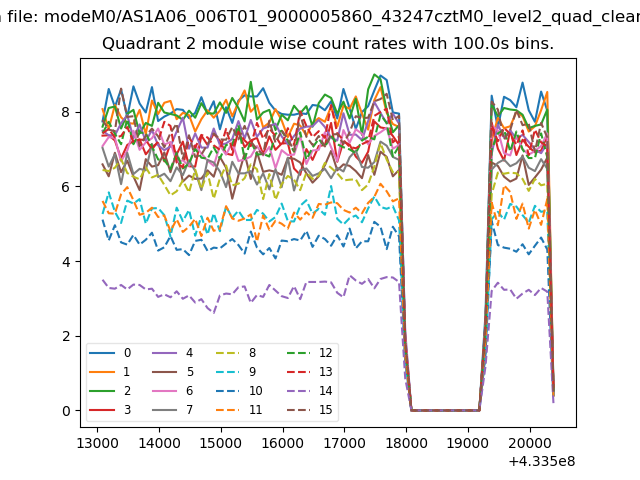
| Module-wise count rates for Quadrant B Data is divided into 100 sec bins |
 |
 |
| Module-wise count rates for Quadrant C Data is divided into 100 sec bins |
 |
 |
| Module-wise count rates for Quadrant D Data is divided into 100 sec bins |
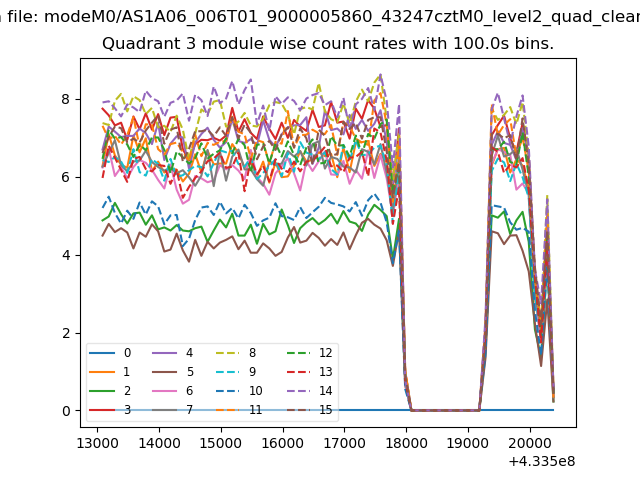 |
 |
| Parameter | Plot |
|---|---|
| CZT HV Monitor | 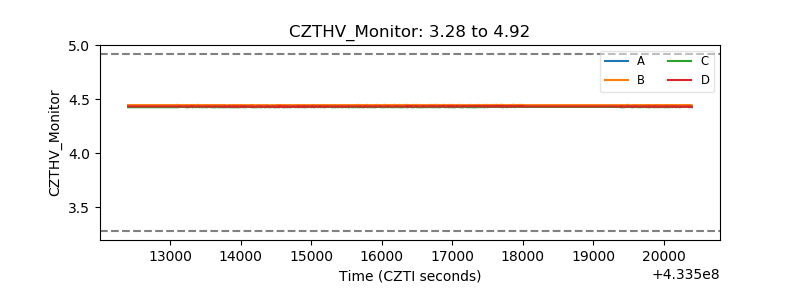 |
| D_VDD | 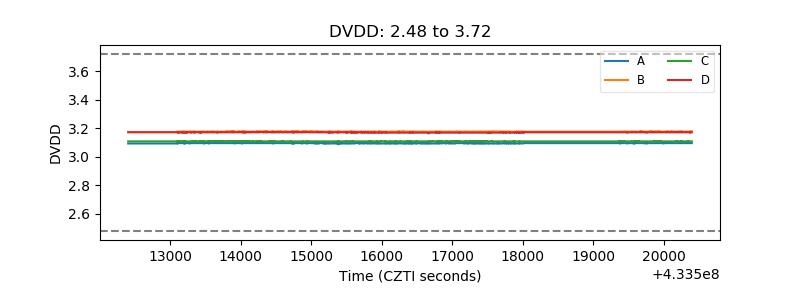 |
| Temperature 1 | 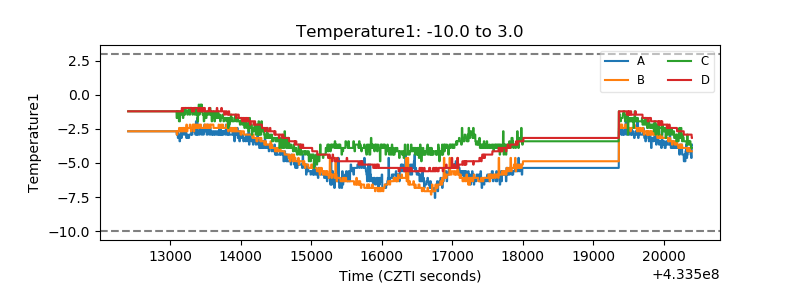 |
| Veto HV Monitor |  |
| Veto LLD | 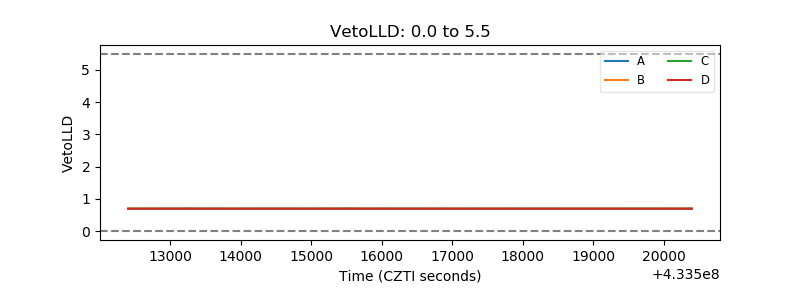 |
| Alpha Counter | 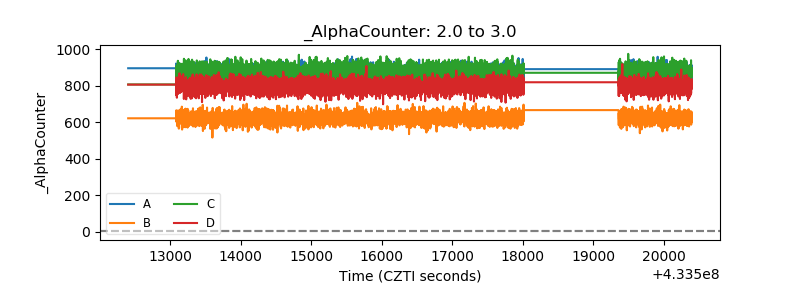 |
| _CPM_Rate | 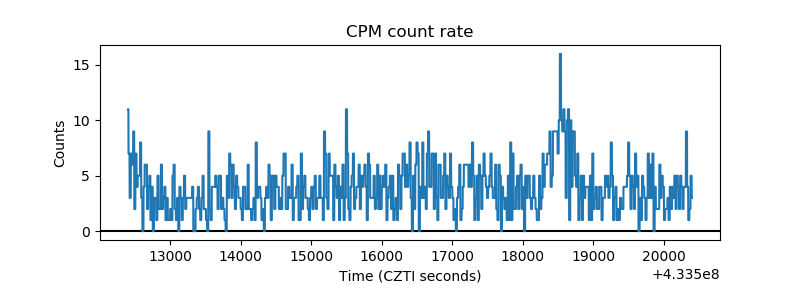 |
| CZT Counter | 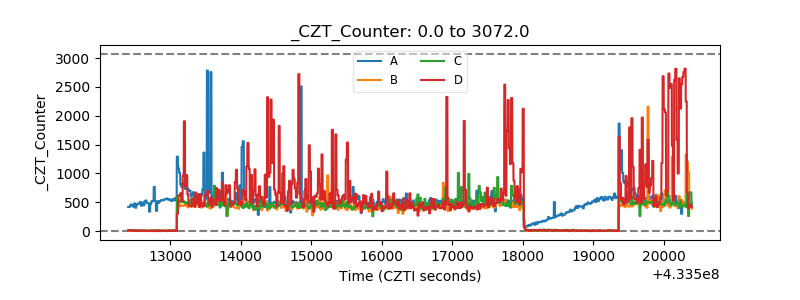 |
| +2.5 Volts monitor | 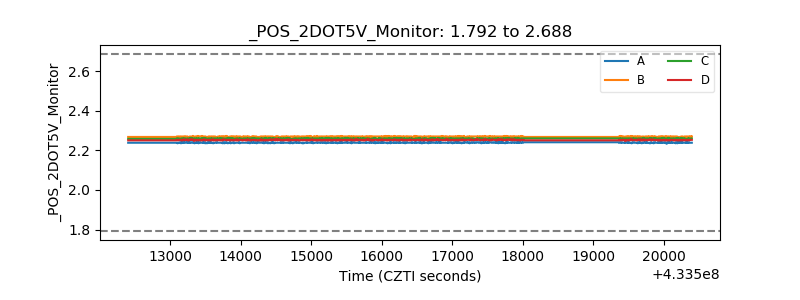 |
| +5 Volts monitor | 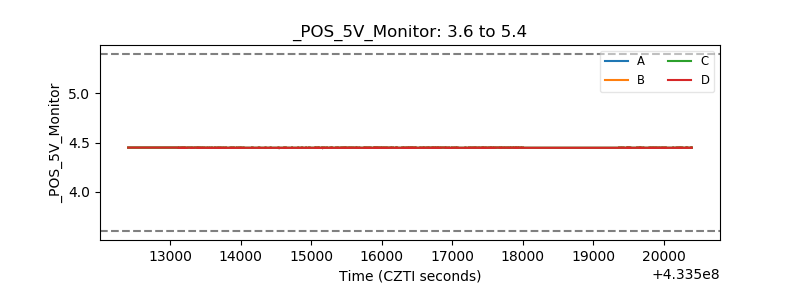 |
| _ROLL_ROT | 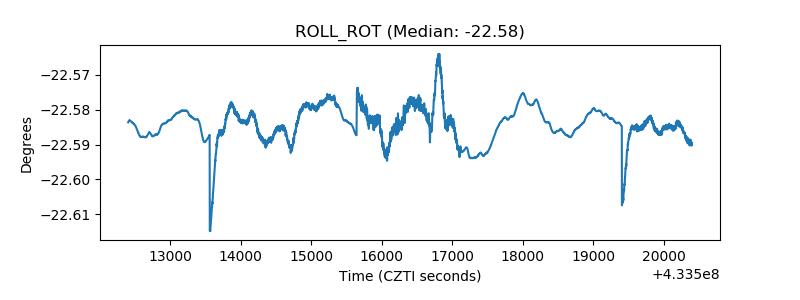 |
| _Roll_DEC | 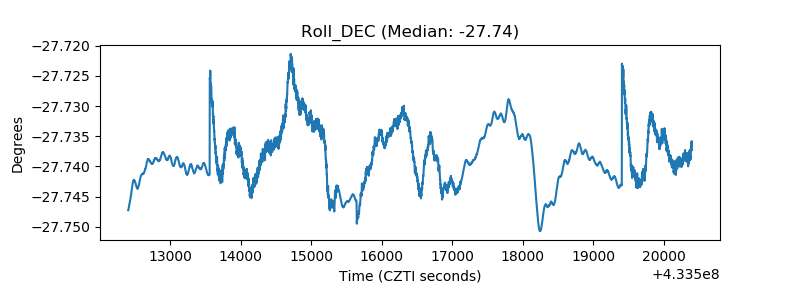 |
| _Roll_RA | 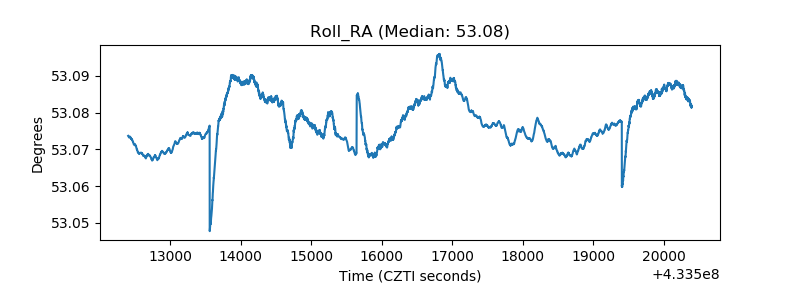 |
| Veto Counter | 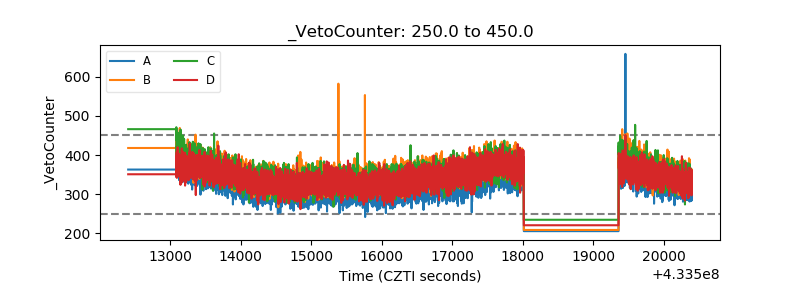 |