| Param | Original file | Final file |
|---|---|---|
| Filename | modeM0/AS1A06_006T01_9000005860_43251cztM0_level2.fits | modeM0/AS1A06_006T01_9000005860_43251cztM0_level2_quad_clean.evt |
| Size (bytes) | 543,651,840 | 143,832,960 |
| Size | 518.5 MB | 137.2 MB |
| Events in quadrant A | 4,716,036 | 955,086 |
| Events in quadrant B | 4,110,834 | 991,155 |
| Events in quadrant C | 4,287,757 | 947,968 |
| Events in quadrant D | 6,306,180 | 832,180 |
| Mode SS | |||
|---|---|---|---|
| Quadrant | BADHDUFLAG | Total packets | Discarded packets |
| A | 0 | 186 | 0 |
| B | 0 | 186 | 0 |
| C | 0 | 186 | 0 |
| D | 0 | 186 | 0 |
| Mode M9 | |||
|---|---|---|---|
| Quadrant | BADHDUFLAG | Total packets | Discarded packets |
| A | 0 | 26 | 0 |
| B | 0 | 26 | 0 |
| C | 0 | 26 | 0 |
| D | 0 | 26 | 0 |
| Mode M0 | |||
|---|---|---|---|
| Quadrant | BADHDUFLAG | Total packets | Discarded packets |
| A | 0 | 19535 | 2 |
| B | 0 | 18828 | 2 |
| C | 0 | 18769 | 2 |
| D | 0 | 25233 | 2 |
| Quadrant | Total seconds | Saturated seconds | Saturation percentage |
|---|---|---|---|
| A | 9057 | 22 | 0.242906% |
| B | 9058 | 43 | 0.474718% |
| C | 9058 | 19 | 0.209759% |
| D | 9058 | 533 | 5.884301% |
Noise dominated data is calculated using 1-second bins in cleaned event files. If a bin has >2000 counts, and if more than 50% of those come from <1% of pixels, then it is considered to be noise-dominated and hence unusable.
| Quadrant | # 1 sec bins | Bins with >0 counts | Bins with >2000 counts | High rate bins dominated by noise | Noise dominated (total time) | Noise dominated (detector-on time) | Marked lightcurve |
|---|---|---|---|---|---|---|---|
| A | 11713 | 9059 | 7 | 7 | 0.06% | 0.08% | 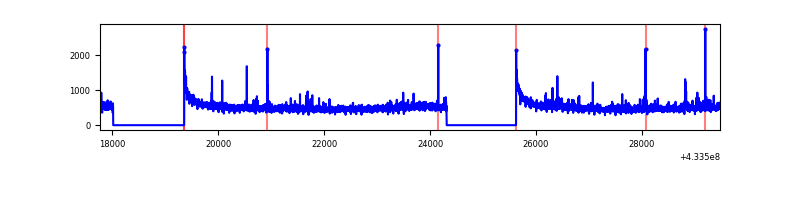 |
| B | 11714 | 9060 | 29 | 29 | 0.25% | 0.32% | 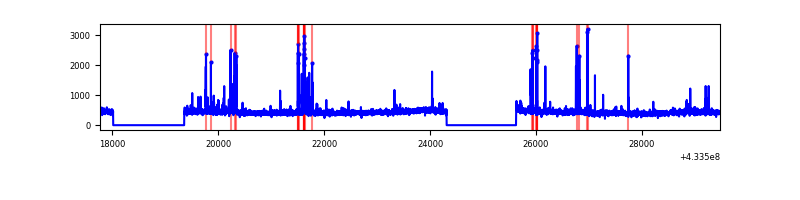 |
| C | 11714 | 9060 | 11 | 11 | 0.09% | 0.12% |  |
| D | 11714 | 9059 | 509 | 509 | 4.35% | 5.62% | 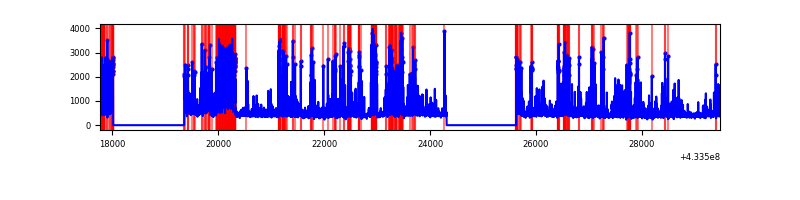 |
Top three noisy pixels from each quadrant. If the there are fewer than three noisy pixels in the level2.evt file, extra rows are filled as -1
| Pixel properties | Quadrant properties | ||||||
|---|---|---|---|---|---|---|---|
| Quadrant | DetID | PixID | Counts | Sigma | Mean | Median | Sigma |
| A | 10 | 83 | 831185 | 4214.09 | 955 | 934 | 197.0 |
| A | 12 | 189 | 146746 | 740.09 | 955 | 934 | 197.0 |
| A | 15 | 237 | 23895 | 116.54 | 955 | 934 | 197.0 |
| B | 5 | 255 | 218398 | 1157.7 | 955 | 928 | 187.8 |
| B | 0 | 189 | 94355 | 497.36 | 955 | 928 | 187.8 |
| B | 0 | 186 | 33227 | 171.94 | 955 | 928 | 187.8 |
| C | 15 | 214 | 373842 | 1686.36 | 943 | 949 | 221.1 |
| C | 14 | 254 | 207218 | 932.82 | 943 | 949 | 221.1 |
| C | 0 | 207 | 24077 | 104.59 | 943 | 949 | 221.1 |
| D | 1 | 52 | 1011530 | 4472.29 | 912 | 884 | 226.0 |
| D | 12 | 6 | 938798 | 4150.44 | 912 | 884 | 226.0 |
| D | 2 | 249 | 289910 | 1278.99 | 912 | 884 | 226.0 |
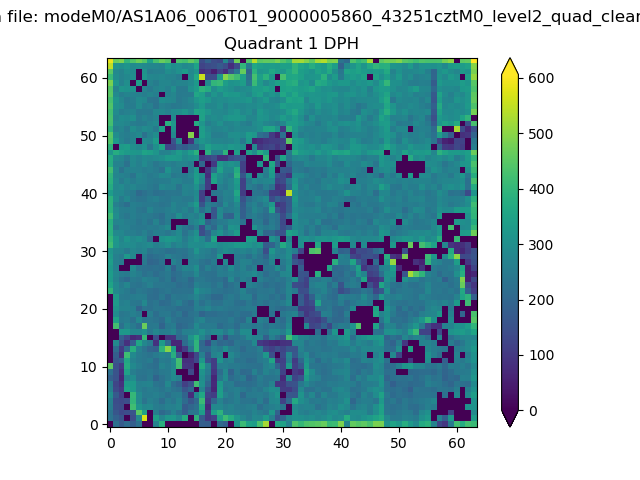
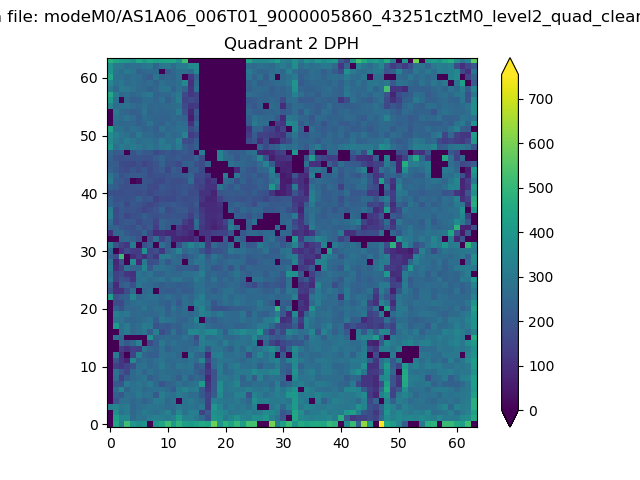
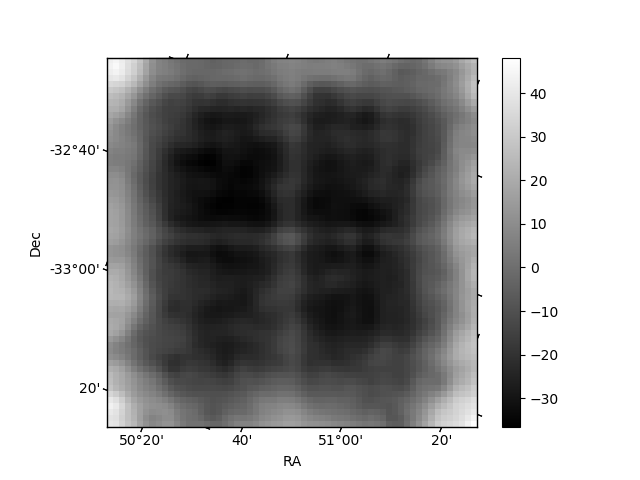
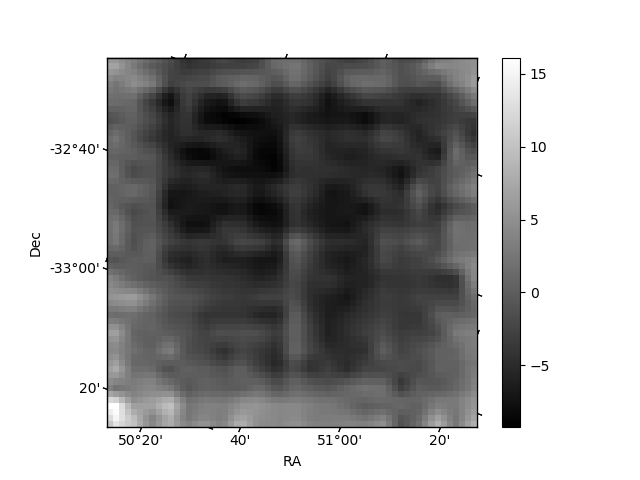
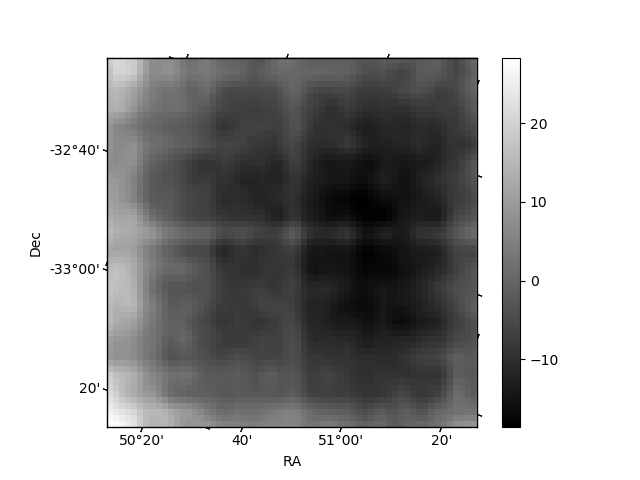
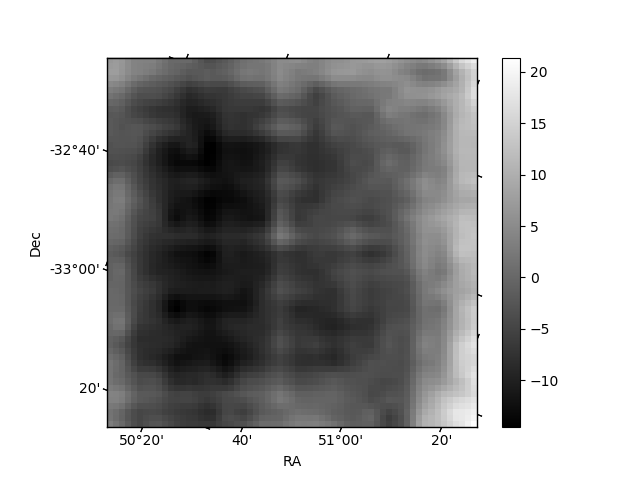
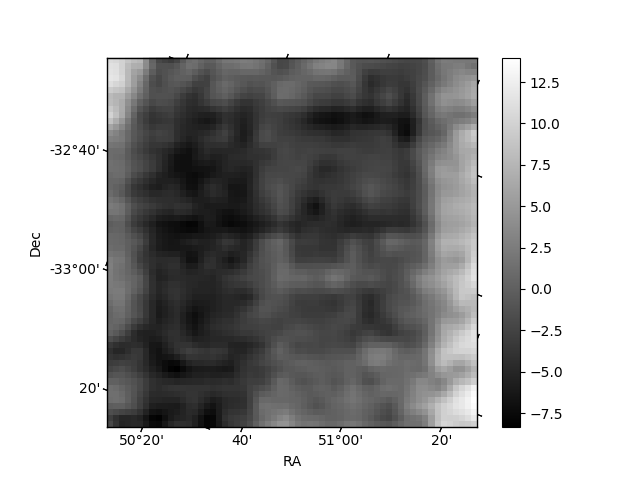
Histogram calculated using DETX and DETY for each event in the final _common_clean file
| Quadrant A | 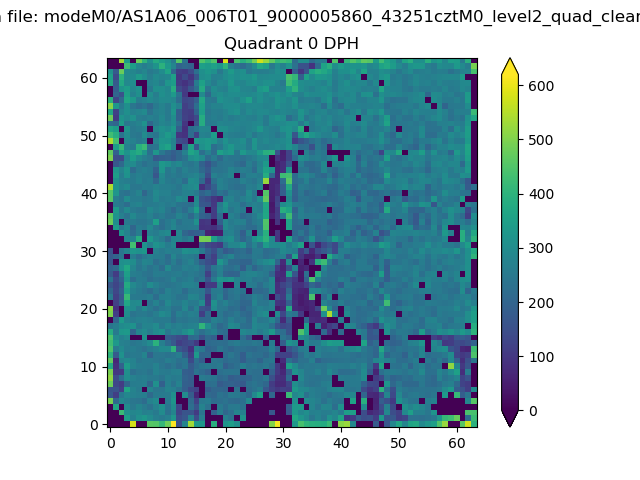 |
 |
Quadrant B |
|---|---|---|---|
| Quadrant D | 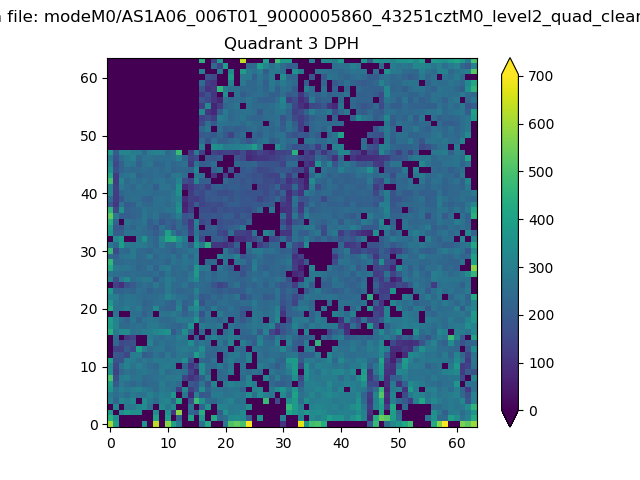 |
 |
Quadrant C |
| Plot type | Count rate plots | Images |
|---|---|---|
| Comparison with Poisson distribution Blue bars denote a histogram of data divided into 1 sec bins. Red curve is a Poisson curve with rate = median count rate of data. |
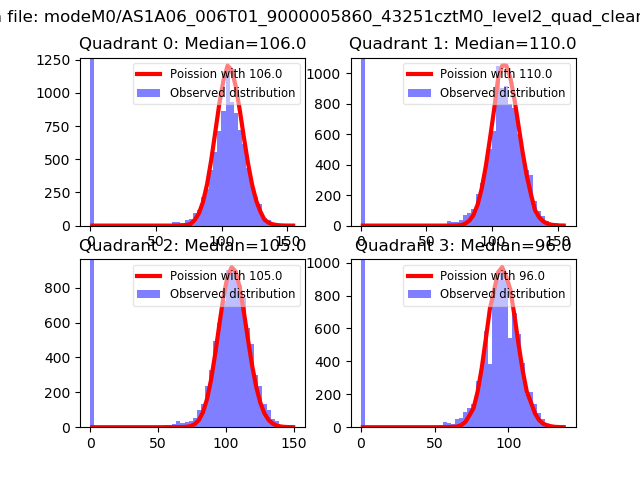 |
 |
| Quadrant-wise count rates Data is divided into 100 sec bins |
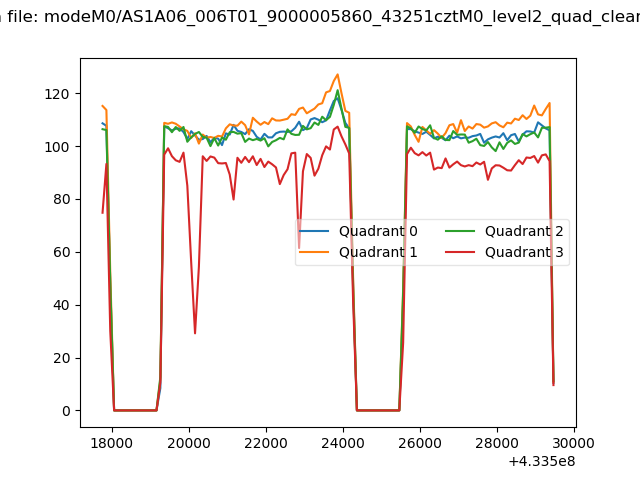 |
|
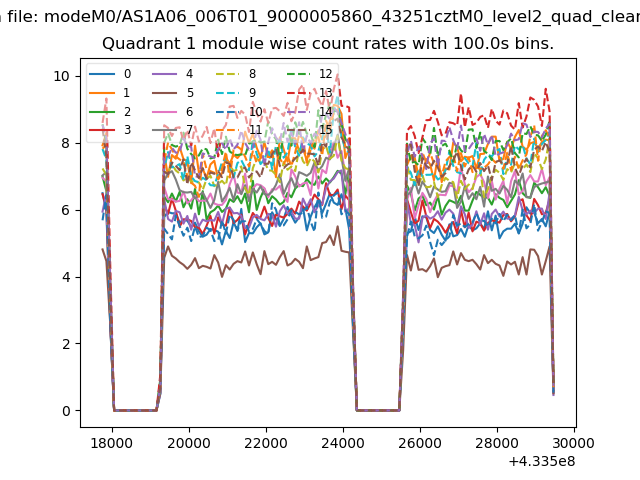
| Module-wise count rates for Quadrant A Data is divided into 100 sec bins |
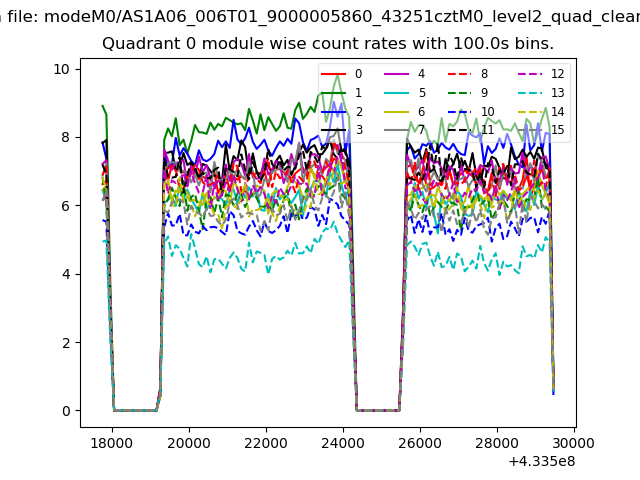 |
 |
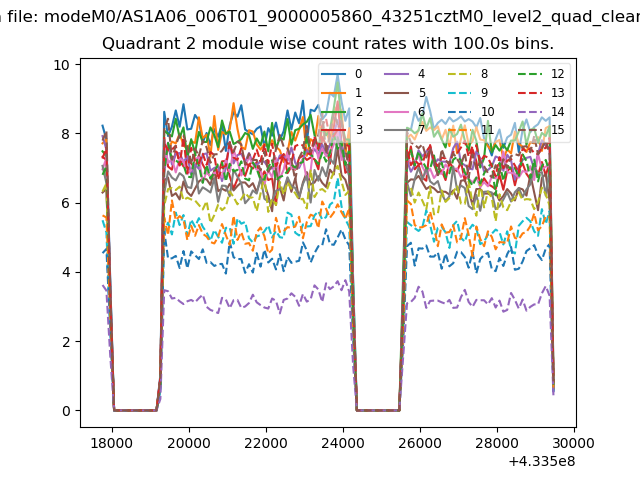
| Module-wise count rates for Quadrant B Data is divided into 100 sec bins |
 |
 |
| Module-wise count rates for Quadrant C Data is divided into 100 sec bins |
 |
 |
| Module-wise count rates for Quadrant D Data is divided into 100 sec bins |
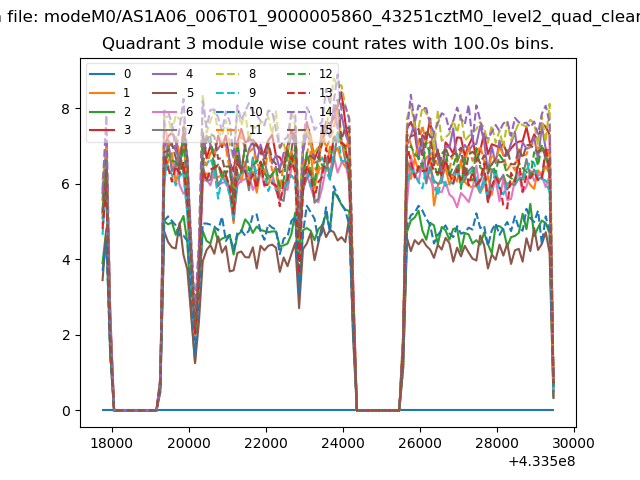 |
 |
| Parameter | Plot |
|---|---|
| CZT HV Monitor | 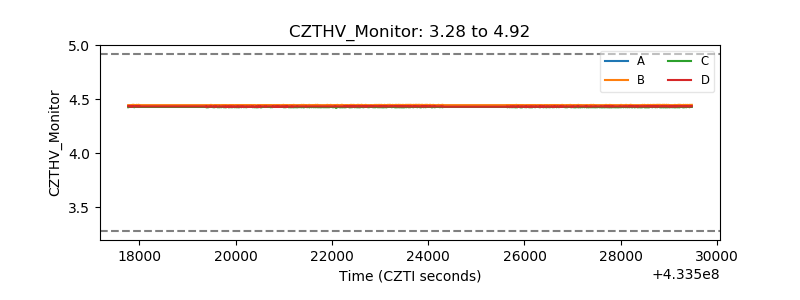 |
| D_VDD | 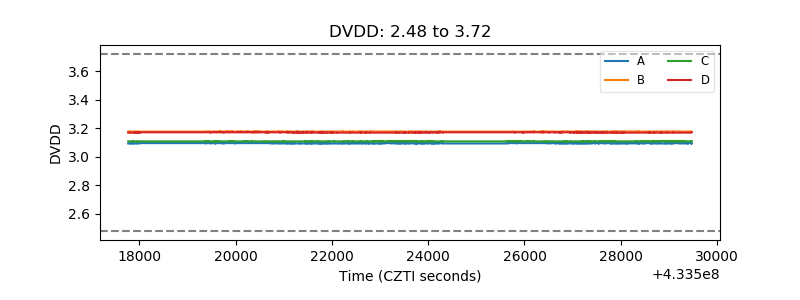 |
| Temperature 1 | 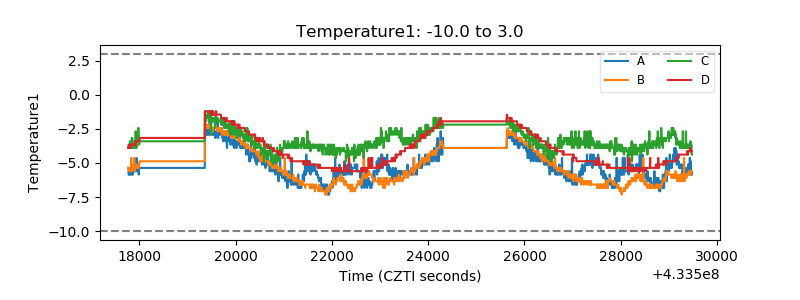 |
| Veto HV Monitor | 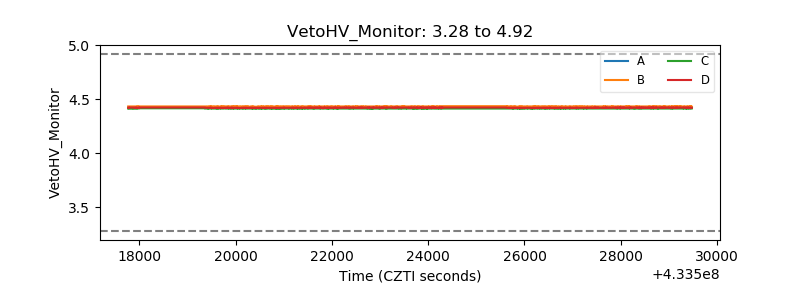 |
| Veto LLD | 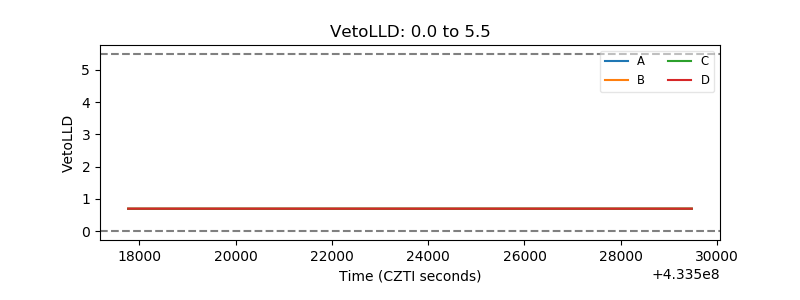 |
| Alpha Counter | 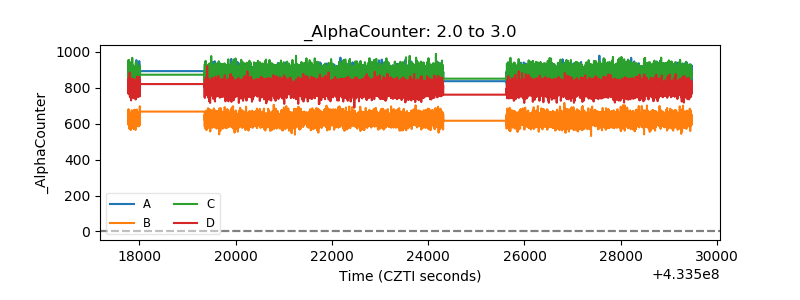 |
| _CPM_Rate | 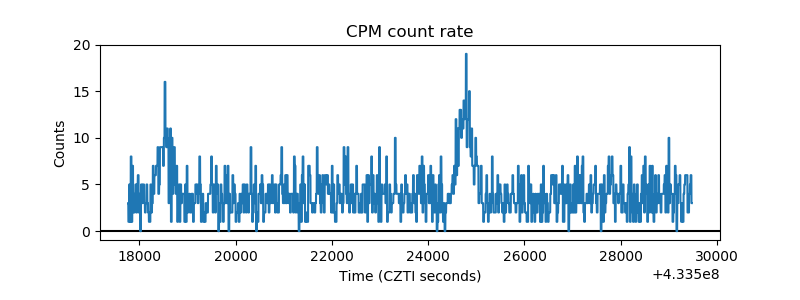 |
| CZT Counter | 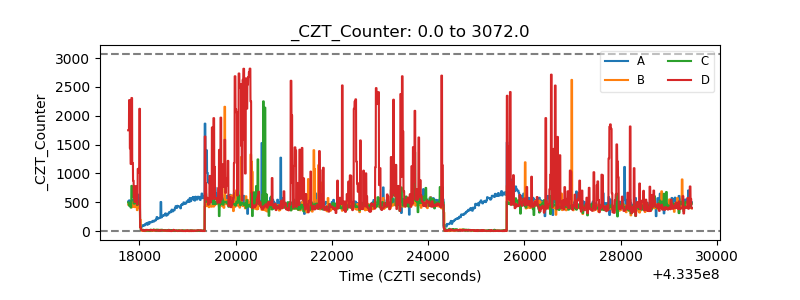 |
| +2.5 Volts monitor | 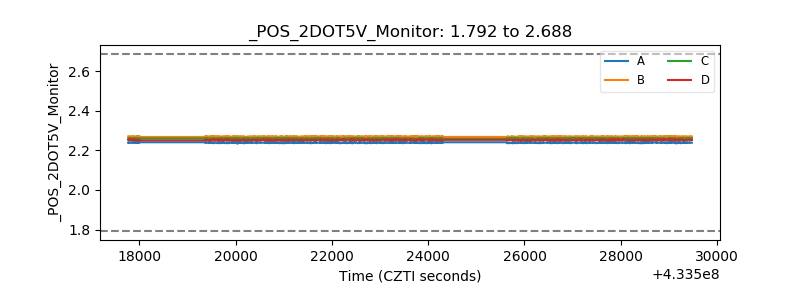 |
| +5 Volts monitor | 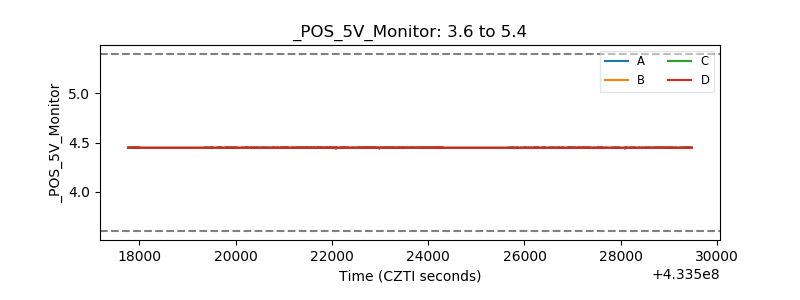 |
| _ROLL_ROT | 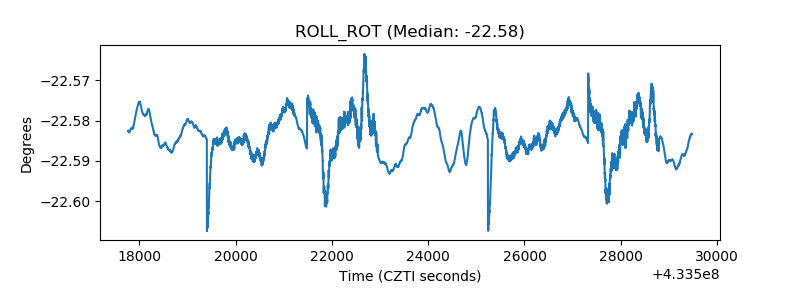 |
| _Roll_DEC |  |
| _Roll_RA | 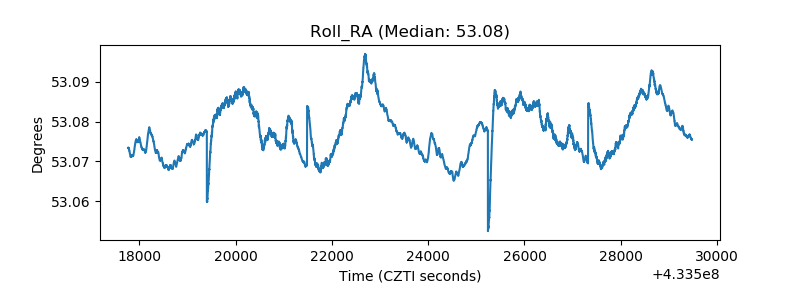 |
| Veto Counter | 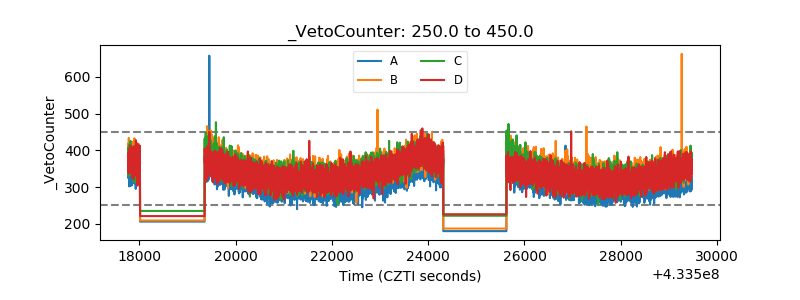 |