| Param | Original file | Final file |
|---|---|---|
| Filename | modeM0/AS1A06_006T01_9000005860_43254cztM0_level2.fits | modeM0/AS1A06_006T01_9000005860_43254cztM0_level2_quad_clean.evt |
| Size (bytes) | 330,949,440 | 97,957,440 |
| Size | 315.6 MB | 93.4 MB |
| Events in quadrant A | 3,372,980 | 644,869 |
| Events in quadrant B | 2,561,312 | 682,091 |
| Events in quadrant C | 2,815,070 | 645,187 |
| Events in quadrant D | 3,044,545 | 584,772 |
| Mode SS | |||
|---|---|---|---|
| Quadrant | BADHDUFLAG | Total packets | Discarded packets |
| A | 0 | 120 | 0 |
| B | 0 | 120 | 0 |
| C | 0 | 120 | 0 |
| D | 0 | 120 | 0 |
| Mode M9 | |||
|---|---|---|---|
| Quadrant | BADHDUFLAG | Total packets | Discarded packets |
| A | 0 | 35 | 0 |
| B | 0 | 35 | 0 |
| C | 0 | 35 | 0 |
| D | 0 | 35 | 0 |
| Mode M0 | |||
|---|---|---|---|
| Quadrant | BADHDUFLAG | Total packets | Discarded packets |
| A | 0 | 13667 | 2 |
| B | 0 | 11802 | 2 |
| C | 0 | 11983 | 2 |
| D | 0 | 13231 | 2 |
| Quadrant | Total seconds | Saturated seconds | Saturation percentage |
|---|---|---|---|
| A | 5861 | 57 | 0.972530% |
| B | 5862 | 9 | 0.153531% |
| C | 5861 | 9 | 0.153557% |
| D | 5861 | 86 | 1.467326% |
Noise dominated data is calculated using 1-second bins in cleaned event files. If a bin has >2000 counts, and if more than 50% of those come from <1% of pixels, then it is considered to be noise-dominated and hence unusable.
| Quadrant | # 1 sec bins | Bins with >0 counts | Bins with >2000 counts | High rate bins dominated by noise | Noise dominated (total time) | Noise dominated (detector-on time) | Marked lightcurve |
|---|---|---|---|---|---|---|---|
| A | 9325 | 5863 | 29 | 29 | 0.31% | 0.49% | 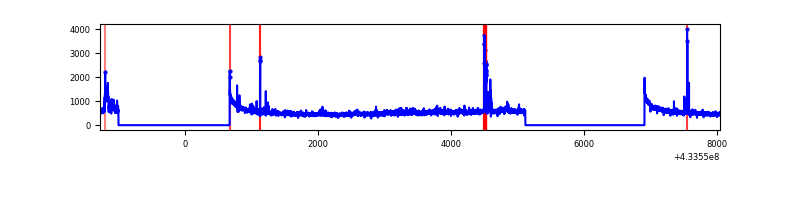 |
| B | 9326 | 5864 | 0 | 0 | 0.00% | 0.00% | 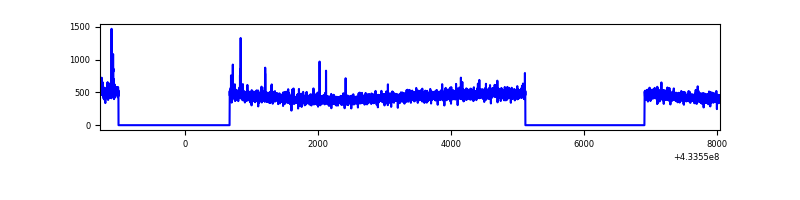 |
| C | 9325 | 5863 | 2 | 2 | 0.02% | 0.03% | 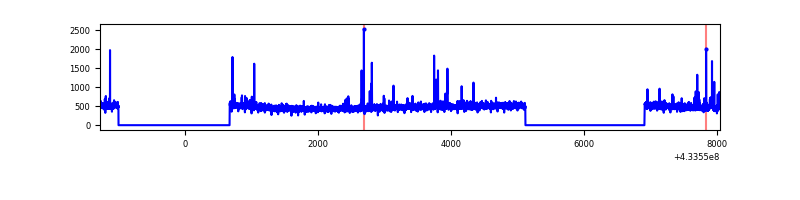 |
| D | 9325 | 5863 | 64 | 64 | 0.69% | 1.09% | 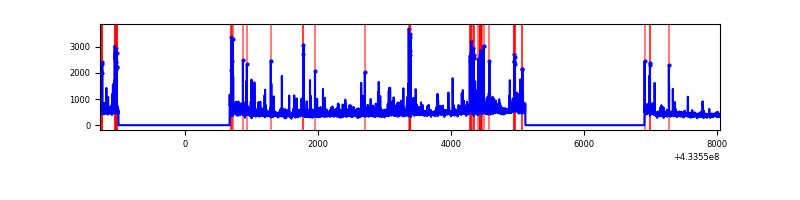 |
Top three noisy pixels from each quadrant. If the there are fewer than three noisy pixels in the level2.evt file, extra rows are filled as -1
| Pixel properties | Quadrant properties | ||||||
|---|---|---|---|---|---|---|---|
| Quadrant | DetID | PixID | Counts | Sigma | Mean | Median | Sigma |
| A | 10 | 83 | 601412 | 4554.22 | 636 | 622 | 131.9 |
| A | 15 | 237 | 174861 | 1320.8 | 636 | 622 | 131.9 |
| A | 12 | 189 | 121179 | 913.87 | 636 | 622 | 131.9 |
| B | 0 | 189 | 18778 | 144.79 | 643 | 624 | 125.4 |
| B | 5 | 255 | 18696 | 144.14 | 643 | 624 | 125.4 |
| B | 12 | 111 | 15823 | 121.22 | 643 | 624 | 125.4 |
| C | 15 | 214 | 246088 | 1636.92 | 637 | 640 | 149.9 |
| C | 14 | 254 | 52166 | 343.63 | 637 | 640 | 149.9 |
| C | 0 | 207 | 27606 | 179.84 | 637 | 640 | 149.9 |
| D | 1 | 52 | 281038 | 1844.1 | 625 | 607 | 152.1 |
| D | 2 | 249 | 181311 | 1188.3 | 625 | 607 | 152.1 |
| D | 13 | 249 | 123216 | 806.27 | 625 | 607 | 152.1 |
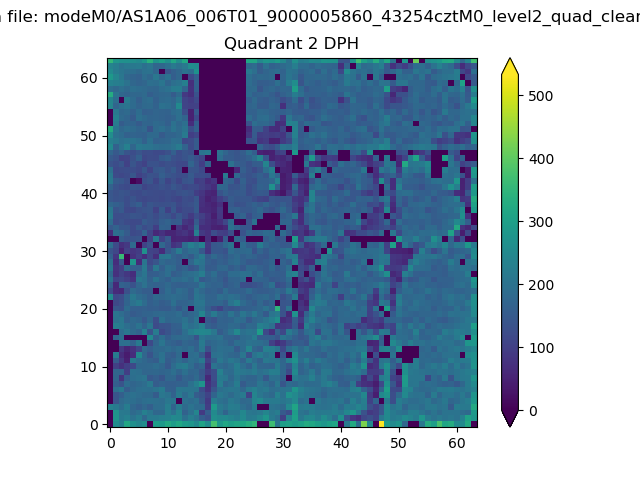
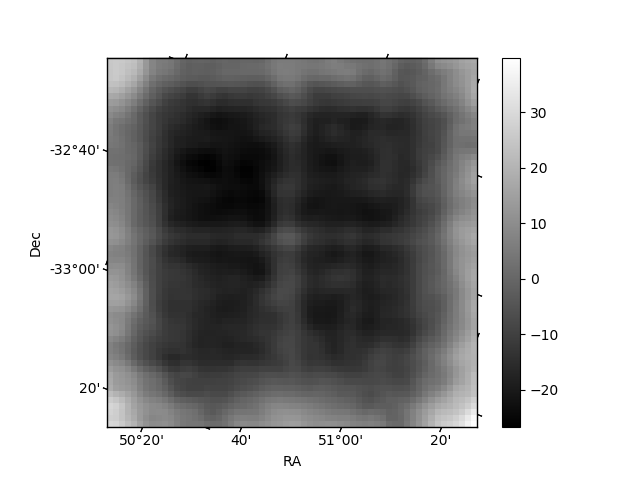
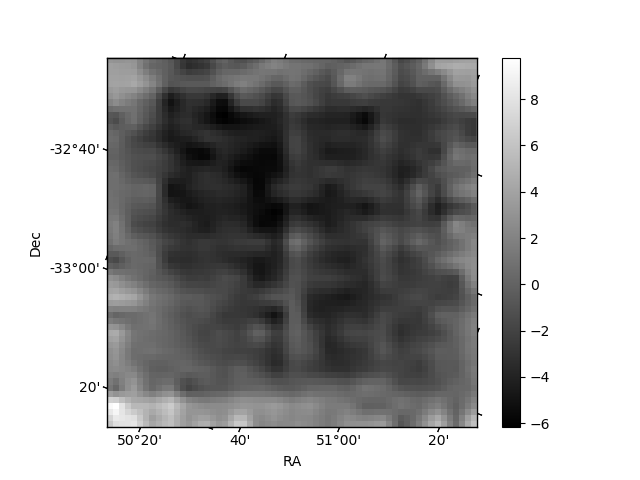
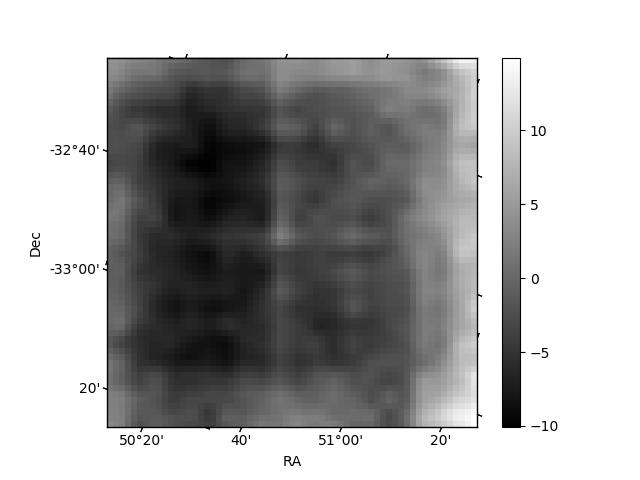
Histogram calculated using DETX and DETY for each event in the final _common_clean file
| Quadrant A | 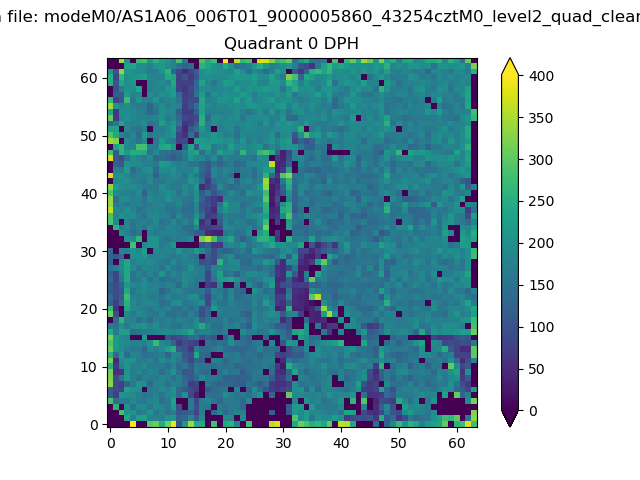 |
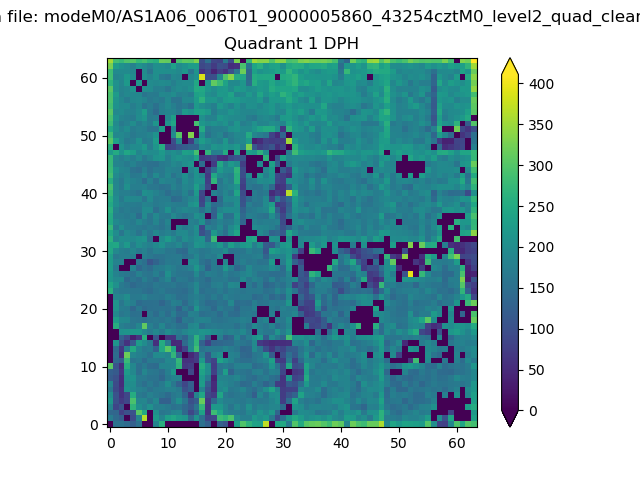 |
Quadrant B |
|---|---|---|---|
| Quadrant D | 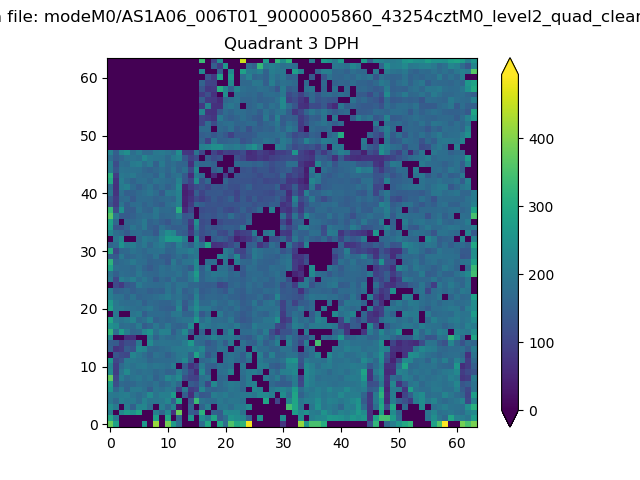 |
 |
Quadrant C |
| Plot type | Count rate plots | Images |
|---|---|---|
| Comparison with Poisson distribution Blue bars denote a histogram of data divided into 1 sec bins. Red curve is a Poisson curve with rate = median count rate of data. |
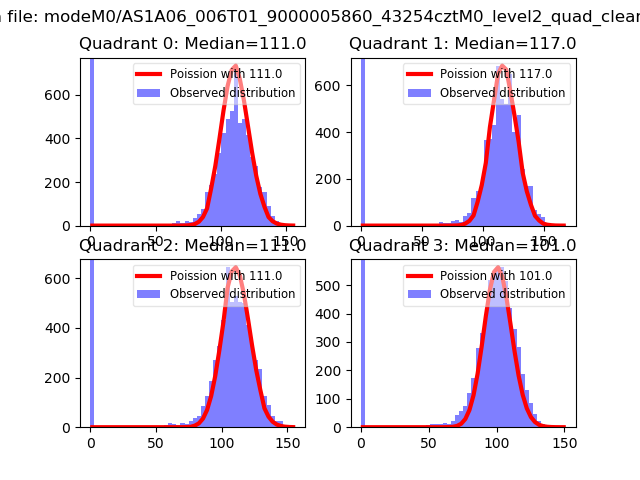 |
 |
| Quadrant-wise count rates Data is divided into 100 sec bins |
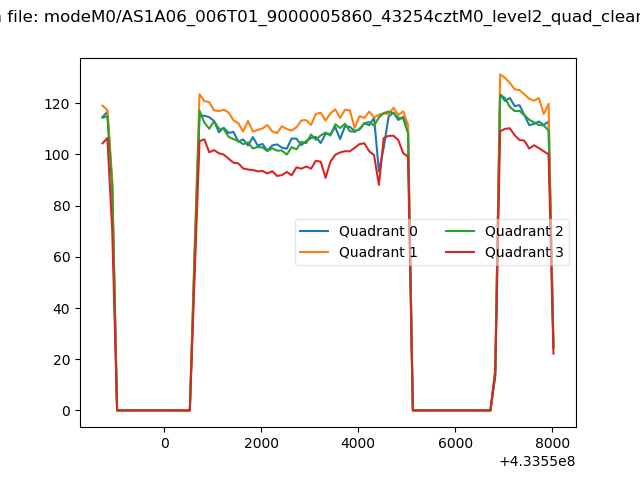 |
|
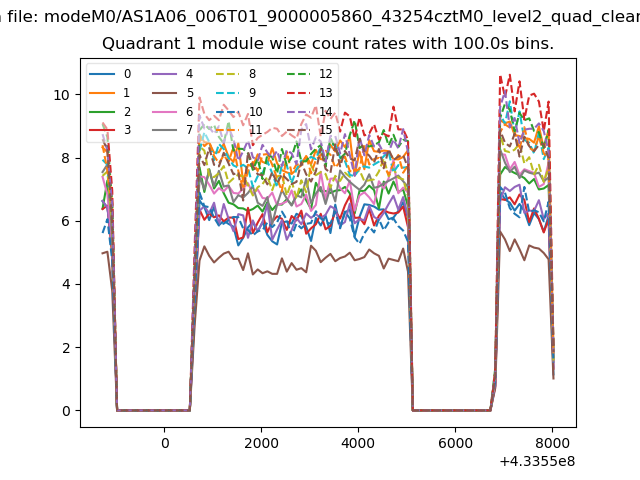
| Module-wise count rates for Quadrant A Data is divided into 100 sec bins |
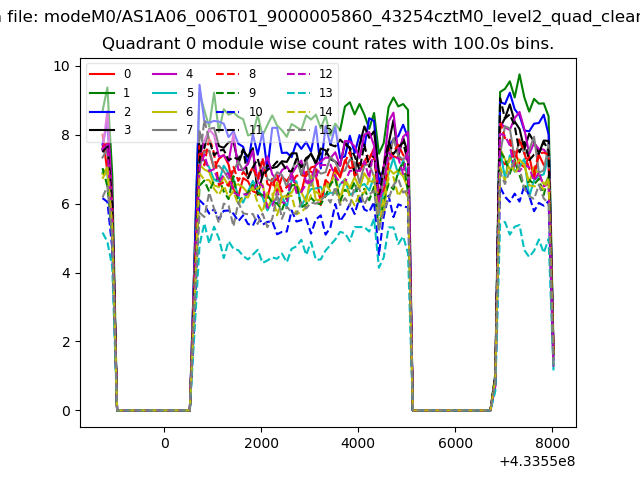 |
 |
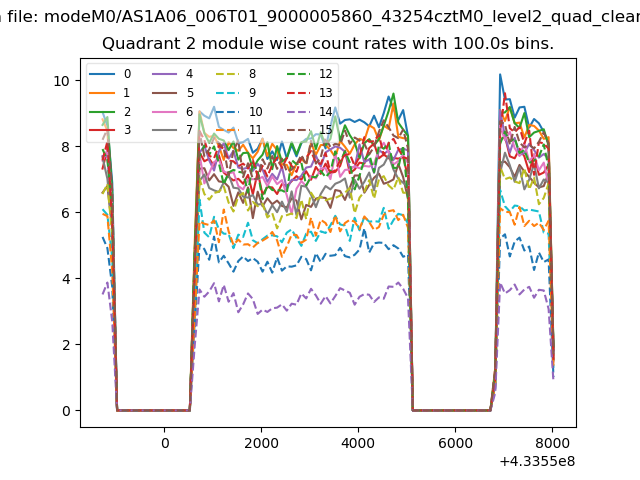
| Module-wise count rates for Quadrant B Data is divided into 100 sec bins |
 |
 |
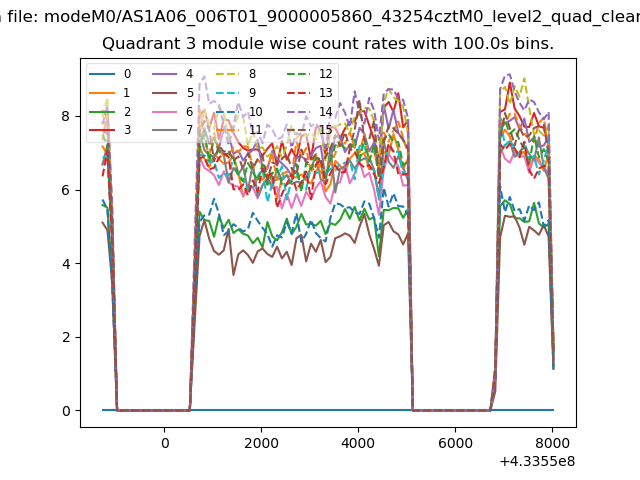
| Module-wise count rates for Quadrant C Data is divided into 100 sec bins |
 |
 |
| Module-wise count rates for Quadrant D Data is divided into 100 sec bins |
 |
 |
| Parameter | Plot |
|---|---|
| CZT HV Monitor | 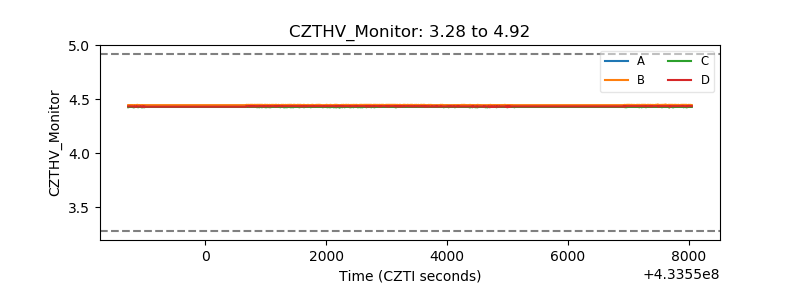 |
| D_VDD | 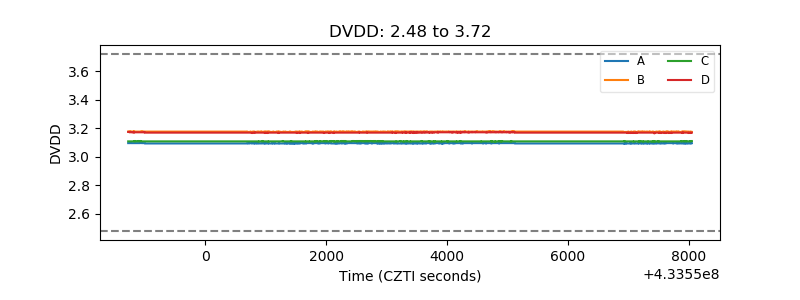 |
| Temperature 1 | 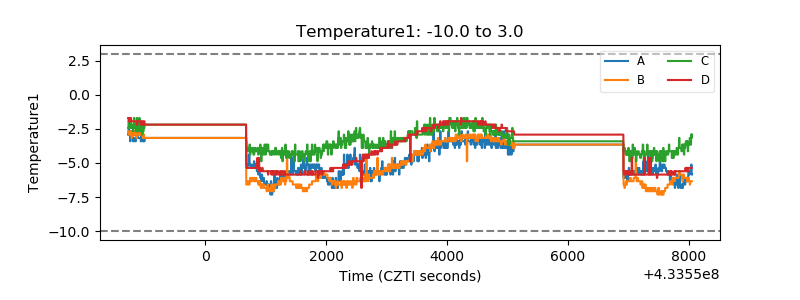 |
| Veto HV Monitor | 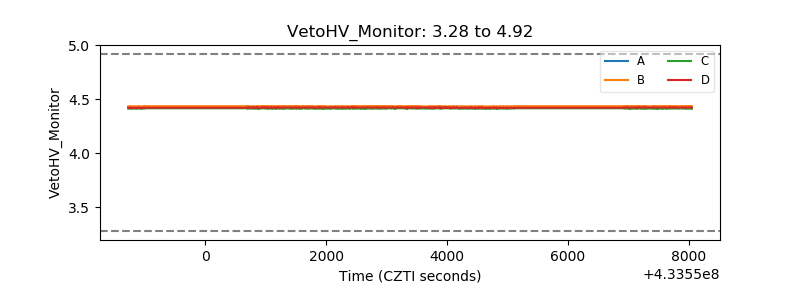 |
| Veto LLD | 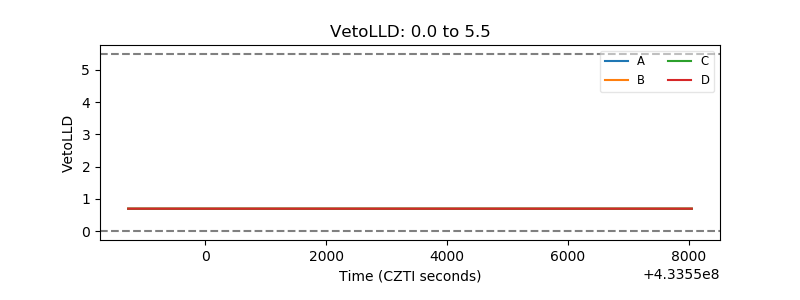 |
| Alpha Counter | 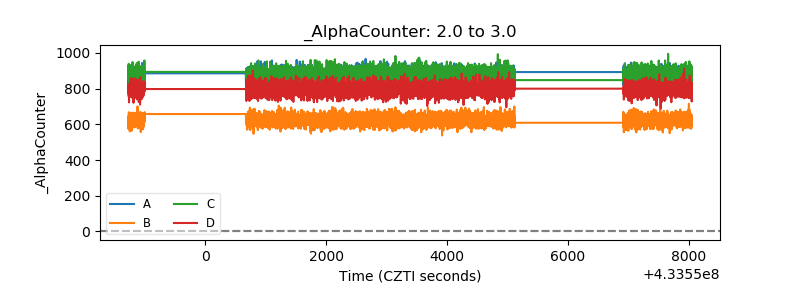 |
| _CPM_Rate | 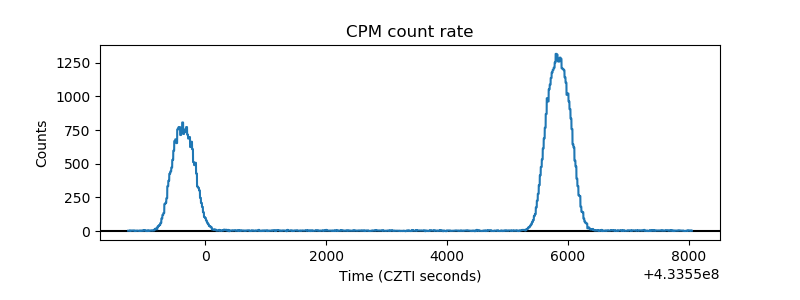 |
| CZT Counter | 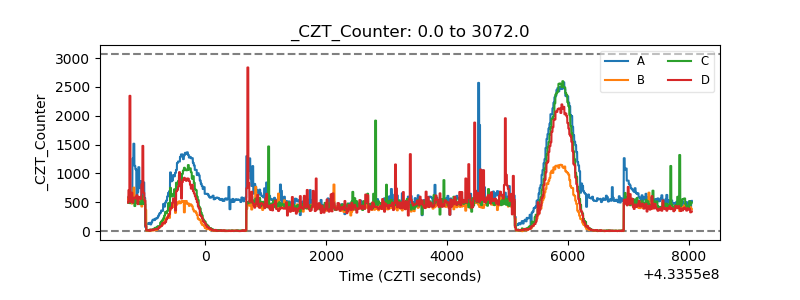 |
| +2.5 Volts monitor | 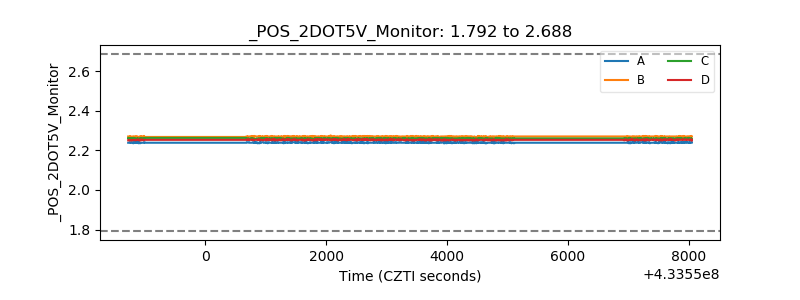 |
| +5 Volts monitor | 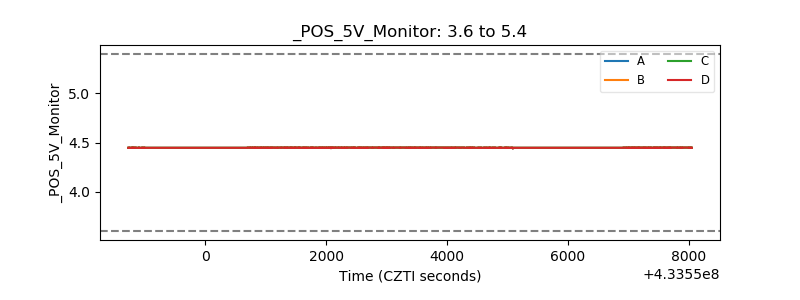 |
| _ROLL_ROT | 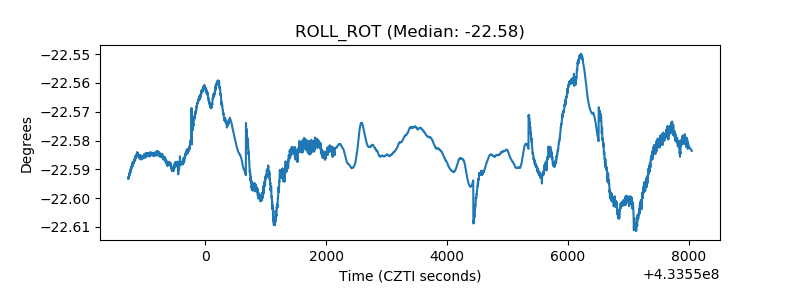 |
| _Roll_DEC | 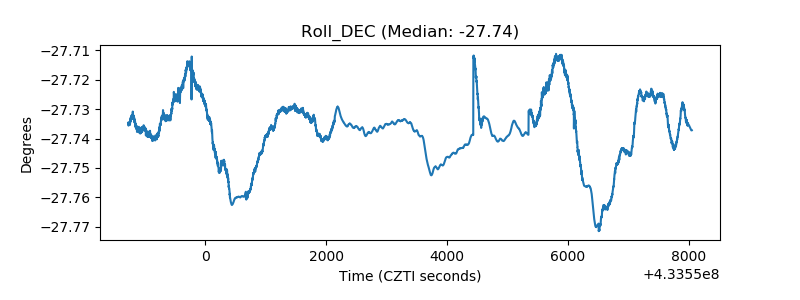 |
| _Roll_RA | 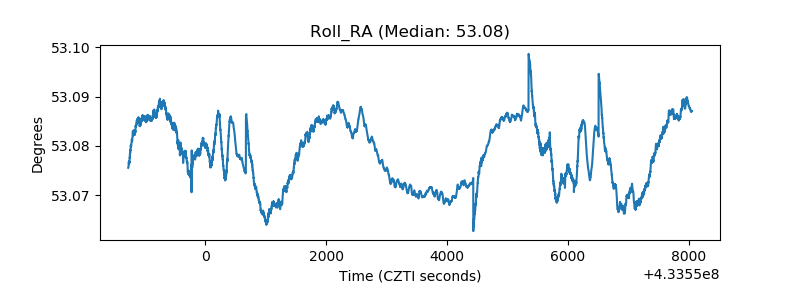 |
| Veto Counter | 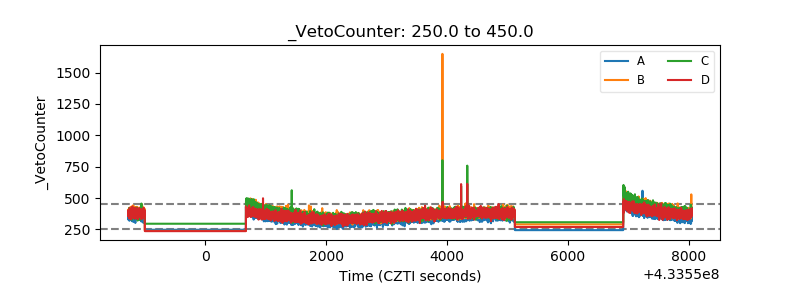 |