| Param | Original file | Final file |
|---|---|---|
| Filename | modeM0/AS1A06_006T01_9000005860_43255cztM0_level2.fits | modeM0/AS1A06_006T01_9000005860_43255cztM0_level2_quad_clean.evt |
| Size (bytes) | 313,750,080 | 93,553,920 |
| Size | 299.2 MB | 89.2 MB |
| Events in quadrant A | 3,086,669 | 618,855 |
| Events in quadrant B | 2,394,411 | 655,173 |
| Events in quadrant C | 2,772,363 | 618,741 |
| Events in quadrant D | 2,937,553 | 560,210 |
| Mode SS | |||
|---|---|---|---|
| Quadrant | BADHDUFLAG | Total packets | Discarded packets |
| A | 0 | 110 | 0 |
| B | 0 | 110 | 0 |
| C | 0 | 110 | 0 |
| D | 0 | 110 | 0 |
| Mode M9 | |||
|---|---|---|---|
| Quadrant | BADHDUFLAG | Total packets | Discarded packets |
| A | 0 | 33 | 0 |
| B | 0 | 34 | 0 |
| C | 0 | 34 | 0 |
| D | 0 | 34 | 0 |
| Mode M0 | |||
|---|---|---|---|
| Quadrant | BADHDUFLAG | Total packets | Discarded packets |
| A | 0 | 12424 | 2 |
| B | 0 | 10874 | 2 |
| C | 0 | 11465 | 2 |
| D | 0 | 12545 | 2 |
| Quadrant | Total seconds | Saturated seconds | Saturation percentage |
|---|---|---|---|
| A | 5429 | 18 | 0.331553% |
| B | 5429 | 5 | 0.092098% |
| C | 5429 | 12 | 0.221035% |
| D | 5429 | 85 | 1.565666% |
Noise dominated data is calculated using 1-second bins in cleaned event files. If a bin has >2000 counts, and if more than 50% of those come from <1% of pixels, then it is considered to be noise-dominated and hence unusable.
| Quadrant | # 1 sec bins | Bins with >0 counts | Bins with >2000 counts | High rate bins dominated by noise | Noise dominated (total time) | Noise dominated (detector-on time) | Marked lightcurve |
|---|---|---|---|---|---|---|---|
| A | 7342 | 5430 | 7 | 7 | 0.10% | 0.13% | 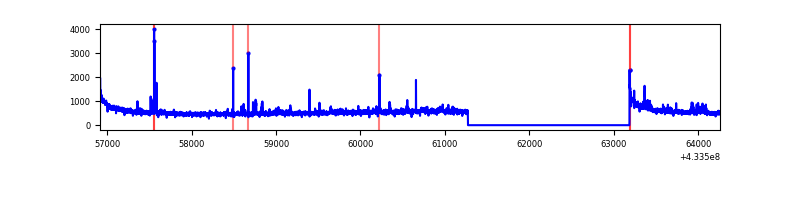 |
| B | 7342 | 5430 | 0 | 0 | 0.00% | 0.00% | 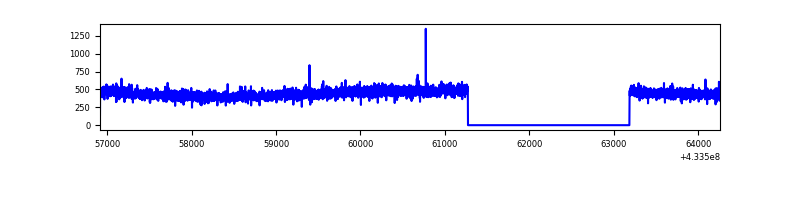 |
| C | 7342 | 5430 | 8 | 8 | 0.11% | 0.15% |  |
| D | 7342 | 5430 | 72 | 72 | 0.98% | 1.33% | 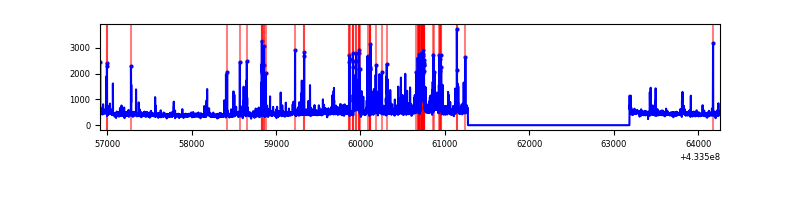 |
Top three noisy pixels from each quadrant. If the there are fewer than three noisy pixels in the level2.evt file, extra rows are filled as -1
| Pixel properties | Quadrant properties | ||||||
|---|---|---|---|---|---|---|---|
| Quadrant | DetID | PixID | Counts | Sigma | Mean | Median | Sigma |
| A | 10 | 83 | 573138 | 4627.68 | 604 | 593 | 123.7 |
| A | 12 | 189 | 115801 | 931.19 | 604 | 593 | 123.7 |
| A | 15 | 237 | 32783 | 260.18 | 604 | 593 | 123.7 |
| B | 0 | 189 | 15115 | 123.51 | 605 | 589 | 117.6 |
| B | 12 | 111 | 14944 | 122.06 | 605 | 589 | 117.6 |
| B | 11 | 111 | 13734 | 111.77 | 605 | 589 | 117.6 |
| C | 15 | 214 | 230634 | 1632.43 | 602 | 606 | 140.9 |
| C | 3 | 233 | 79573 | 560.4 | 602 | 606 | 140.9 |
| C | 14 | 254 | 79349 | 558.81 | 602 | 606 | 140.9 |
| D | 1 | 52 | 207430 | 1418.56 | 595 | 578 | 145.8 |
| D | 12 | 233 | 153976 | 1051.98 | 595 | 578 | 145.8 |
| D | 13 | 249 | 138753 | 947.59 | 595 | 578 | 145.8 |
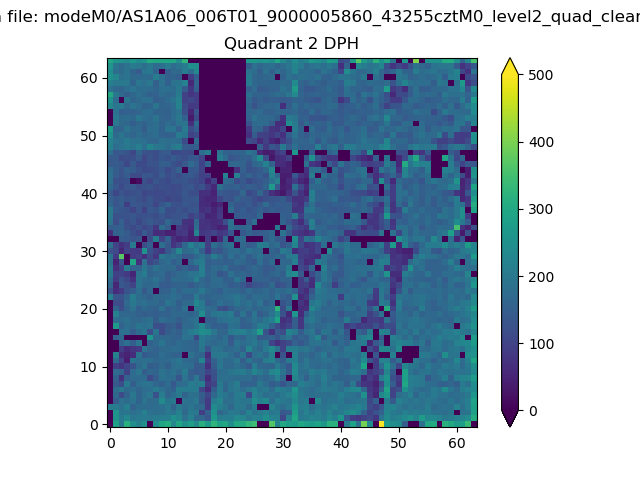
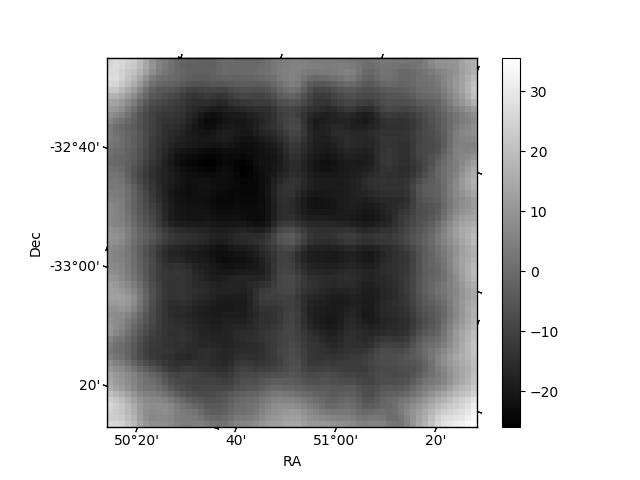
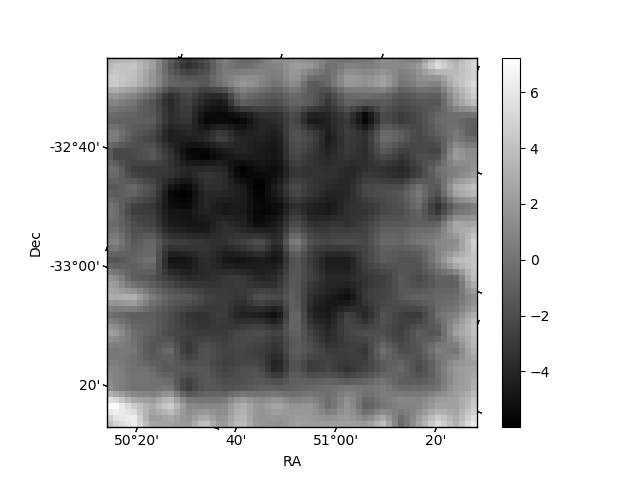
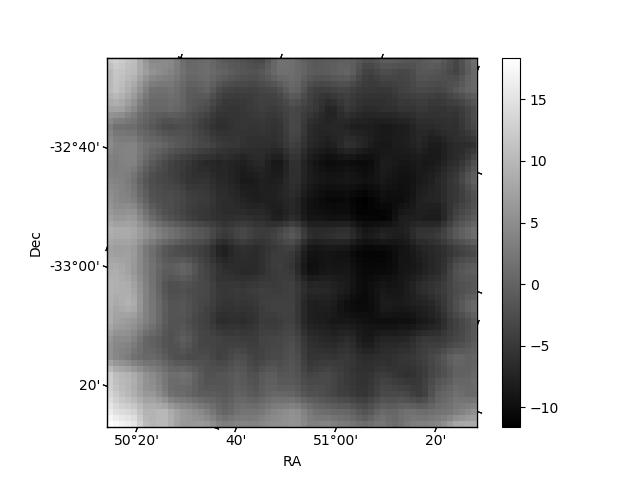
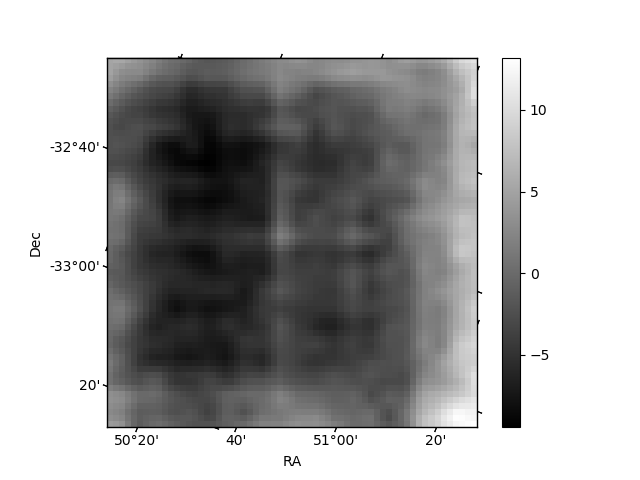
Histogram calculated using DETX and DETY for each event in the final _common_clean file
| Quadrant A | 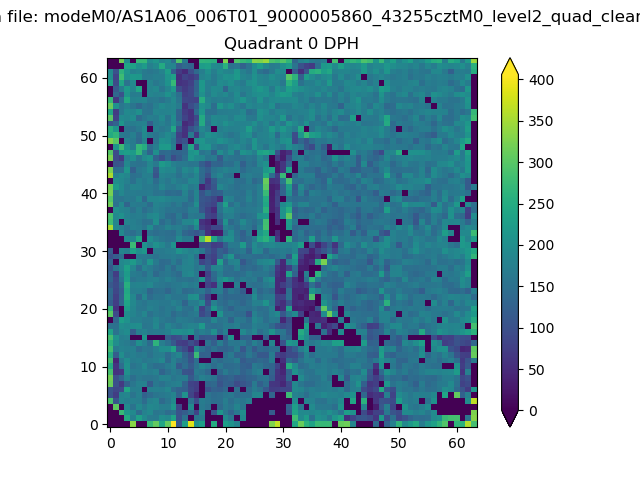 |
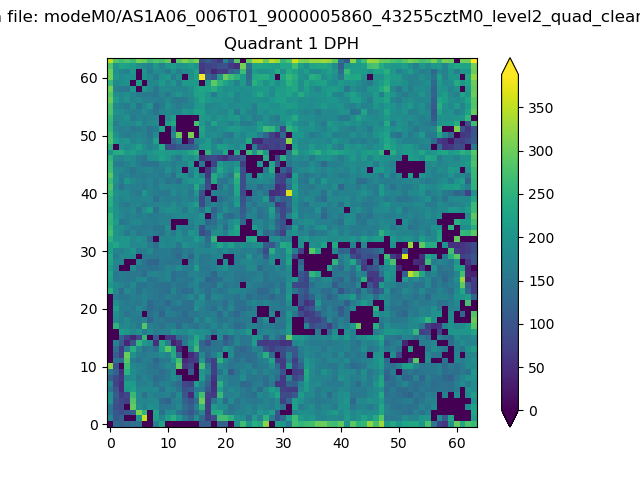 |
Quadrant B |
|---|---|---|---|
| Quadrant D | 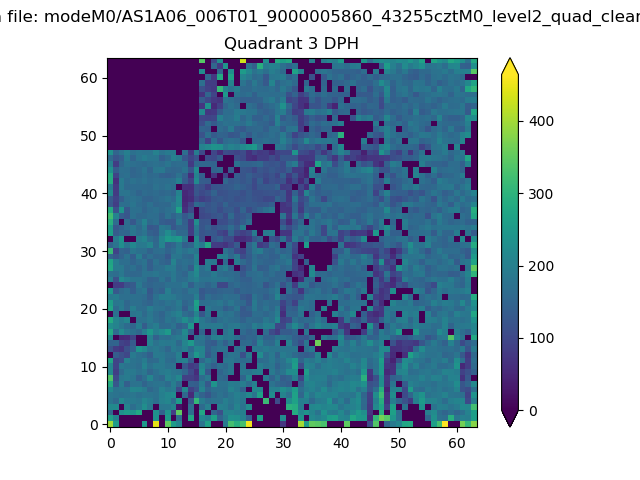 |
 |
Quadrant C |
| Plot type | Count rate plots | Images |
|---|---|---|
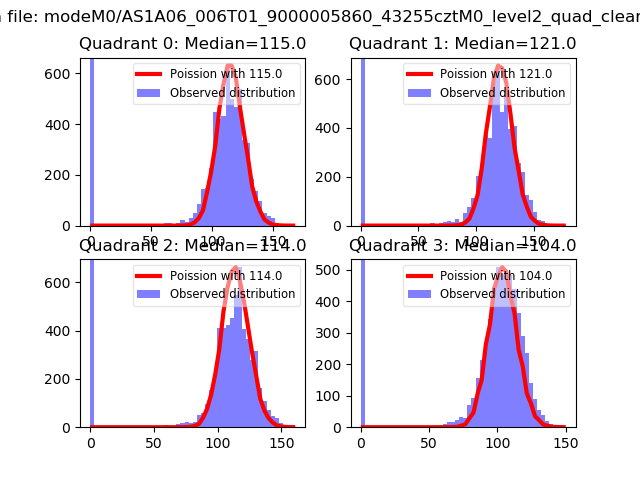
| Comparison with Poisson distribution Blue bars denote a histogram of data divided into 1 sec bins. Red curve is a Poisson curve with rate = median count rate of data. |
 |
 |
| Quadrant-wise count rates Data is divided into 100 sec bins |
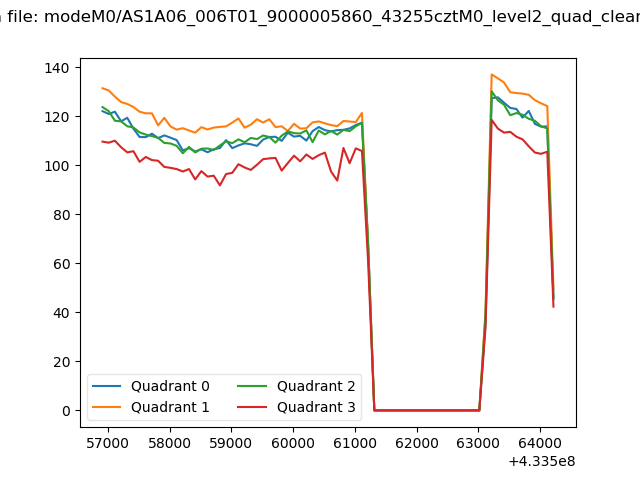 |
|
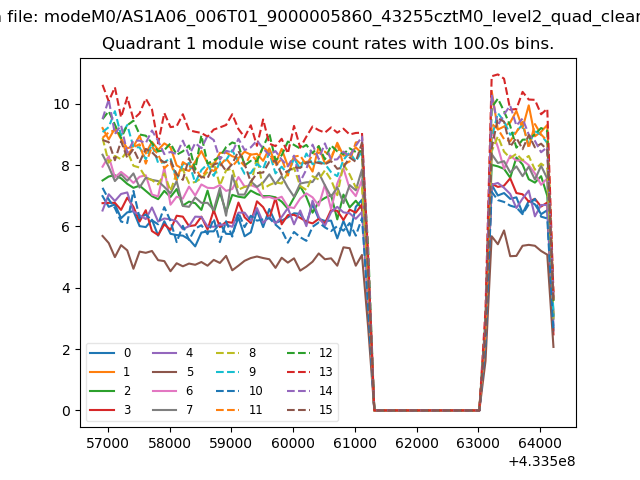
| Module-wise count rates for Quadrant A Data is divided into 100 sec bins |
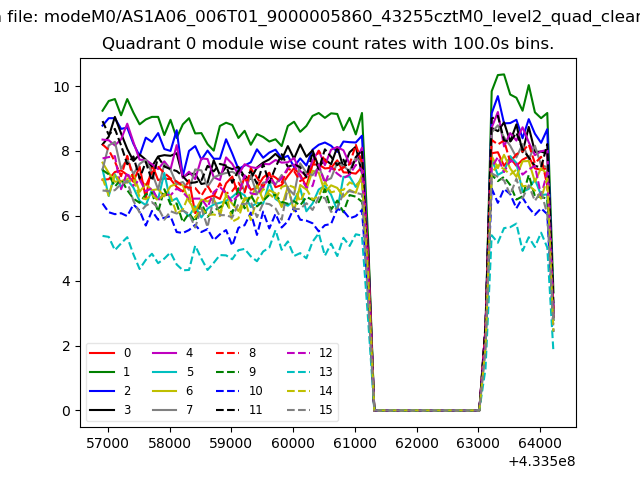 |
 |
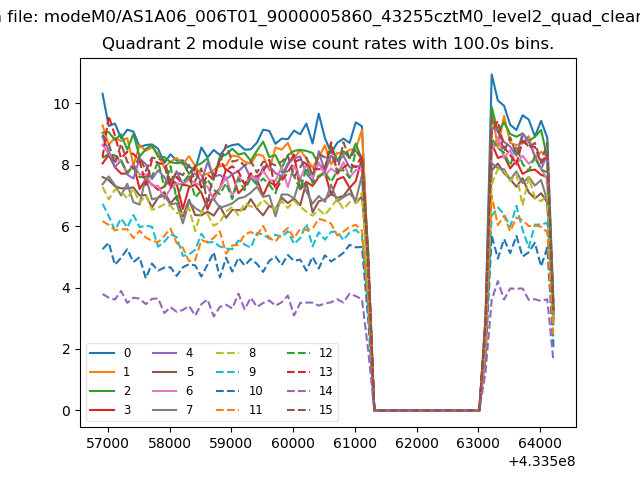
| Module-wise count rates for Quadrant B Data is divided into 100 sec bins |
 |
 |
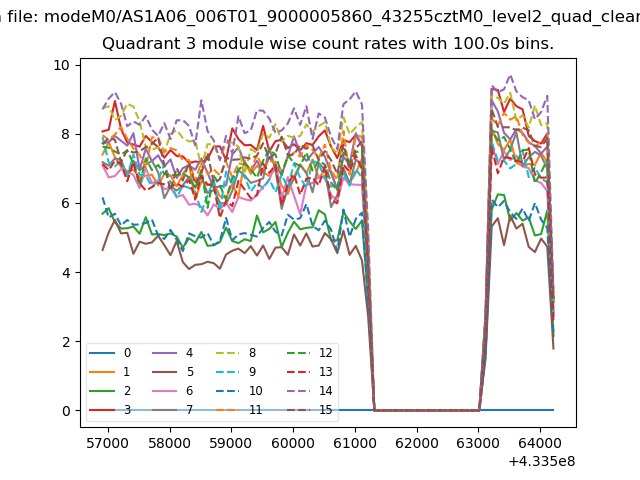
| Module-wise count rates for Quadrant C Data is divided into 100 sec bins |
 |
 |
| Module-wise count rates for Quadrant D Data is divided into 100 sec bins |
 |
 |
| Parameter | Plot |
|---|---|
| CZT HV Monitor | 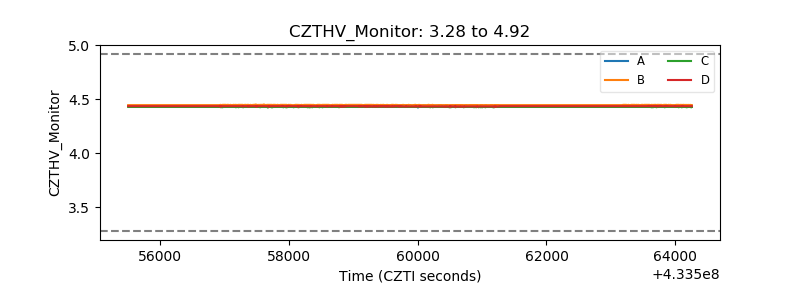 |
| D_VDD | 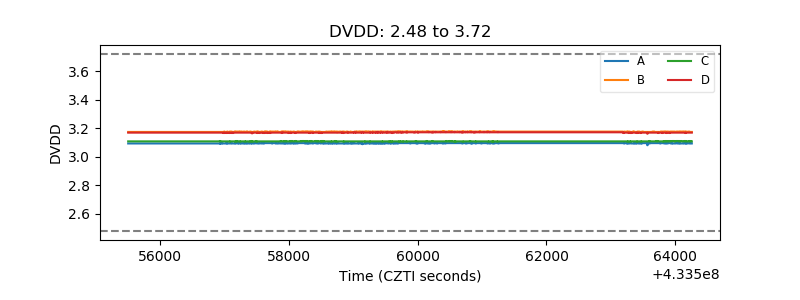 |
| Temperature 1 | 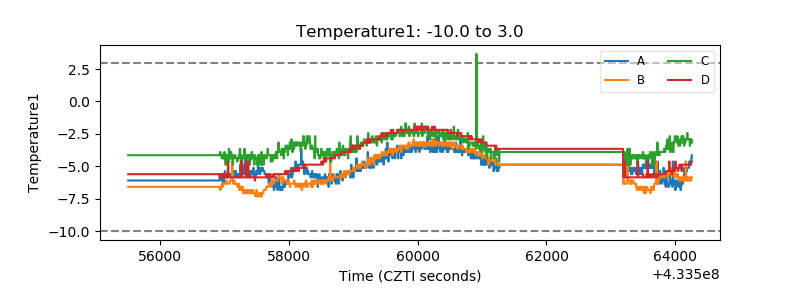 |
| Veto HV Monitor | 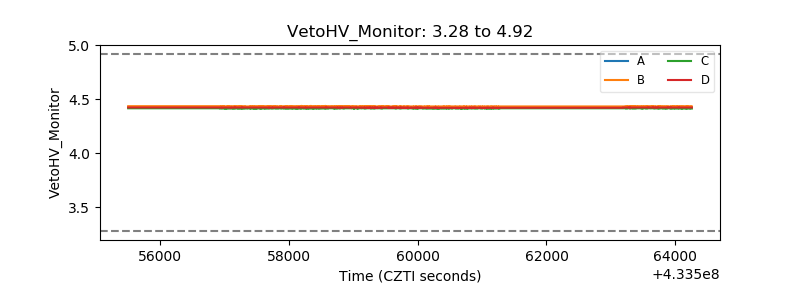 |
| Veto LLD | 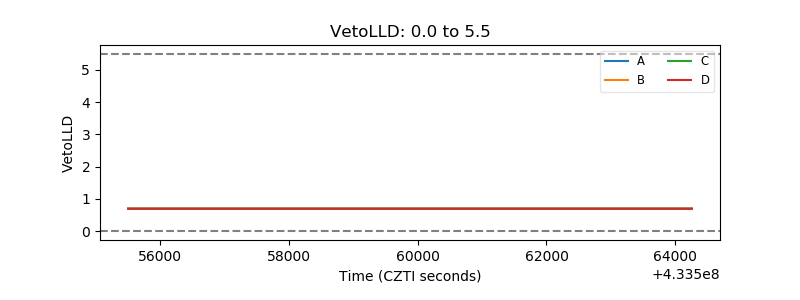 |
| Alpha Counter | 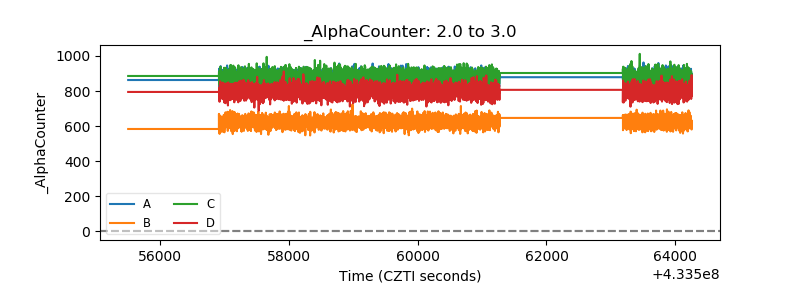 |
| _CPM_Rate | 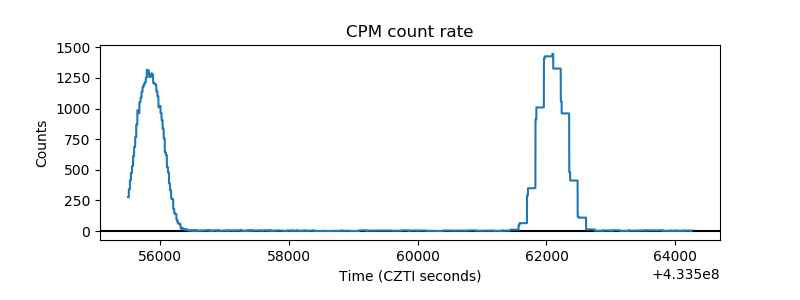 |
| CZT Counter | 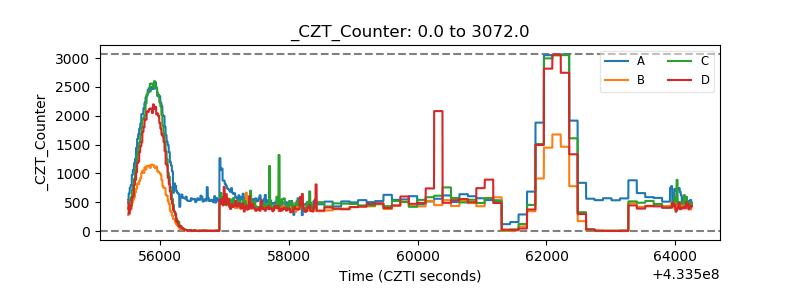 |
| +2.5 Volts monitor | 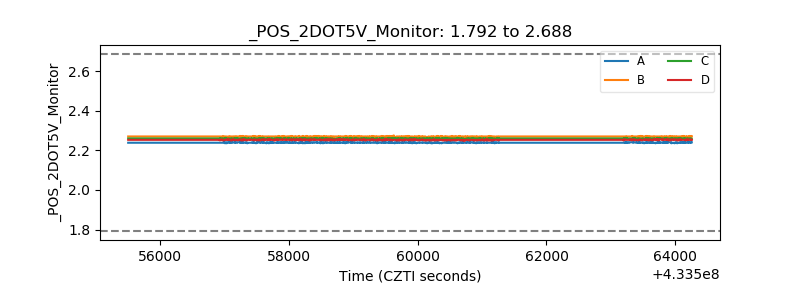 |
| +5 Volts monitor | 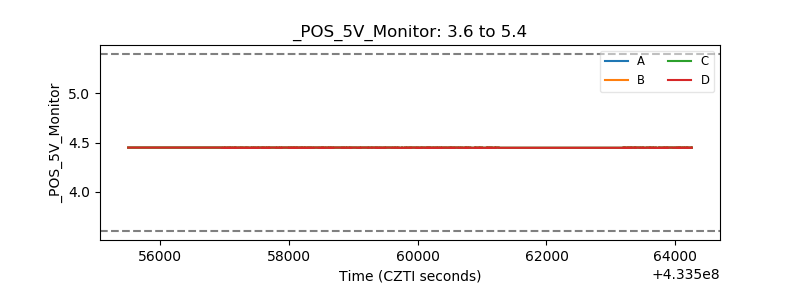 |
| _ROLL_ROT | 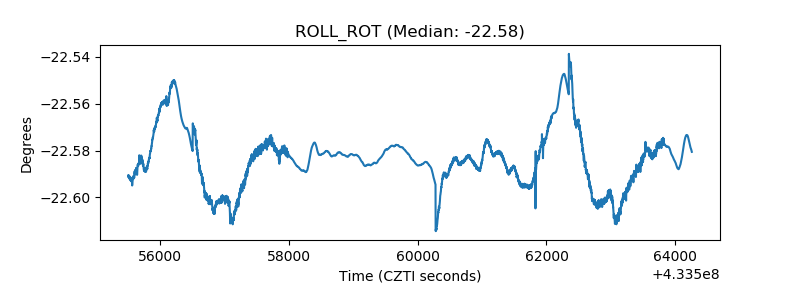 |
| _Roll_DEC |  |
| _Roll_RA | 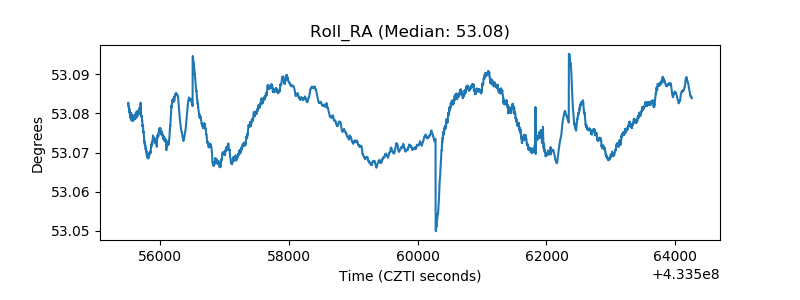 |
| Veto Counter | 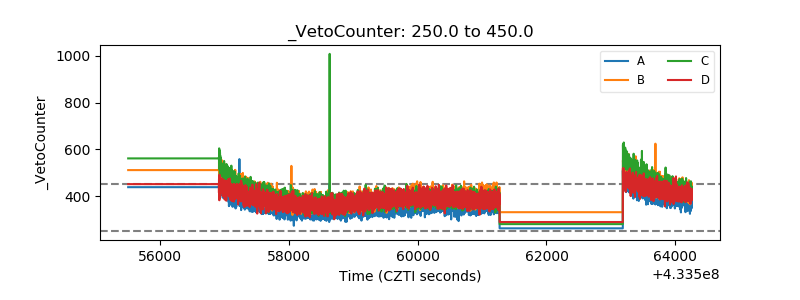 |