| Param | Original file | Final file |
|---|---|---|
| Filename | modeM0/AS1A06_006T01_9000005860_43256cztM0_level2.fits | modeM0/AS1A06_006T01_9000005860_43256cztM0_level2_quad_clean.evt |
| Size (bytes) | 305,009,280 | 88,784,640 |
| Size | 290.9 MB | 84.7 MB |
| Events in quadrant A | 2,990,020 | 590,847 |
| Events in quadrant B | 2,316,432 | 624,166 |
| Events in quadrant C | 2,515,554 | 592,946 |
| Events in quadrant D | 3,074,649 | 526,391 |
| Mode SS | |||
|---|---|---|---|
| Quadrant | BADHDUFLAG | Total packets | Discarded packets |
| A | 0 | 104 | 0 |
| B | 0 | 104 | 0 |
| C | 0 | 104 | 0 |
| D | 0 | 104 | 0 |
| Mode M9 | |||
|---|---|---|---|
| Quadrant | BADHDUFLAG | Total packets | Discarded packets |
| A | 0 | 31 | 0 |
| B | 0 | 32 | 0 |
| C | 0 | 32 | 0 |
| D | 0 | 32 | 0 |
| Mode M0 | |||
|---|---|---|---|
| Quadrant | BADHDUFLAG | Total packets | Discarded packets |
| A | 0 | 11921 | 2 |
| B | 0 | 10192 | 2 |
| C | 0 | 10327 | 2 |
| D | 0 | 12505 | 2 |
| Quadrant | Total seconds | Saturated seconds | Saturation percentage |
|---|---|---|---|
| A | 5050 | 17 | 0.336634% |
| B | 5050 | 4 | 0.079208% |
| C | 5050 | 4 | 0.079208% |
| D | 5050 | 201 | 3.980198% |
Noise dominated data is calculated using 1-second bins in cleaned event files. If a bin has >2000 counts, and if more than 50% of those come from <1% of pixels, then it is considered to be noise-dominated and hence unusable.
| Quadrant | # 1 sec bins | Bins with >0 counts | Bins with >2000 counts | High rate bins dominated by noise | Noise dominated (total time) | Noise dominated (detector-on time) | Marked lightcurve |
|---|---|---|---|---|---|---|---|
| A | 7082 | 5051 | 6 | 6 | 0.08% | 0.12% | 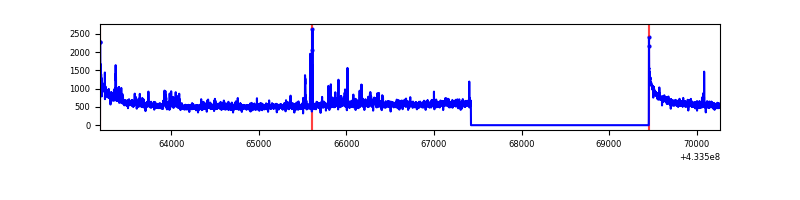 |
| B | 7082 | 5051 | 0 | 0 | 0.00% | 0.00% | 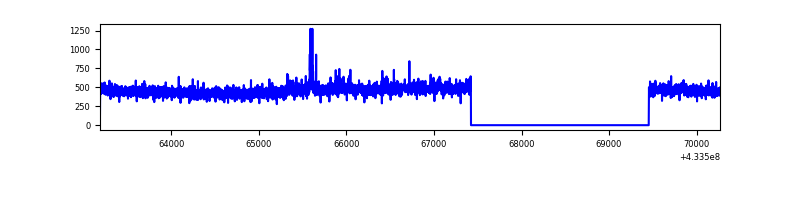 |
| C | 7082 | 5051 | 1 | 1 | 0.01% | 0.02% | 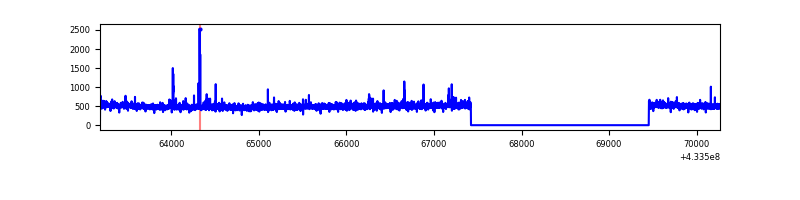 |
| D | 7082 | 5051 | 154 | 154 | 2.17% | 3.05% | 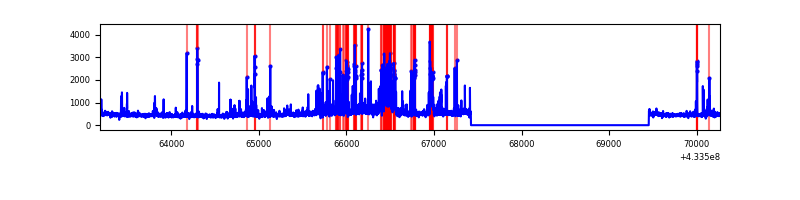 |
Top three noisy pixels from each quadrant. If the there are fewer than three noisy pixels in the level2.evt file, extra rows are filled as -1
| Pixel properties | Quadrant properties | ||||||
|---|---|---|---|---|---|---|---|
| Quadrant | DetID | PixID | Counts | Sigma | Mean | Median | Sigma |
| A | 10 | 83 | 564441 | 4740.65 | 578 | 567 | 118.9 |
| A | 12 | 189 | 132027 | 1105.22 | 578 | 567 | 118.9 |
| A | 15 | 237 | 30328 | 250.21 | 578 | 567 | 118.9 |
| B | 5 | 255 | 44044 | 389.45 | 575 | 560 | 111.7 |
| B | 12 | 111 | 14042 | 120.75 | 575 | 560 | 111.7 |
| B | 11 | 111 | 12807 | 109.69 | 575 | 560 | 111.7 |
| C | 15 | 214 | 213973 | 1582.35 | 573 | 578 | 134.9 |
| C | 0 | 207 | 22875 | 165.33 | 573 | 578 | 134.9 |
| C | 0 | 239 | 14336 | 102.02 | 573 | 578 | 134.9 |
| D | 1 | 52 | 237618 | 1715.18 | 563 | 548 | 138.2 |
| D | 13 | 249 | 231314 | 1669.57 | 563 | 548 | 138.2 |
| D | 2 | 249 | 202118 | 1458.34 | 563 | 548 | 138.2 |
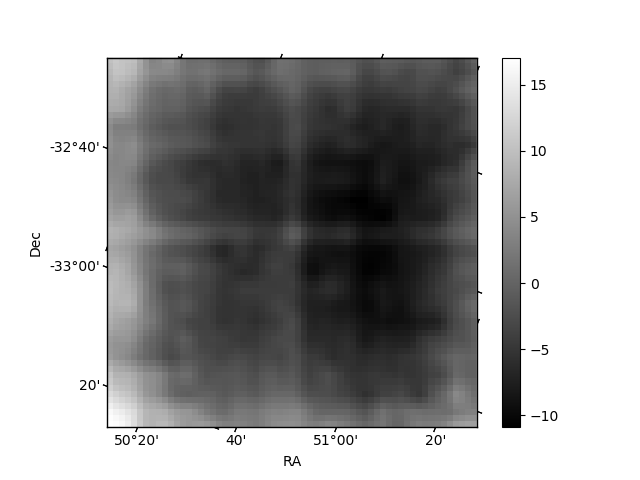
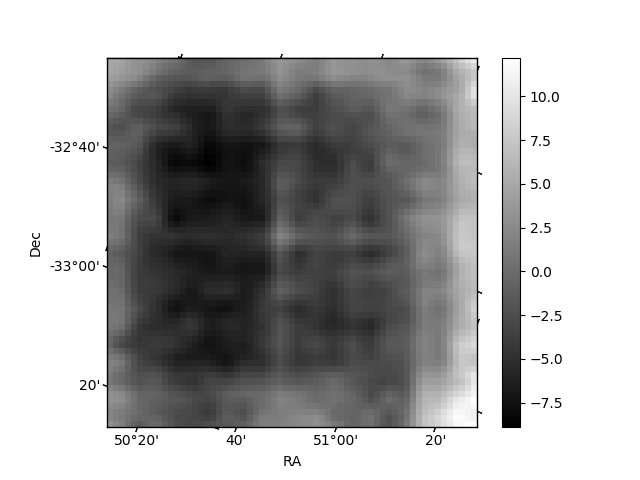
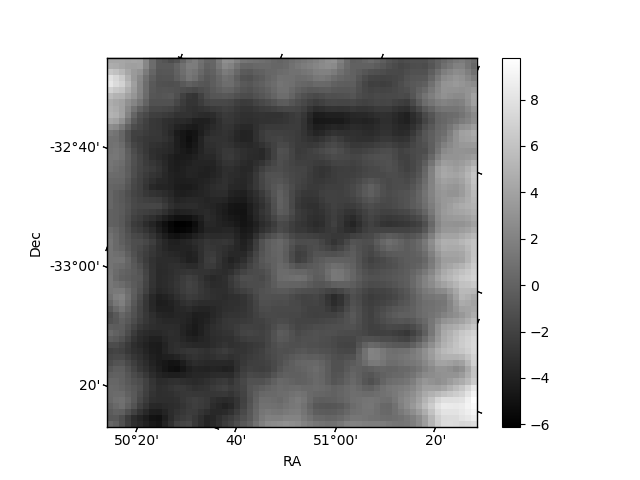
Histogram calculated using DETX and DETY for each event in the final _common_clean file
| Quadrant A | 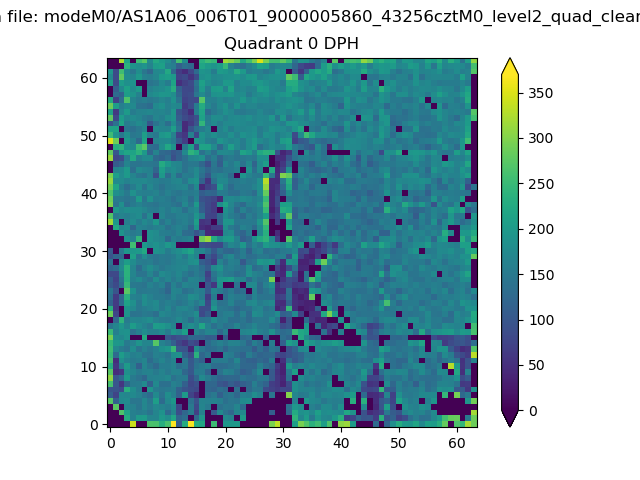 |
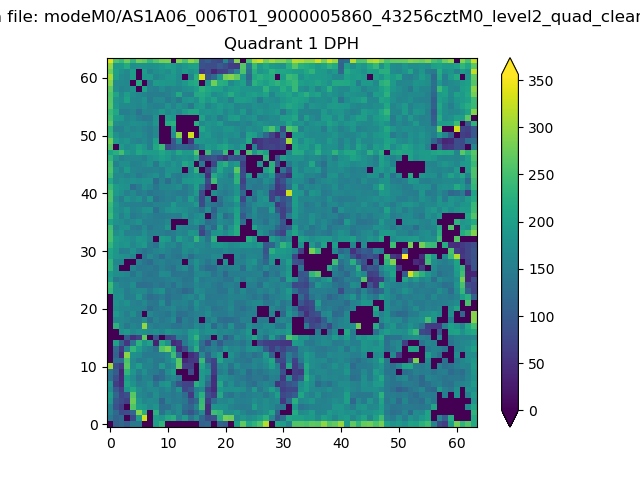 |
Quadrant B |
|---|---|---|---|
| Quadrant D | 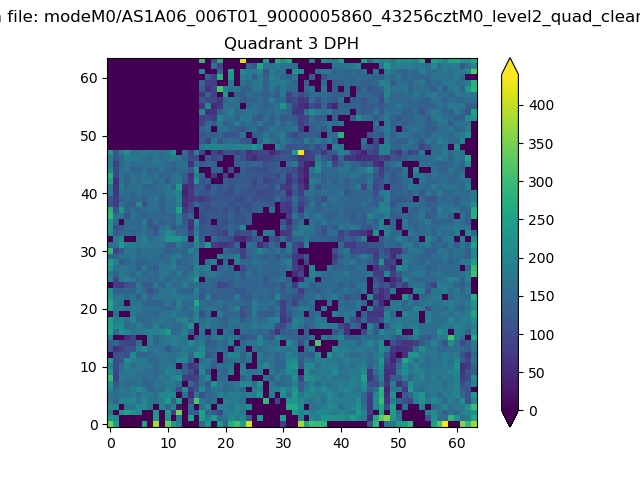 |
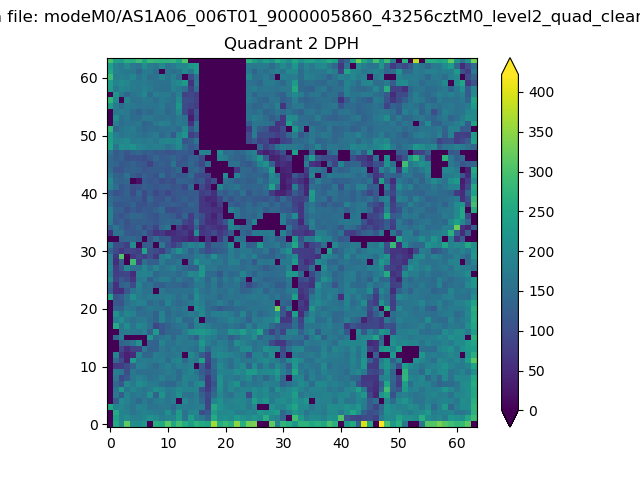 |
Quadrant C |
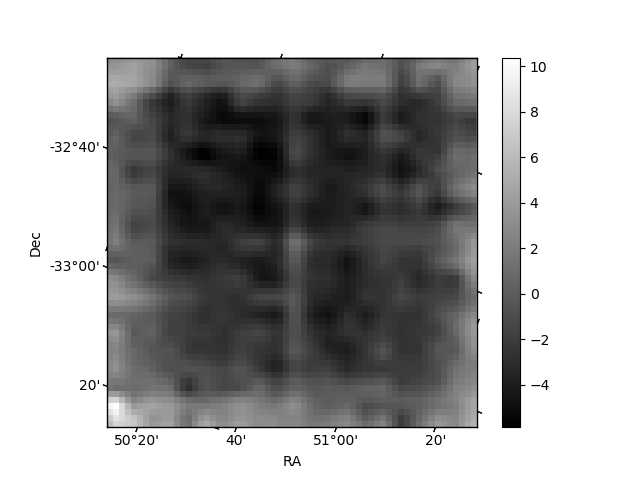
| Plot type | Count rate plots | Images |
|---|---|---|
| Comparison with Poisson distribution Blue bars denote a histogram of data divided into 1 sec bins. Red curve is a Poisson curve with rate = median count rate of data. |
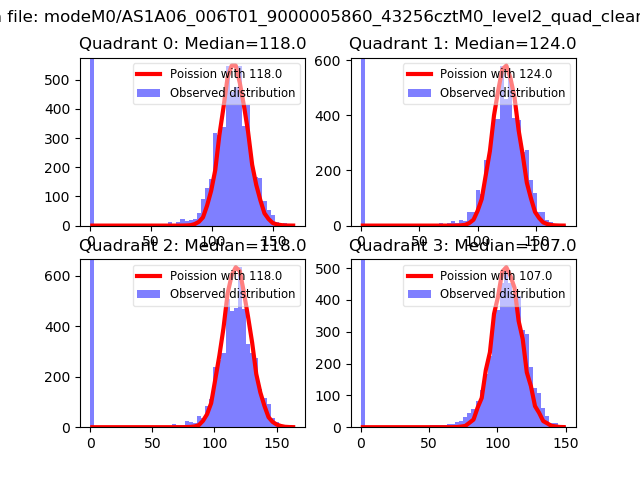 |
 |
| Quadrant-wise count rates Data is divided into 100 sec bins |
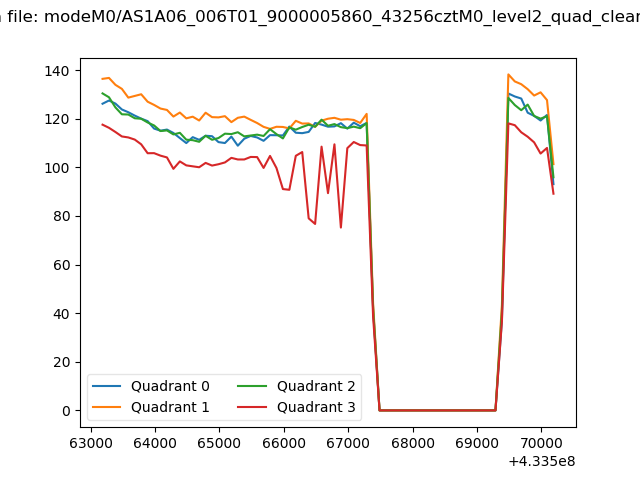 |
|
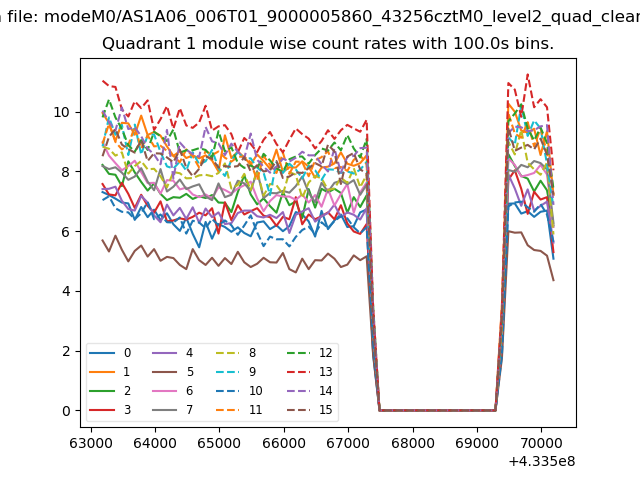
| Module-wise count rates for Quadrant A Data is divided into 100 sec bins |
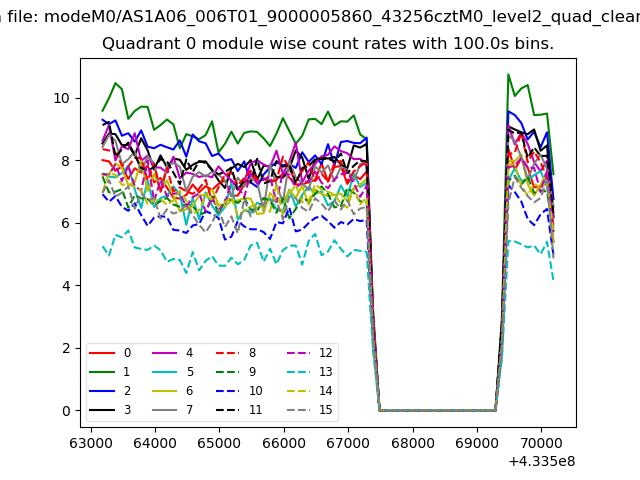 |
 |
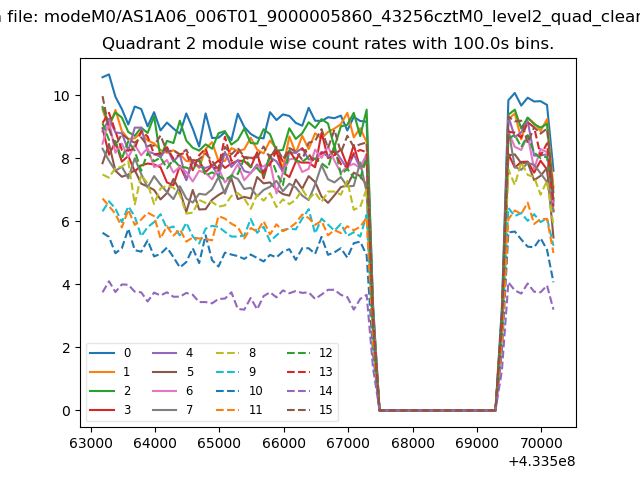
| Module-wise count rates for Quadrant B Data is divided into 100 sec bins |
 |
 |
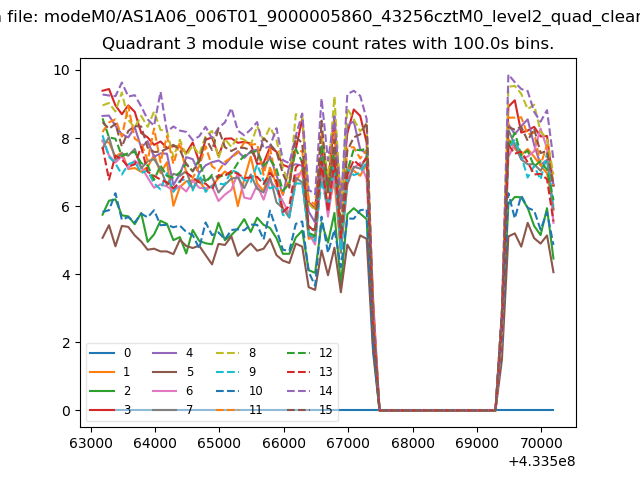
| Module-wise count rates for Quadrant C Data is divided into 100 sec bins |
 |
 |
| Module-wise count rates for Quadrant D Data is divided into 100 sec bins |
 |
 |
| Parameter | Plot |
|---|---|
| CZT HV Monitor | 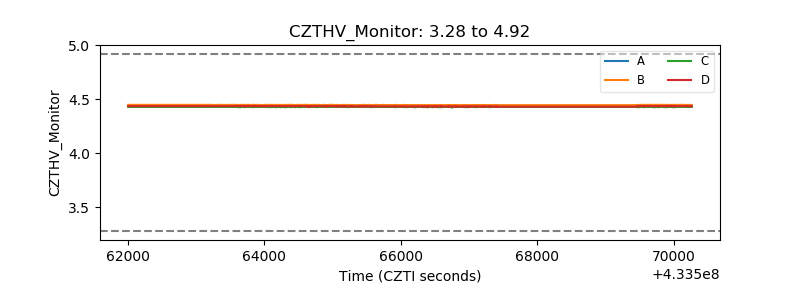 |
| D_VDD | 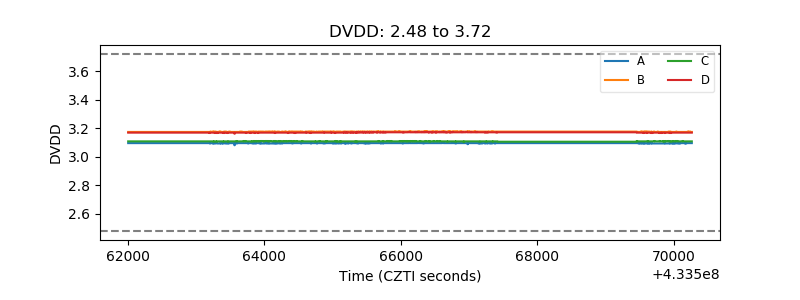 |
| Temperature 1 | 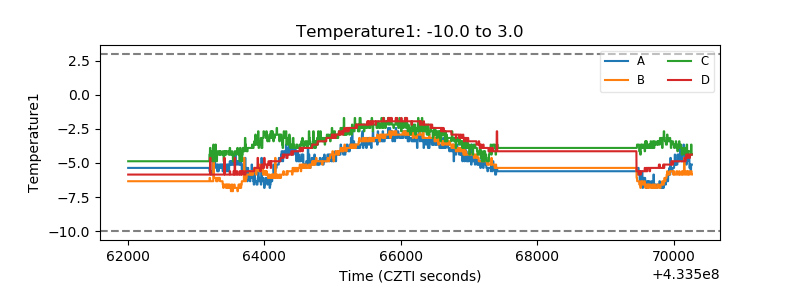 |
| Veto HV Monitor | 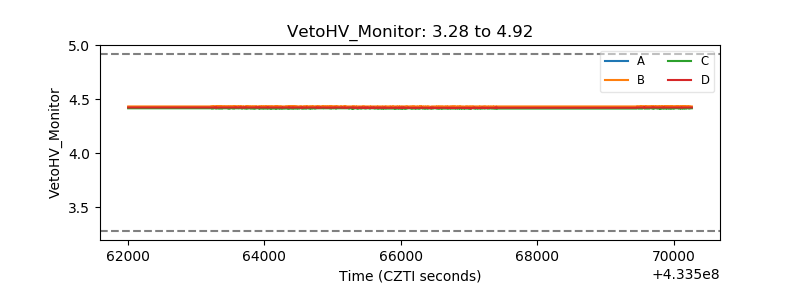 |
| Veto LLD | 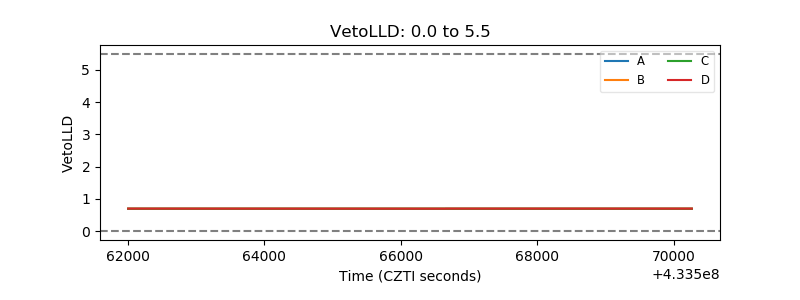 |
| Alpha Counter | 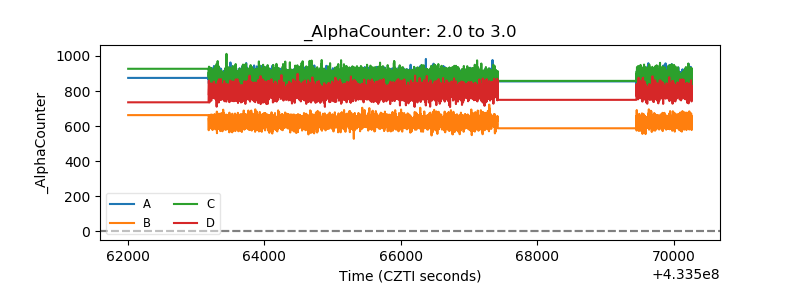 |
| _CPM_Rate | 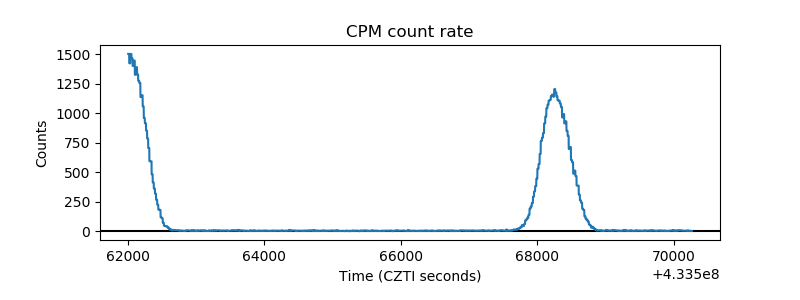 |
| CZT Counter | 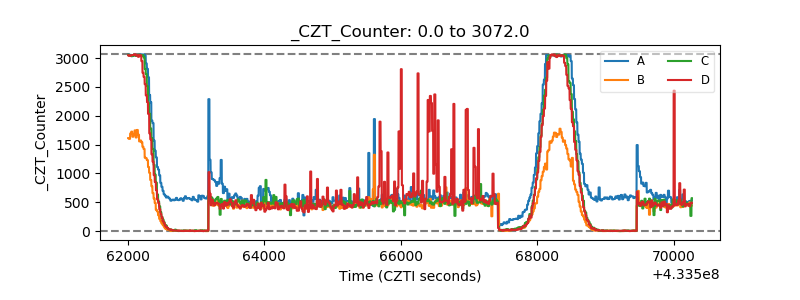 |
| +2.5 Volts monitor | 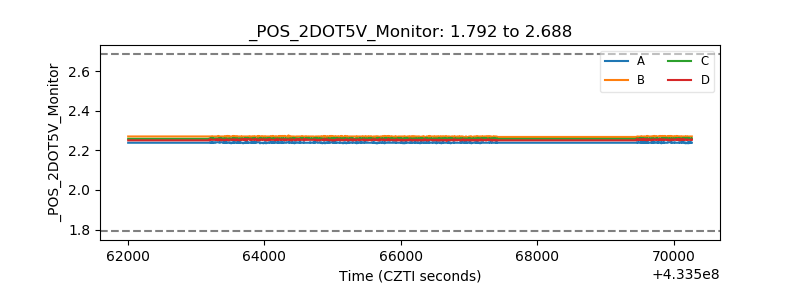 |
| +5 Volts monitor | 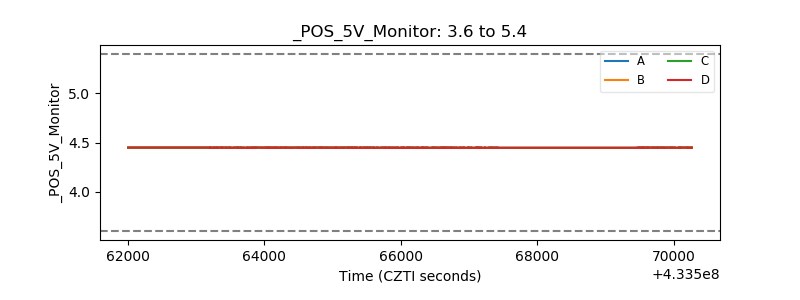 |
| _ROLL_ROT | 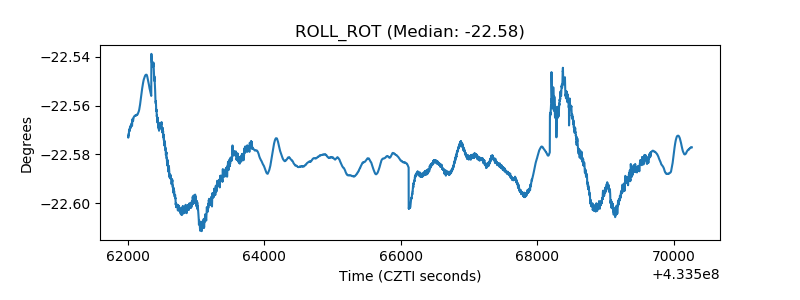 |
| _Roll_DEC | 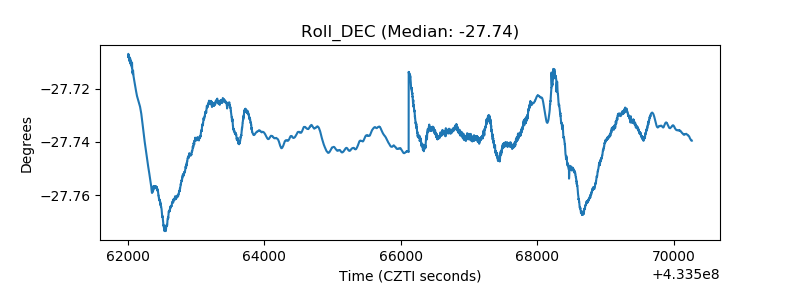 |
| _Roll_RA |  |
| Veto Counter | 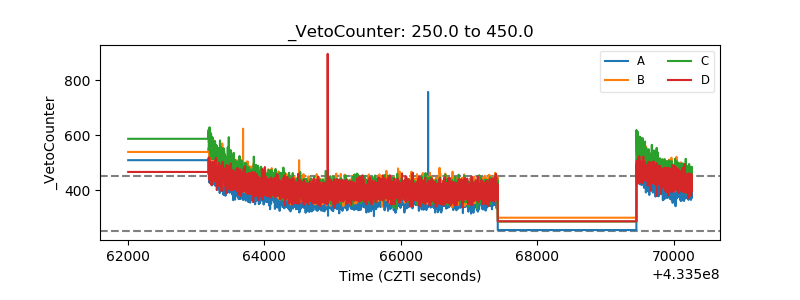 |