| Param | Original file | Final file |
|---|---|---|
| Filename | modeM0/AS1A06_006T01_9000005860_43257cztM0_level2.fits | modeM0/AS1A06_006T01_9000005860_43257cztM0_level2_quad_clean.evt |
| Size (bytes) | 296,271,360 | 85,962,240 |
| Size | 282.5 MB | 82.0 MB |
| Events in quadrant A | 2,984,516 | 567,221 |
| Events in quadrant B | 2,206,189 | 602,126 |
| Events in quadrant C | 2,419,380 | 574,268 |
| Events in quadrant D | 2,975,163 | 516,398 |
| Mode SS | |||
|---|---|---|---|
| Quadrant | BADHDUFLAG | Total packets | Discarded packets |
| A | 0 | 98 | 0 |
| B | 0 | 98 | 0 |
| C | 0 | 98 | 0 |
| D | 0 | 98 | 0 |
| Mode M9 | |||
|---|---|---|---|
| Quadrant | BADHDUFLAG | Total packets | Discarded packets |
| A | 0 | 32 | 0 |
| B | 0 | 33 | 0 |
| C | 0 | 33 | 0 |
| D | 0 | 33 | 0 |
| Mode M0 | |||
|---|---|---|---|
| Quadrant | BADHDUFLAG | Total packets | Discarded packets |
| A | 0 | 11726 | 2 |
| B | 0 | 9809 | 2 |
| C | 0 | 9926 | 2 |
| D | 0 | 12007 | 2 |
| Quadrant | Total seconds | Saturated seconds | Saturation percentage |
|---|---|---|---|
| A | 4895 | 73 | 1.491318% |
| B | 4895 | 6 | 0.122574% |
| C | 4895 | 9 | 0.183861% |
| D | 4895 | 130 | 2.655771% |
Noise dominated data is calculated using 1-second bins in cleaned event files. If a bin has >2000 counts, and if more than 50% of those come from <1% of pixels, then it is considered to be noise-dominated and hence unusable.
| Quadrant | # 1 sec bins | Bins with >0 counts | Bins with >2000 counts | High rate bins dominated by noise | Noise dominated (total time) | Noise dominated (detector-on time) | Marked lightcurve |
|---|---|---|---|---|---|---|---|
| A | 7018 | 4896 | 62 | 62 | 0.88% | 1.27% | 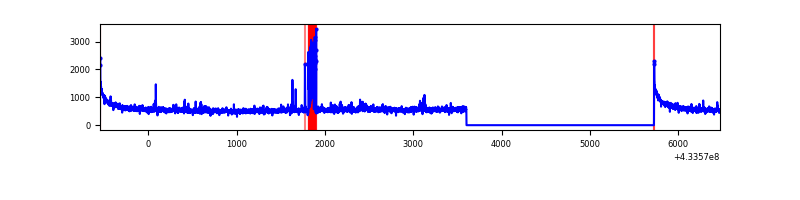 |
| B | 7018 | 4896 | 0 | 0 | 0.00% | 0.00% | 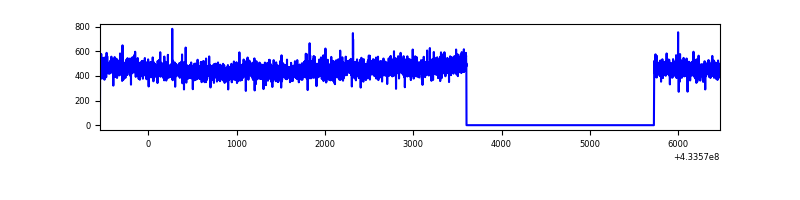 |
| C | 7018 | 4896 | 4 | 4 | 0.06% | 0.08% | 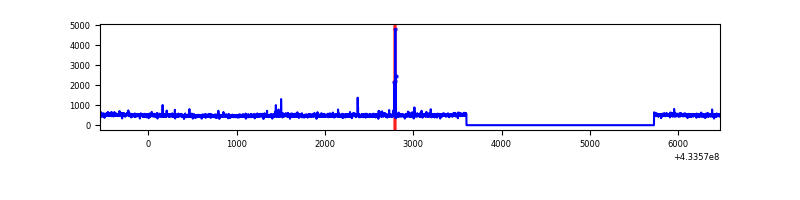 |
| D | 7018 | 4896 | 113 | 113 | 1.61% | 2.31% | 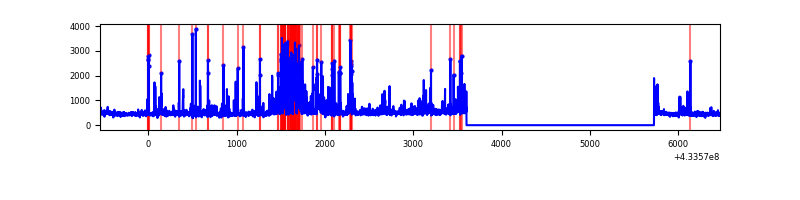 |
Top three noisy pixels from each quadrant. If the there are fewer than three noisy pixels in the level2.evt file, extra rows are filled as -1
| Pixel properties | Quadrant properties | ||||||
|---|---|---|---|---|---|---|---|
| Quadrant | DetID | PixID | Counts | Sigma | Mean | Median | Sigma |
| A | 10 | 83 | 537416 | 4682.81 | 559 | 546 | 114.6 |
| A | 15 | 237 | 168105 | 1461.52 | 559 | 546 | 114.6 |
| A | 12 | 189 | 76460 | 662.15 | 559 | 546 | 114.6 |
| B | 0 | 189 | 14675 | 129.99 | 558 | 541 | 108.7 |
| B | 12 | 111 | 13262 | 116.99 | 558 | 541 | 108.7 |
| B | 11 | 111 | 12759 | 112.36 | 558 | 541 | 108.7 |
| C | 15 | 214 | 210072 | 1598.98 | 556 | 562 | 131.0 |
| C | 0 | 207 | 26436 | 197.47 | 556 | 562 | 131.0 |
| C | 3 | 233 | 10291 | 74.25 | 556 | 562 | 131.0 |
| D | 2 | 249 | 252440 | 1883.23 | 551 | 537 | 133.8 |
| D | 12 | 233 | 215624 | 1607.99 | 551 | 537 | 133.8 |
| D | 1 | 52 | 127064 | 945.92 | 551 | 537 | 133.8 |
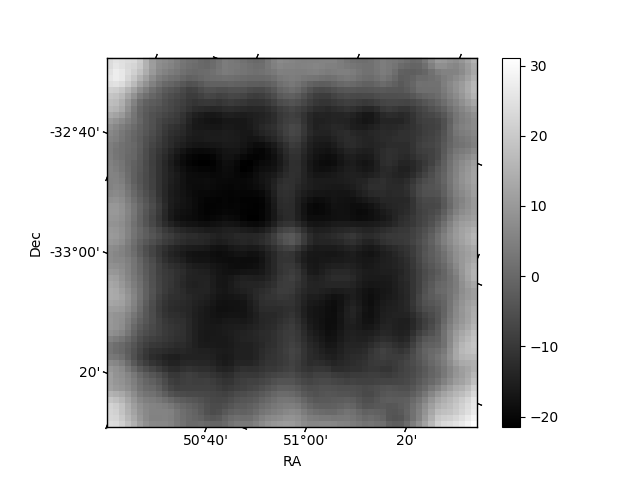
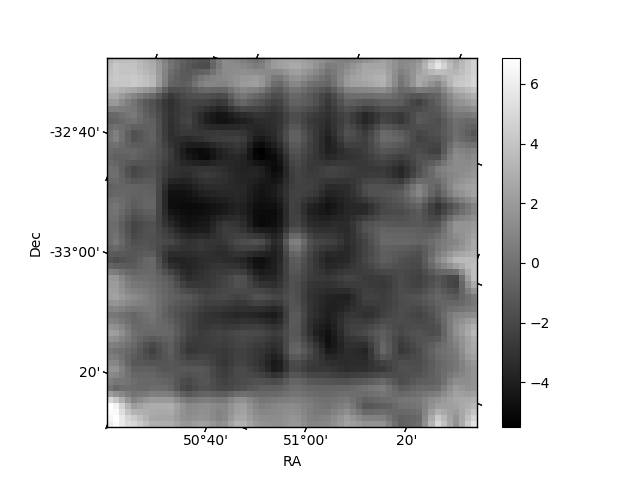
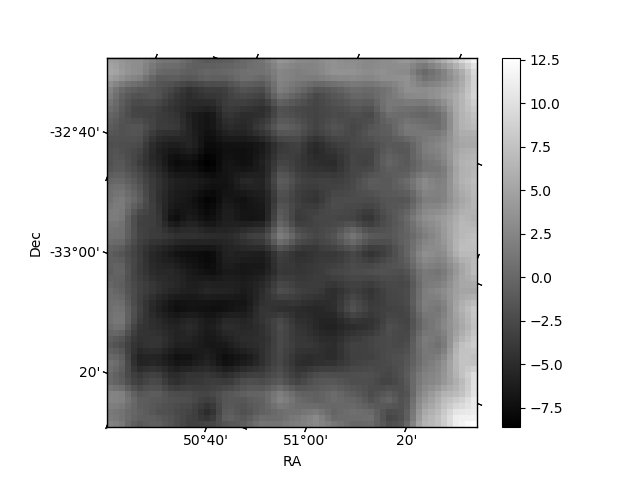
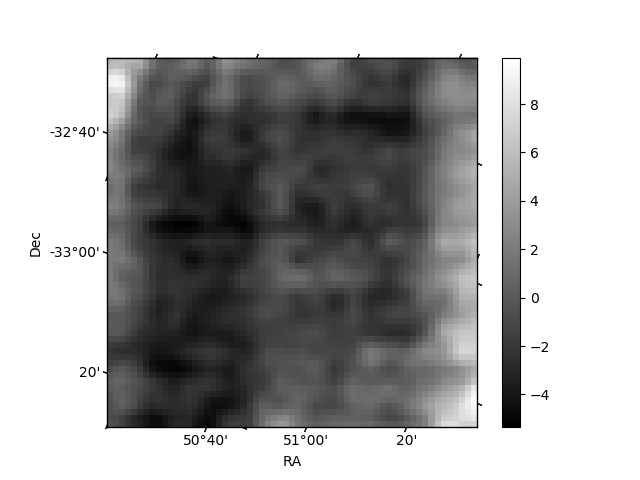
Histogram calculated using DETX and DETY for each event in the final _common_clean file
| Quadrant A | 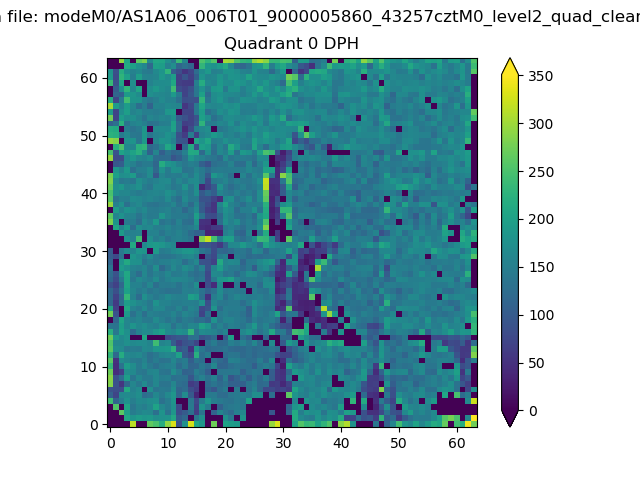 |
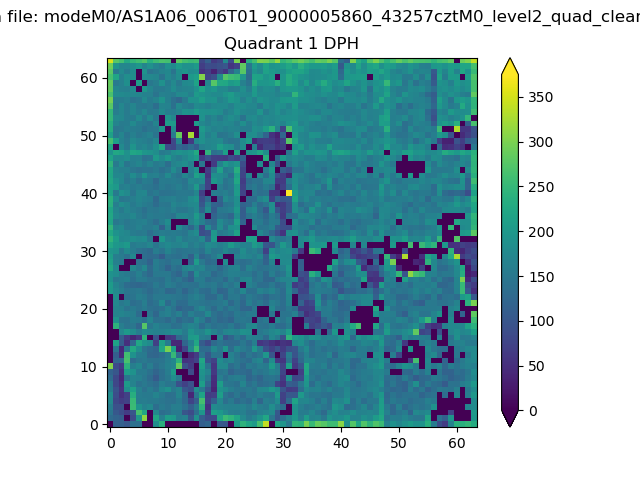 |
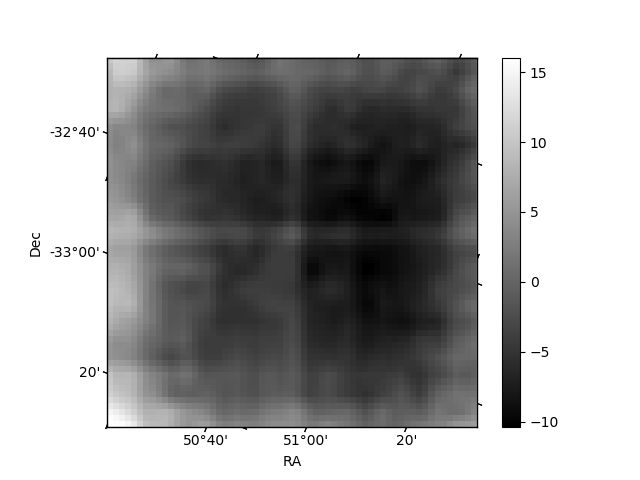
Quadrant B |
|---|---|---|---|
| Quadrant D | 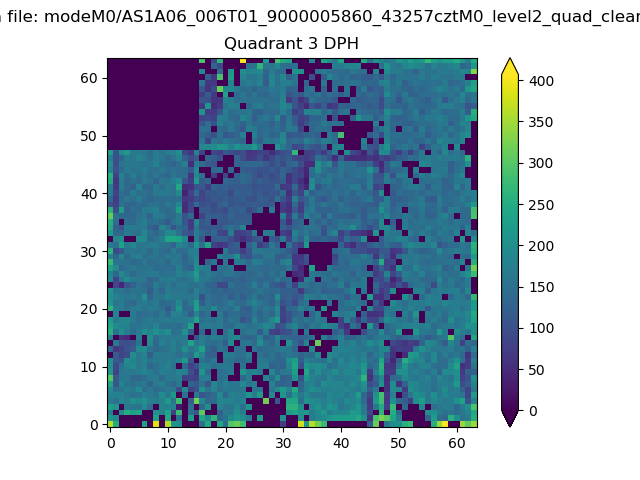 |
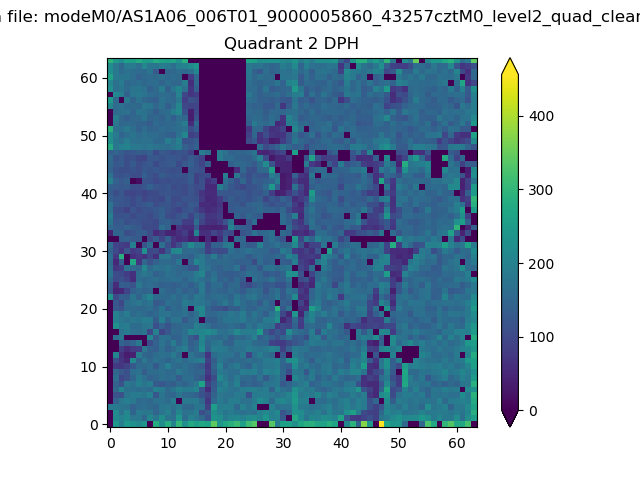 |
Quadrant C |
| Plot type | Count rate plots | Images |
|---|---|---|
| Comparison with Poisson distribution Blue bars denote a histogram of data divided into 1 sec bins. Red curve is a Poisson curve with rate = median count rate of data. |
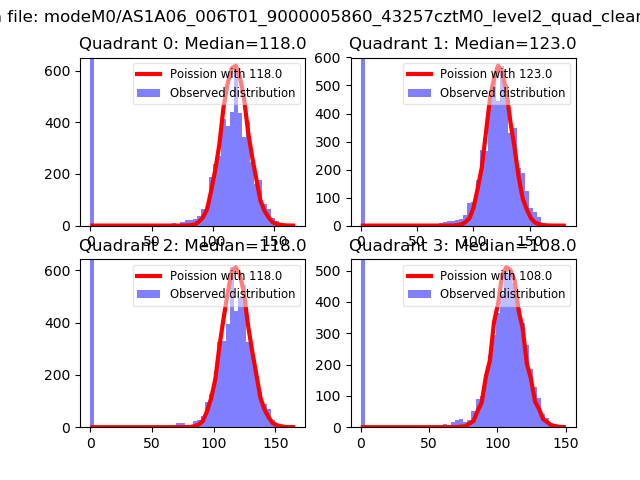 |
 |
| Quadrant-wise count rates Data is divided into 100 sec bins |
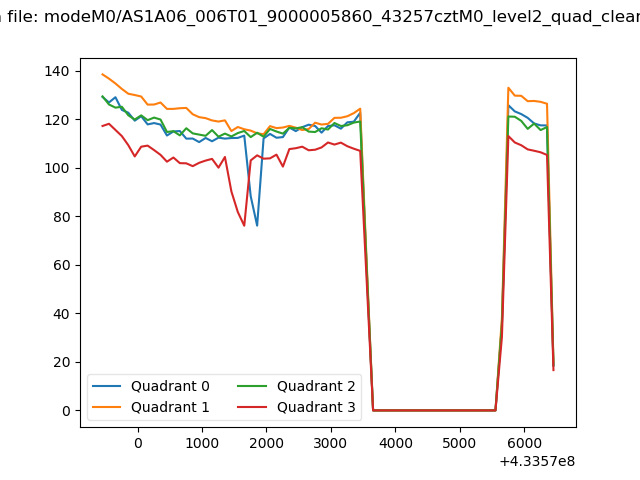 |
|
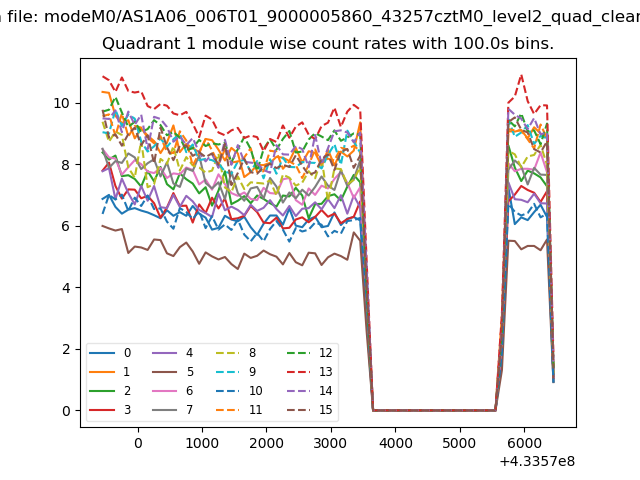
| Module-wise count rates for Quadrant A Data is divided into 100 sec bins |
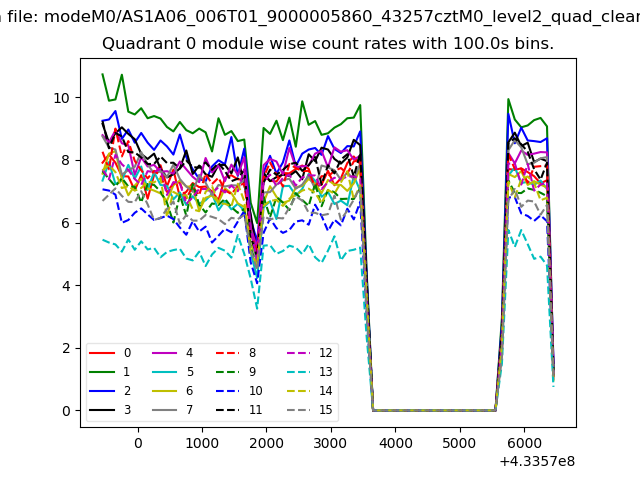 |
 |
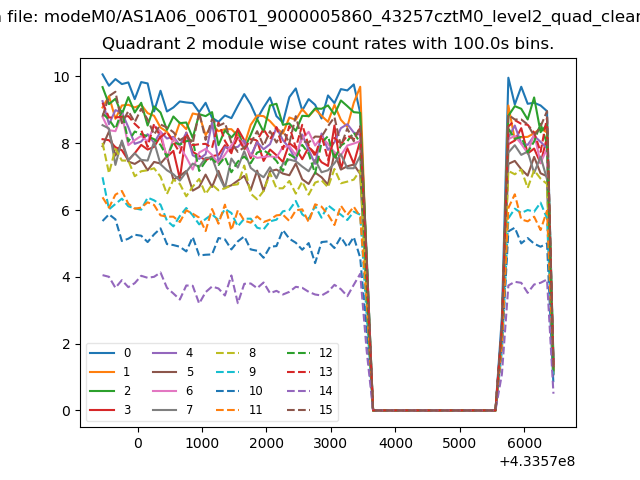
| Module-wise count rates for Quadrant B Data is divided into 100 sec bins |
 |
 |
| Module-wise count rates for Quadrant C Data is divided into 100 sec bins |
 |
 |
| Module-wise count rates for Quadrant D Data is divided into 100 sec bins |
 |
 |
| Parameter | Plot |
|---|---|
| CZT HV Monitor | 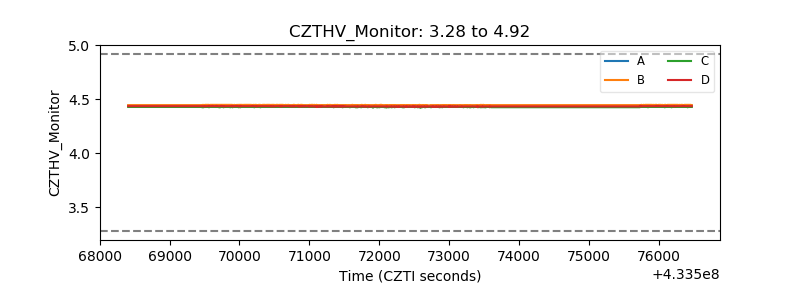 |
| D_VDD | 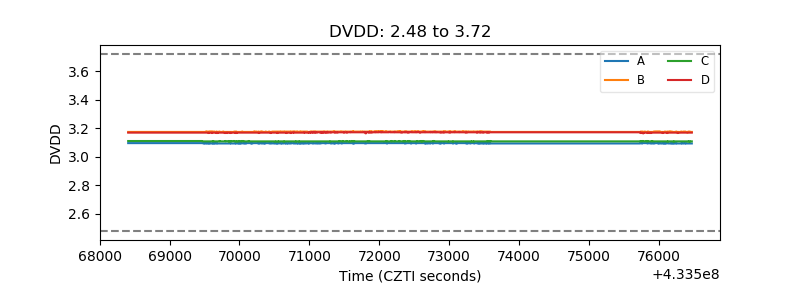 |
| Temperature 1 | 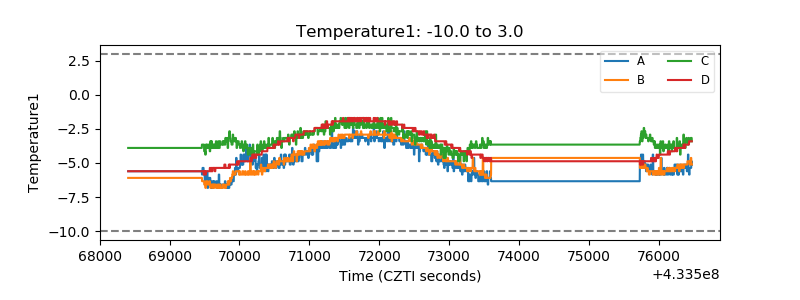 |
| Veto HV Monitor | 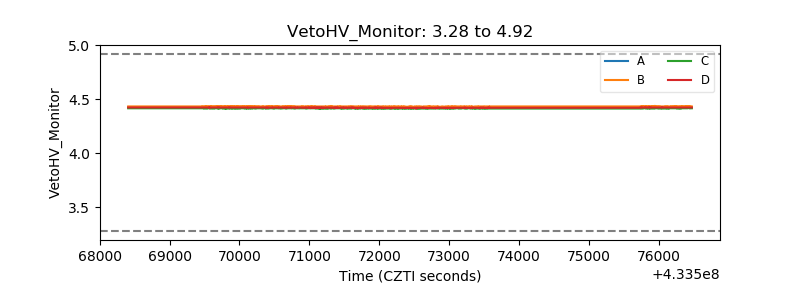 |
| Veto LLD | 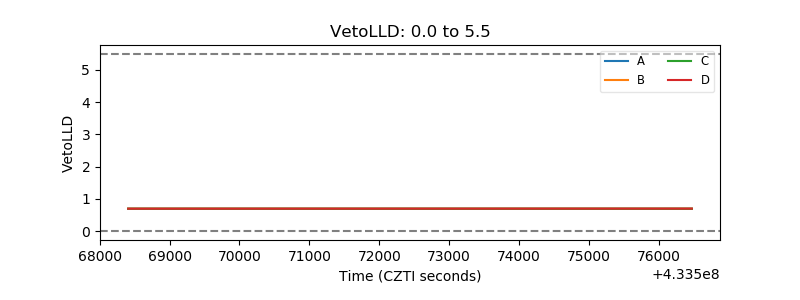 |
| Alpha Counter | 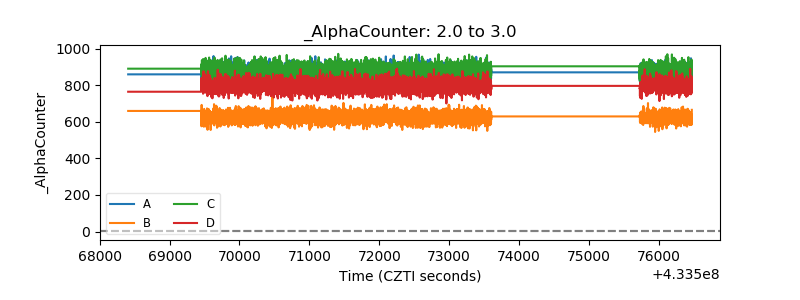 |
| _CPM_Rate | 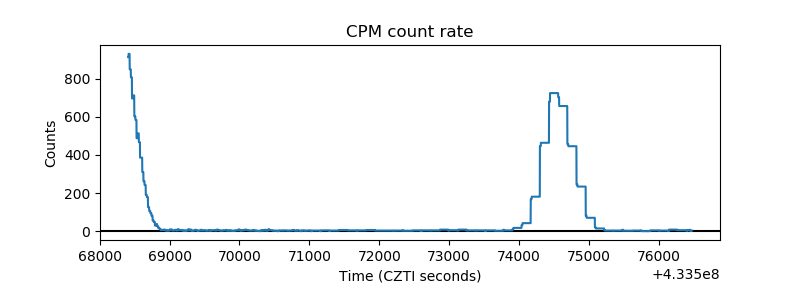 |
| CZT Counter | 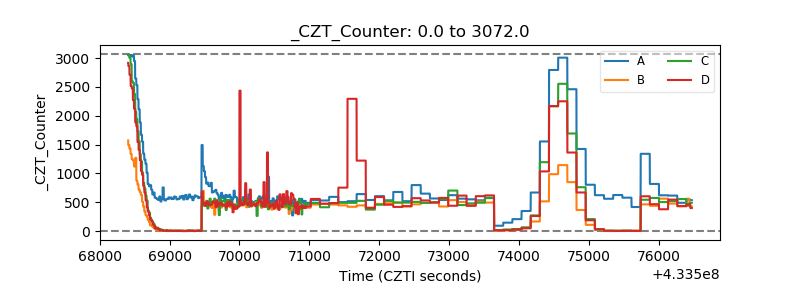 |
| +2.5 Volts monitor | 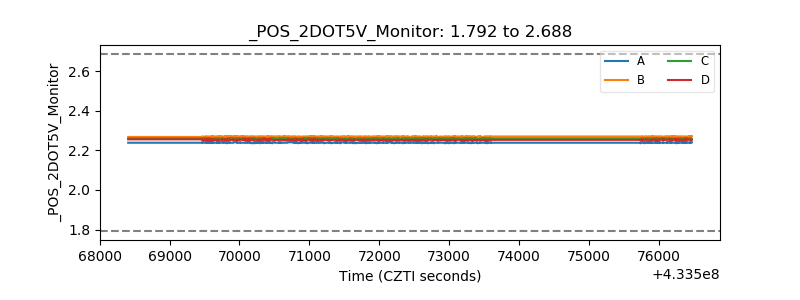 |
| +5 Volts monitor | 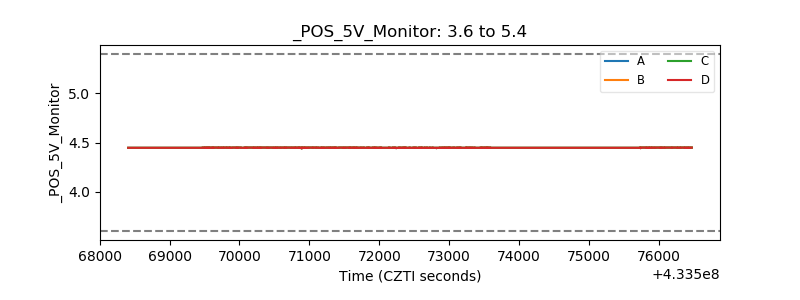 |
| _ROLL_ROT | 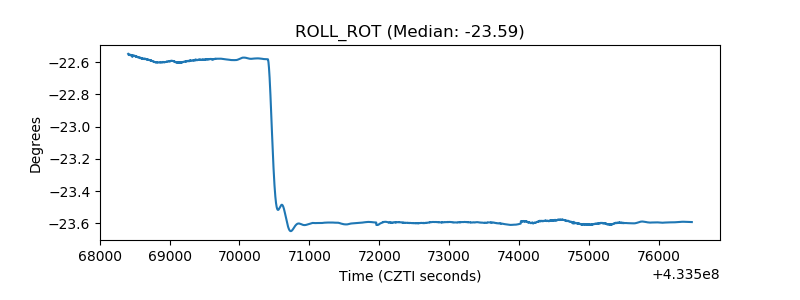 |
| _Roll_DEC | 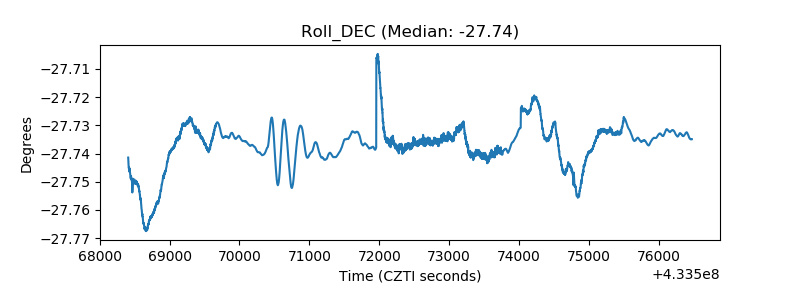 |
| _Roll_RA | 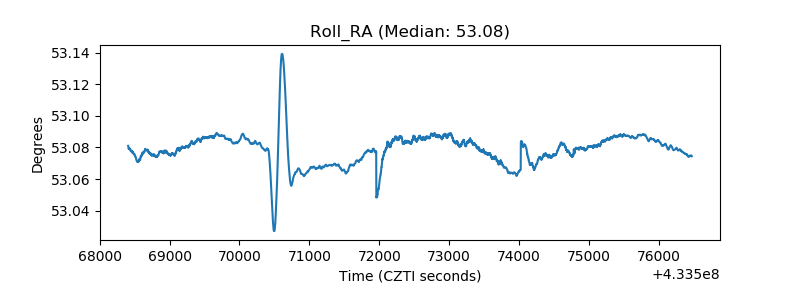 |
| Veto Counter | 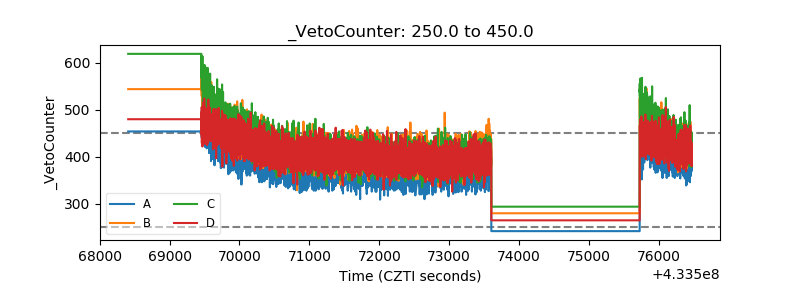 |