| Param | Original file | Final file |
|---|---|---|
| Filename | modeM0/AS1A06_006T01_9000005860_43262cztM0_level2.fits | modeM0/AS1A06_006T01_9000005860_43262cztM0_level2_quad_clean.evt |
| Size (bytes) | 394,453,440 | 95,270,400 |
| Size | 376.2 MB | 90.9 MB |
| Events in quadrant A | 3,808,451 | 624,136 |
| Events in quadrant B | 2,613,918 | 658,780 |
| Events in quadrant C | 3,454,864 | 624,175 |
| Events in quadrant D | 4,256,491 | 557,763 |
| Mode SS | |||
|---|---|---|---|
| Quadrant | BADHDUFLAG | Total packets | Discarded packets |
| A | 0 | 124 | 0 |
| B | 0 | 124 | 0 |
| C | 0 | 124 | 0 |
| D | 0 | 124 | 0 |
| Mode M9 | |||
|---|---|---|---|
| Quadrant | BADHDUFLAG | Total packets | Discarded packets |
| A | 0 | 26 | 0 |
| B | 0 | 27 | 0 |
| C | 0 | 27 | 0 |
| D | 0 | 27 | 0 |
| Mode M0 | |||
|---|---|---|---|
| Quadrant | BADHDUFLAG | Total packets | Discarded packets |
| A | 0 | 15026 | 2 |
| B | 0 | 12160 | 2 |
| C | 0 | 14042 | 2 |
| D | 0 | 16863 | 2 |
| Quadrant | Total seconds | Saturated seconds | Saturation percentage |
|---|---|---|---|
| A | 6008 | 188 | 3.129161% |
| B | 6007 | 13 | 0.216414% |
| C | 6007 | 150 | 2.497087% |
| D | 6007 | 395 | 6.575662% |
Noise dominated data is calculated using 1-second bins in cleaned event files. If a bin has >2000 counts, and if more than 50% of those come from <1% of pixels, then it is considered to be noise-dominated and hence unusable.
| Quadrant | # 1 sec bins | Bins with >0 counts | Bins with >2000 counts | High rate bins dominated by noise | Noise dominated (total time) | Noise dominated (detector-on time) | Marked lightcurve |
|---|---|---|---|---|---|---|---|
| A | 7321 | 6009 | 120 | 120 | 1.64% | 2.00% | 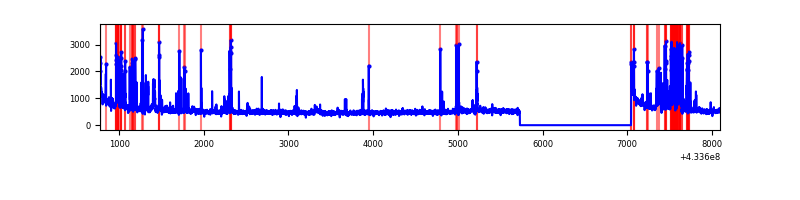 |
| B | 7320 | 6008 | 1 | 1 | 0.01% | 0.02% | 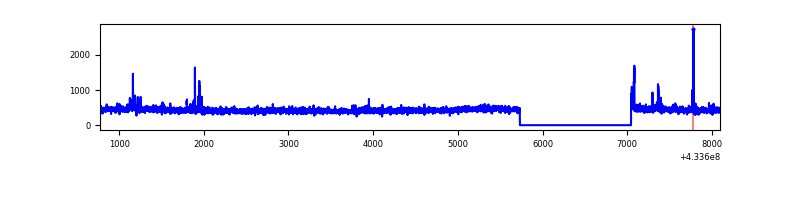 |
| C | 7320 | 6008 | 140 | 140 | 1.91% | 2.33% | 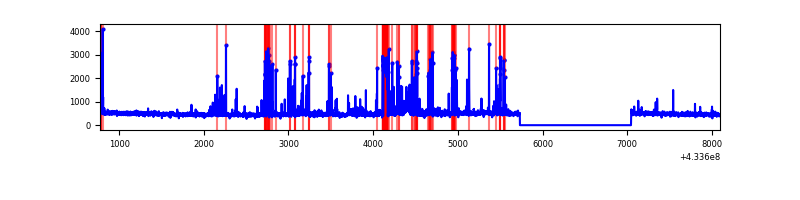 |
| D | 7320 | 6008 | 357 | 357 | 4.88% | 5.94% | 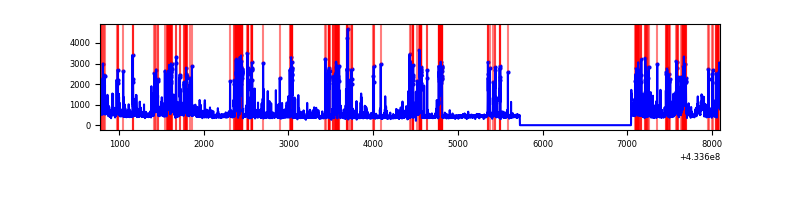 |
Top three noisy pixels from each quadrant. If the there are fewer than three noisy pixels in the level2.evt file, extra rows are filled as -1
| Pixel properties | Quadrant properties | ||||||
|---|---|---|---|---|---|---|---|
| Quadrant | DetID | PixID | Counts | Sigma | Mean | Median | Sigma |
| A | 10 | 83 | 639838 | 4832.82 | 642 | 631 | 132.3 |
| A | 15 | 237 | 568309 | 4292.02 | 642 | 631 | 132.3 |
| A | 13 | 248 | 93252 | 700.28 | 642 | 631 | 132.3 |
| B | 5 | 255 | 40593 | 313.44 | 647 | 628 | 127.5 |
| B | 12 | 111 | 16361 | 123.39 | 647 | 628 | 127.5 |
| B | 11 | 111 | 14917 | 112.07 | 647 | 628 | 127.5 |
| C | 14 | 254 | 706545 | 4720.18 | 632 | 635 | 149.6 |
| C | 15 | 214 | 262028 | 1747.85 | 632 | 635 | 149.6 |
| C | 3 | 233 | 8820 | 54.73 | 632 | 635 | 149.6 |
| D | 13 | 249 | 973202 | 6328.54 | 620 | 602 | 153.7 |
| D | 2 | 249 | 571446 | 3714.38 | 620 | 602 | 153.7 |
| D | 1 | 52 | 175089 | 1135.36 | 620 | 602 | 153.7 |
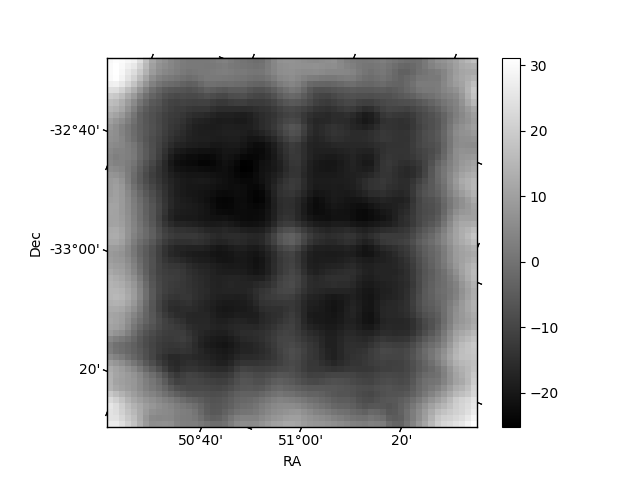
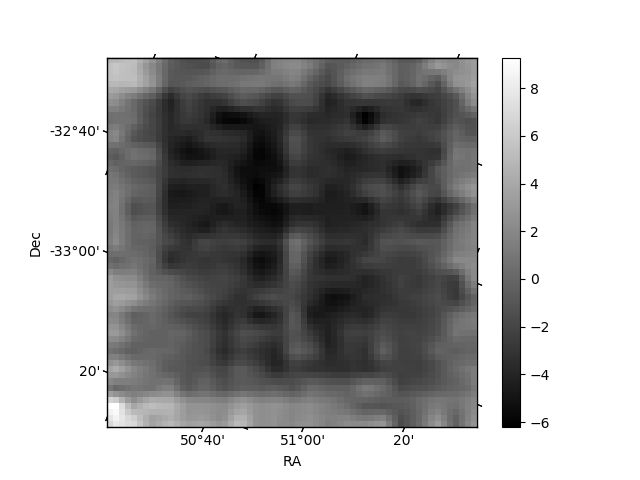
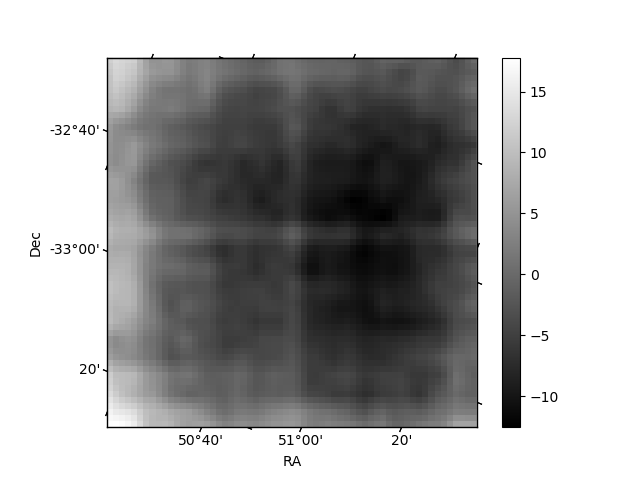
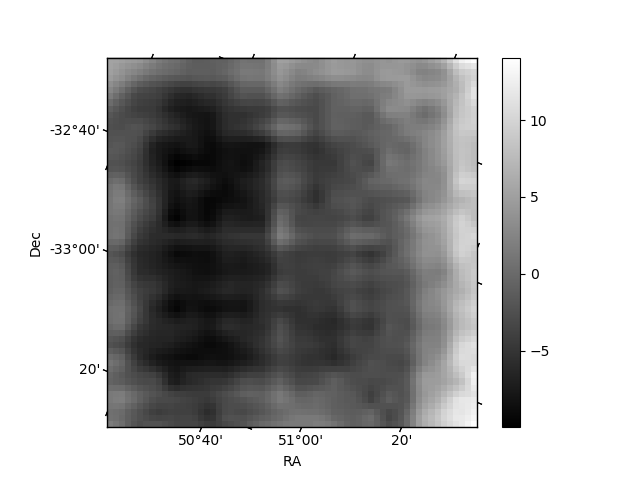
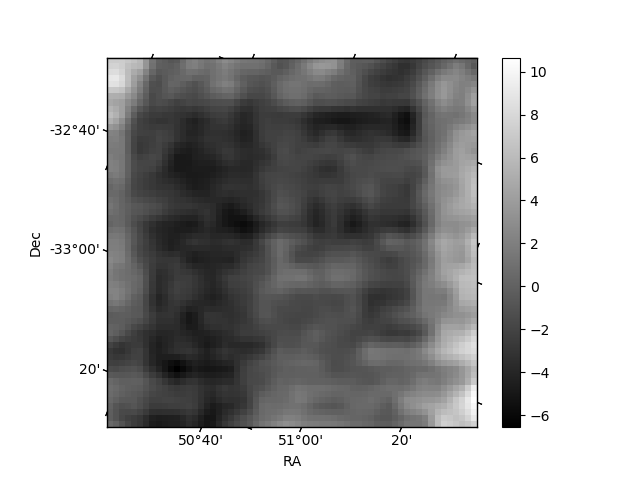
Histogram calculated using DETX and DETY for each event in the final _common_clean file
| Quadrant A | 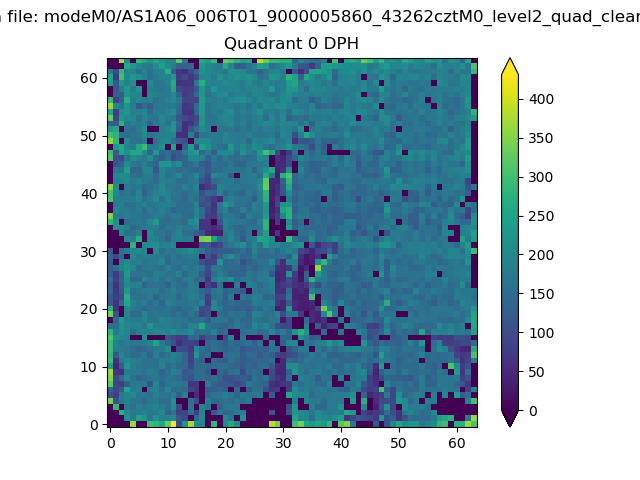 |
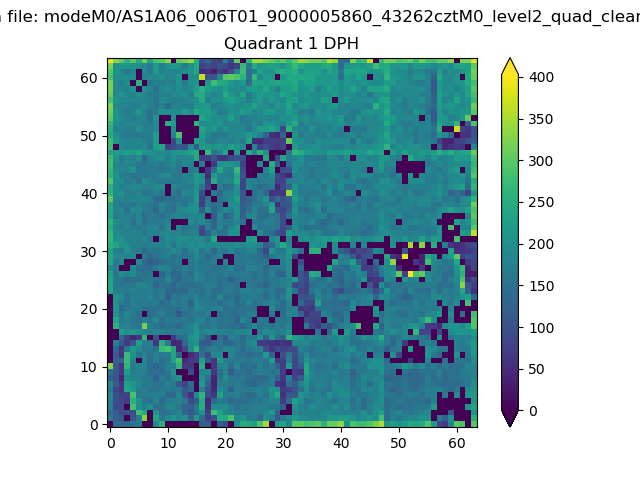 |
Quadrant B |
|---|---|---|---|
| Quadrant D | 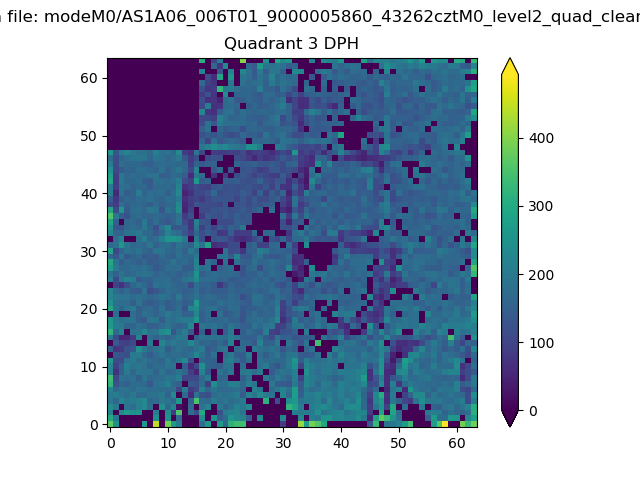 |
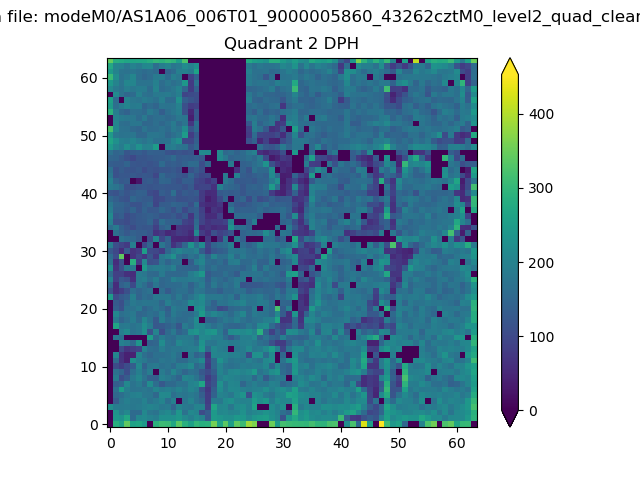 |
Quadrant C |
| Plot type | Count rate plots | Images |
|---|---|---|
| Comparison with Poisson distribution Blue bars denote a histogram of data divided into 1 sec bins. Red curve is a Poisson curve with rate = median count rate of data. |
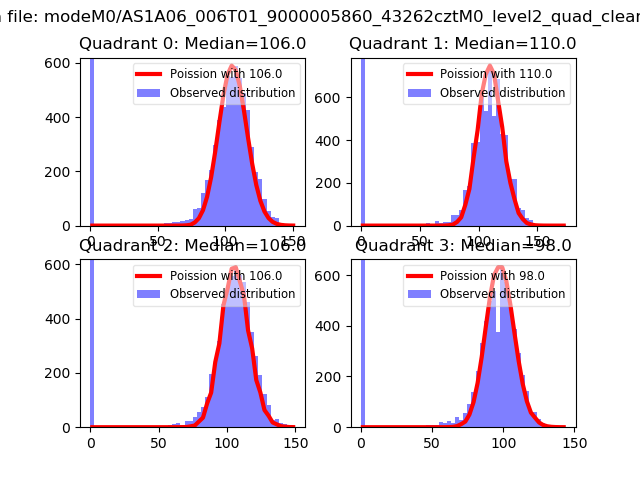 |
 |
| Quadrant-wise count rates Data is divided into 100 sec bins |
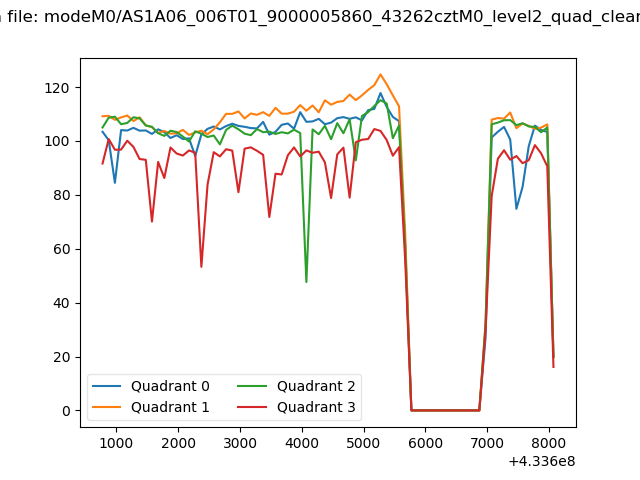 |
|
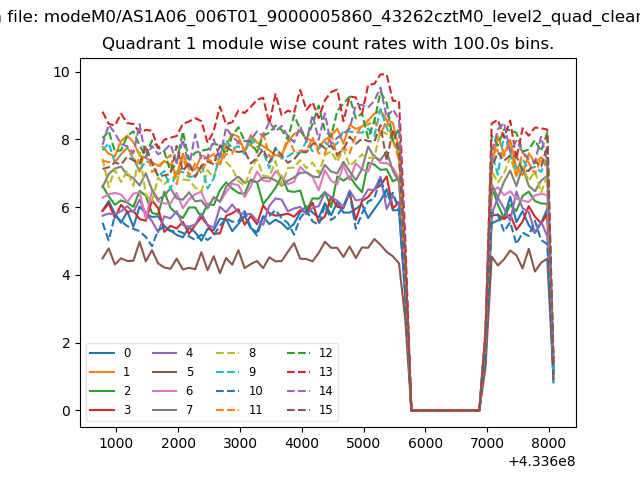
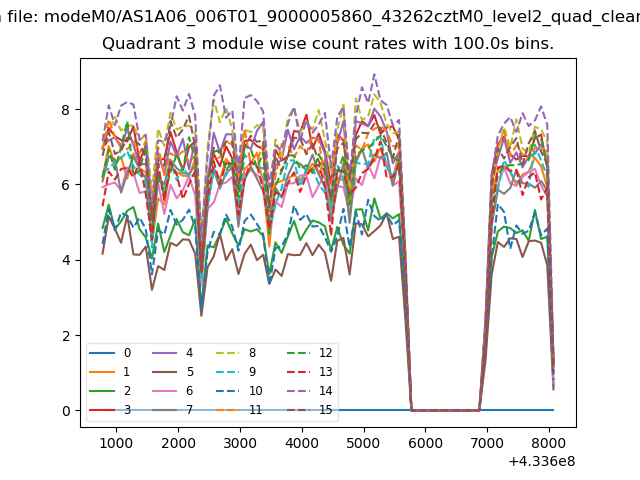
| Module-wise count rates for Quadrant A Data is divided into 100 sec bins |
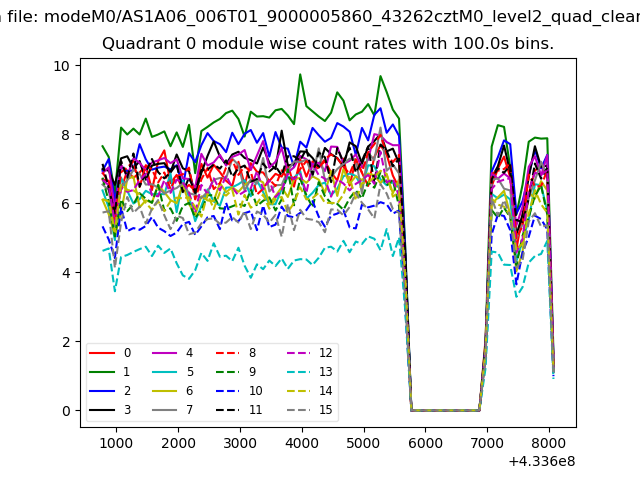 |
 |
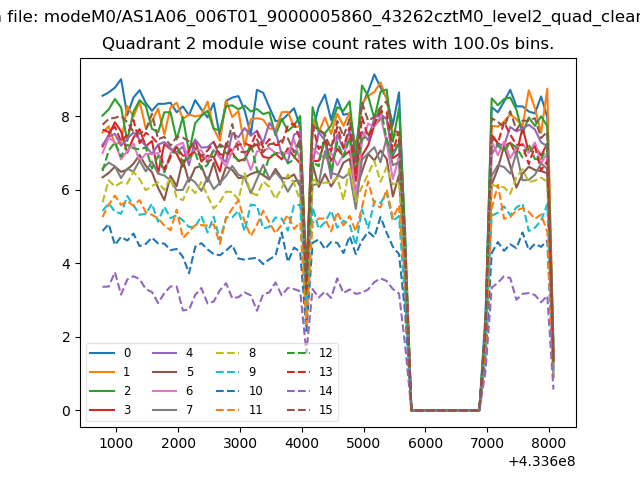
| Module-wise count rates for Quadrant B Data is divided into 100 sec bins |
 |
 |
| Module-wise count rates for Quadrant C Data is divided into 100 sec bins |
 |
 |
| Module-wise count rates for Quadrant D Data is divided into 100 sec bins |
 |
 |
| Parameter | Plot |
|---|---|
| CZT HV Monitor | 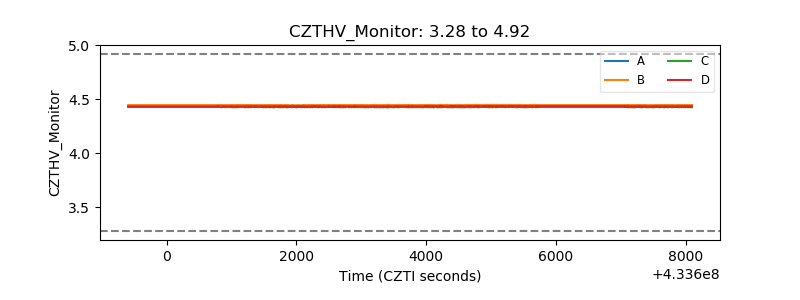 |
| D_VDD | 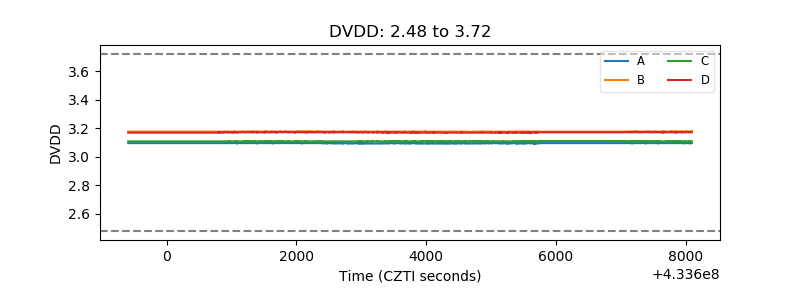 |
| Temperature 1 | 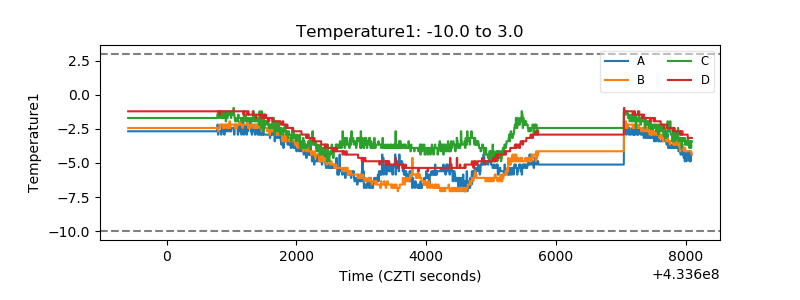 |
| Veto HV Monitor |  |
| Veto LLD | 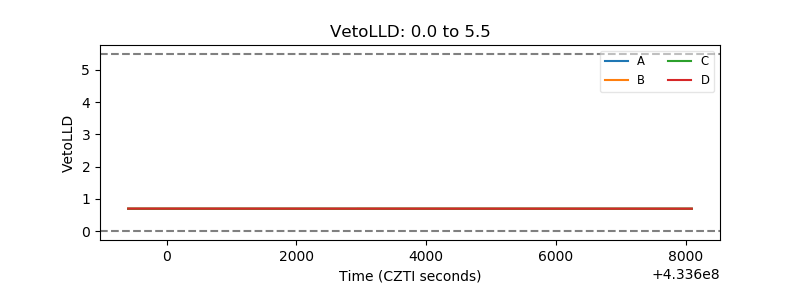 |
| Alpha Counter | 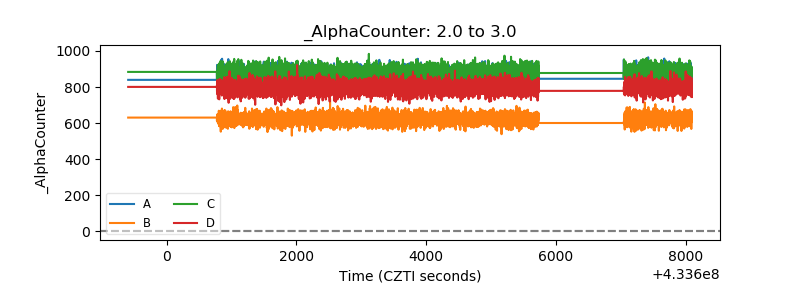 |
| _CPM_Rate | 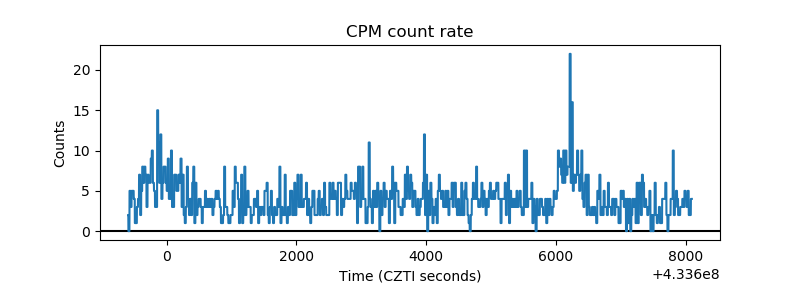 |
| CZT Counter | 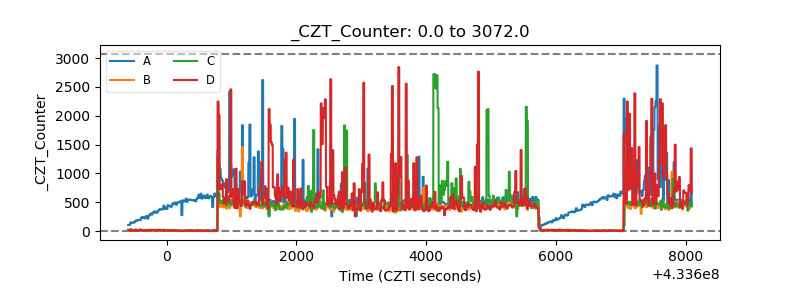 |
| +2.5 Volts monitor | 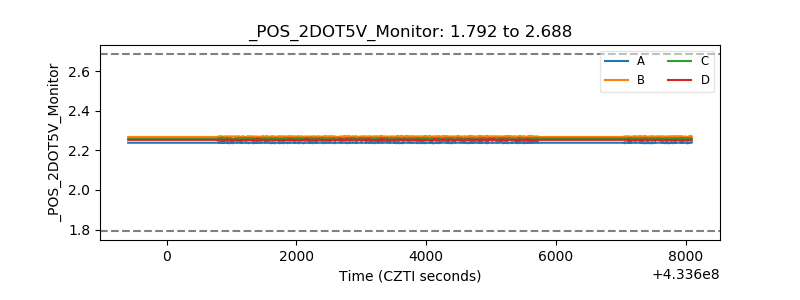 |
| +5 Volts monitor | 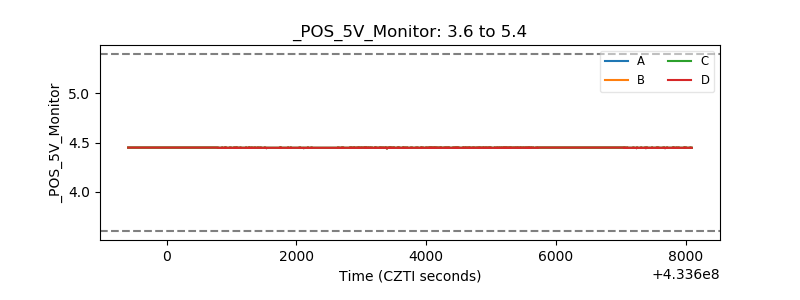 |
| _ROLL_ROT | 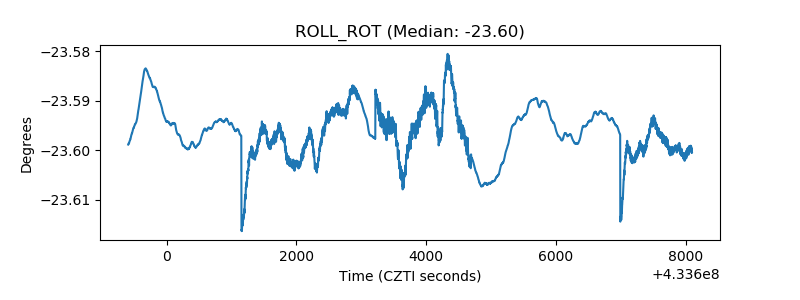 |
| _Roll_DEC | 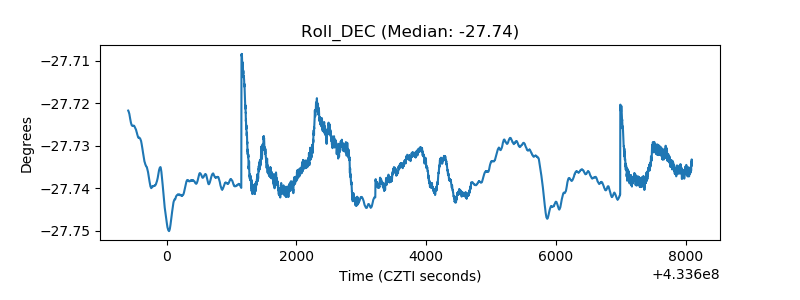 |
| _Roll_RA | 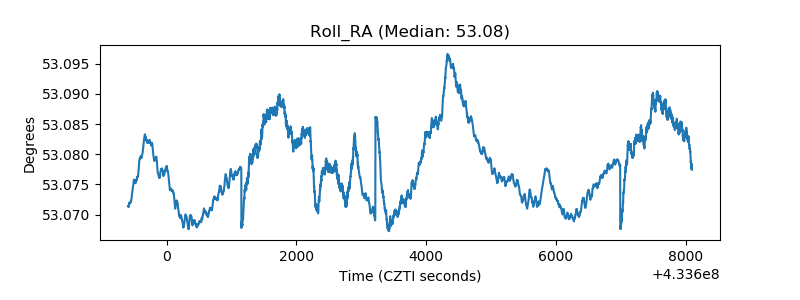 |
| Veto Counter | 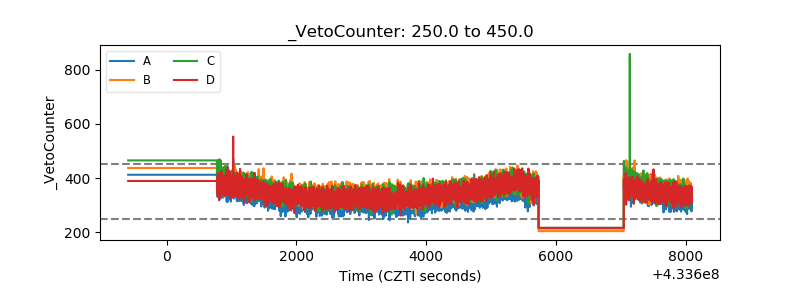 |