| Param | Original file | Final file |
|---|---|---|
| Filename | modeM0/AS1A06_006T01_9000005860_43266cztM0_level2.fits | modeM0/AS1A06_006T01_9000005860_43266cztM0_level2_quad_clean.evt |
| Size (bytes) | 886,152,960 | 232,318,080 |
| Size | 845.1 MB | 221.6 MB |
| Events in quadrant A | 8,511,760 | 1,518,852 |
| Events in quadrant B | 6,352,123 | 1,611,072 |
| Events in quadrant C | 7,470,194 | 1,522,631 |
| Events in quadrant D | 9,328,784 | 1,366,706 |
| Mode SS | |||
|---|---|---|---|
| Quadrant | BADHDUFLAG | Total packets | Discarded packets |
| A | 0 | 302 | 0 |
| B | 0 | 302 | 0 |
| C | 0 | 302 | 0 |
| D | 0 | 302 | 0 |
| Mode M9 | |||
|---|---|---|---|
| Quadrant | BADHDUFLAG | Total packets | Discarded packets |
| A | 0 | 55 | 0 |
| B | 0 | 55 | 0 |
| C | 0 | 55 | 0 |
| D | 0 | 55 | 0 |
| Mode M0 | |||
|---|---|---|---|
| Quadrant | BADHDUFLAG | Total packets | Discarded packets |
| A | 0 | 34521 | 3 |
| B | 0 | 29661 | 3 |
| C | 0 | 31785 | 3 |
| D | 0 | 38522 | 3 |
| Quadrant | Total seconds | Saturated seconds | Saturation percentage |
|---|---|---|---|
| A | 14700 | 326 | 2.217687% |
| B | 14701 | 25 | 0.170056% |
| C | 14701 | 131 | 0.891096% |
| D | 14701 | 758 | 5.156112% |
Noise dominated data is calculated using 1-second bins in cleaned event files. If a bin has >2000 counts, and if more than 50% of those come from <1% of pixels, then it is considered to be noise-dominated and hence unusable.
| Quadrant | # 1 sec bins | Bins with >0 counts | Bins with >2000 counts | High rate bins dominated by noise | Noise dominated (total time) | Noise dominated (detector-on time) | Marked lightcurve |
|---|---|---|---|---|---|---|---|
| A | 20190 | 14704 | 250 | 250 | 1.24% | 1.70% | 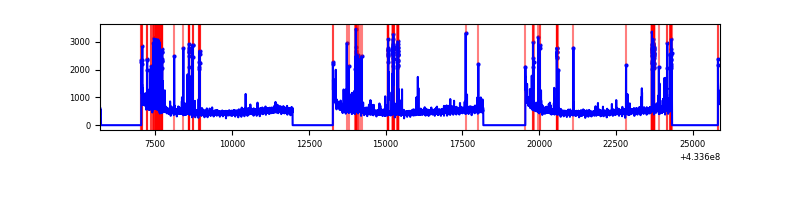 |
| B | 20191 | 14705 | 4 | 4 | 0.02% | 0.03% | 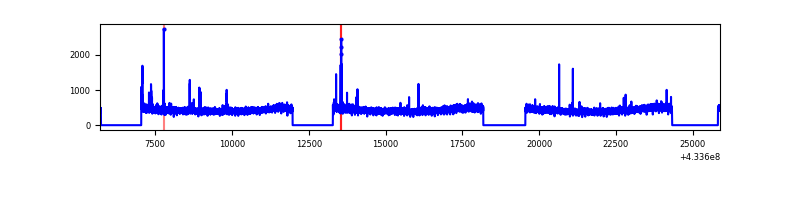 |
| C | 20191 | 14705 | 126 | 126 | 0.62% | 0.86% |  |
| D | 20191 | 14704 | 667 | 667 | 3.30% | 4.54% | 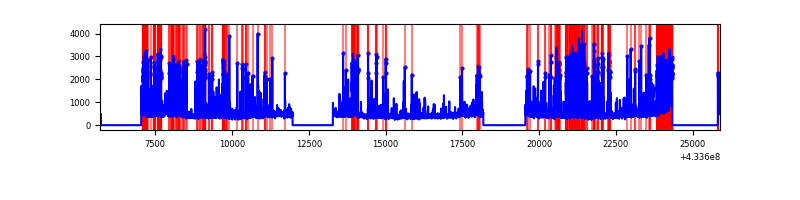 |
Top three noisy pixels from each quadrant. If the there are fewer than three noisy pixels in the level2.evt file, extra rows are filled as -1
| Pixel properties | Quadrant properties | ||||||
|---|---|---|---|---|---|---|---|
| Quadrant | DetID | PixID | Counts | Sigma | Mean | Median | Sigma |
| A | 10 | 83 | 1358311 | 4207.01 | 1568 | 1537 | 322.5 |
| A | 15 | 237 | 868475 | 2688.16 | 1568 | 1537 | 322.5 |
| A | 13 | 248 | 168676 | 518.26 | 1568 | 1537 | 322.5 |
| B | 5 | 255 | 72390 | 230.91 | 1582 | 1536 | 306.9 |
| B | 12 | 111 | 40023 | 125.42 | 1582 | 1536 | 306.9 |
| B | 11 | 111 | 37404 | 116.89 | 1582 | 1536 | 306.9 |
| C | 14 | 254 | 699025 | 1916.36 | 1555 | 1565 | 363.9 |
| C | 15 | 214 | 597513 | 1637.45 | 1555 | 1565 | 363.9 |
| C | 3 | 233 | 67158 | 180.23 | 1555 | 1565 | 363.9 |
| D | 2 | 249 | 837102 | 2256.76 | 1520 | 1477 | 370.3 |
| D | 13 | 249 | 821021 | 2213.33 | 1520 | 1477 | 370.3 |
| D | 1 | 47 | 664081 | 1789.48 | 1520 | 1477 | 370.3 |
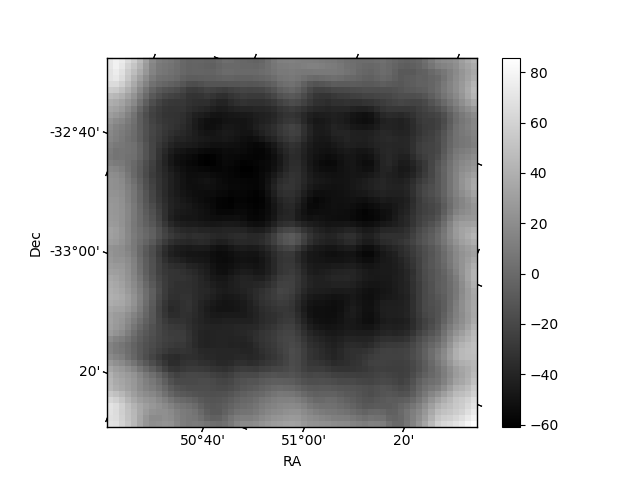
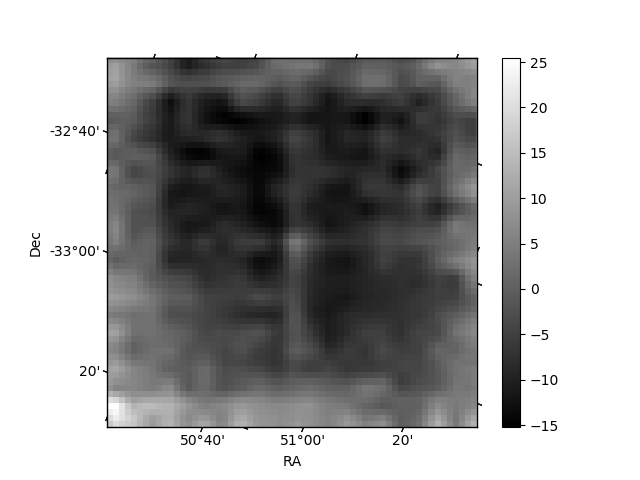
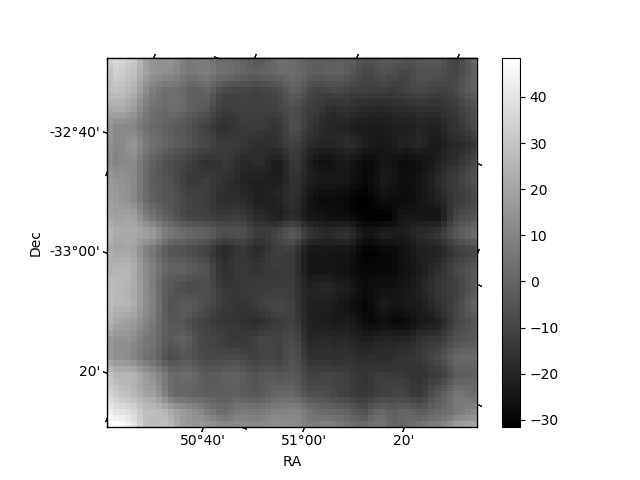
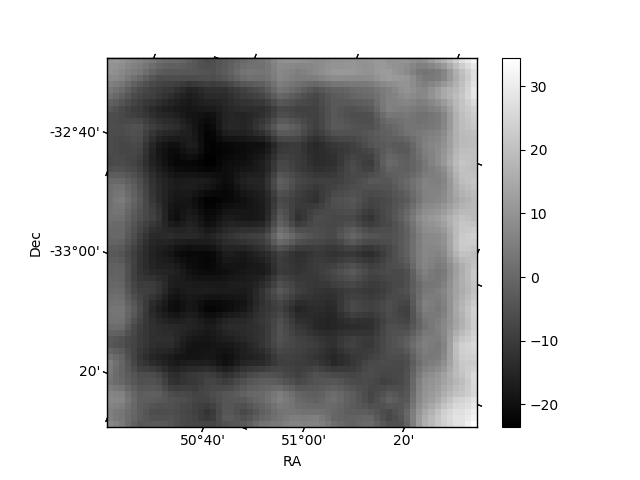
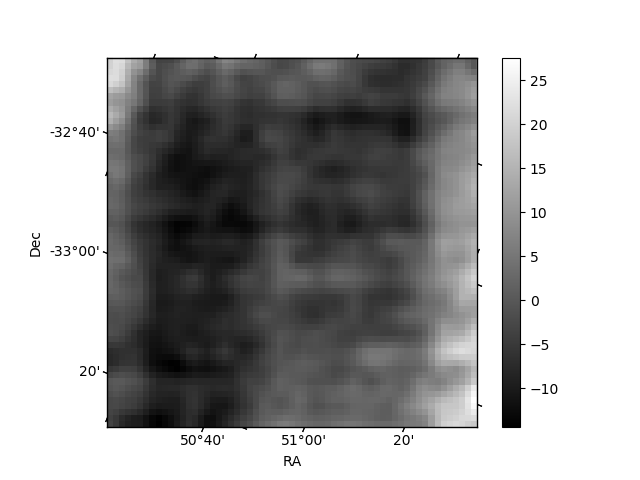
Histogram calculated using DETX and DETY for each event in the final _common_clean file
| Quadrant A | 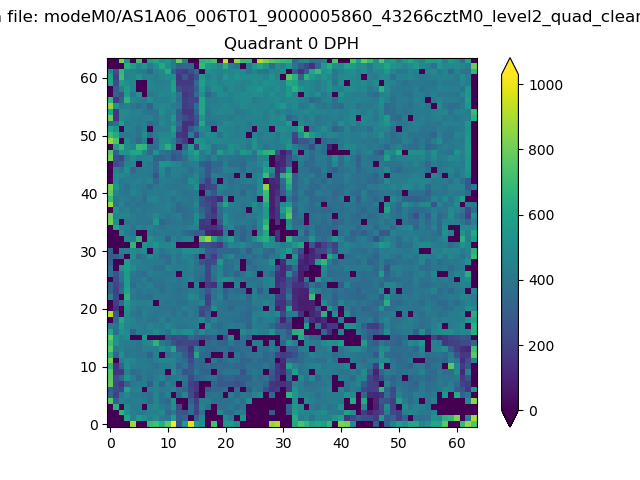 |
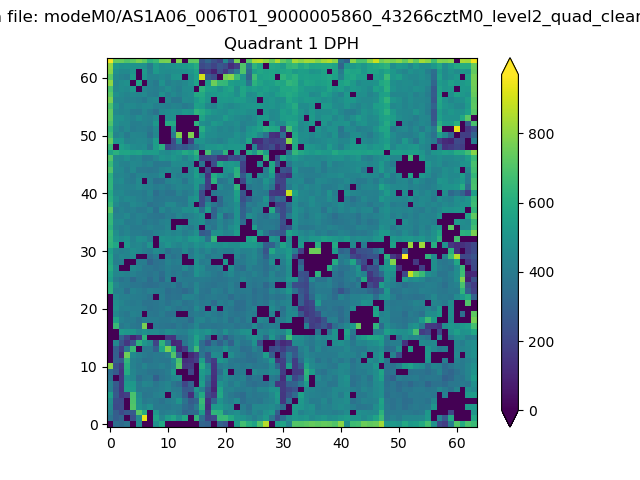 |
Quadrant B |
|---|---|---|---|
| Quadrant D | 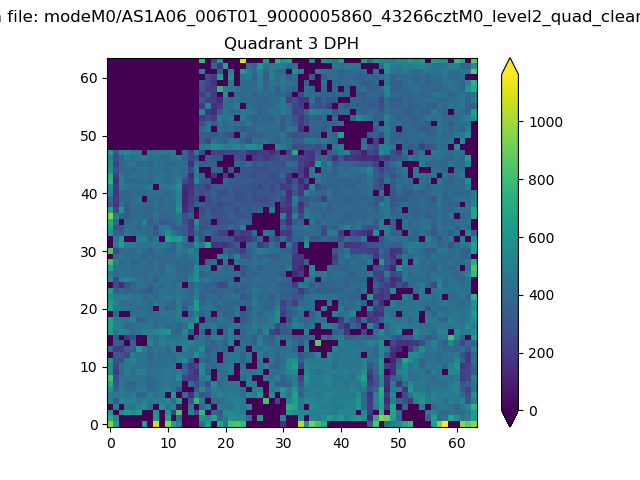 |
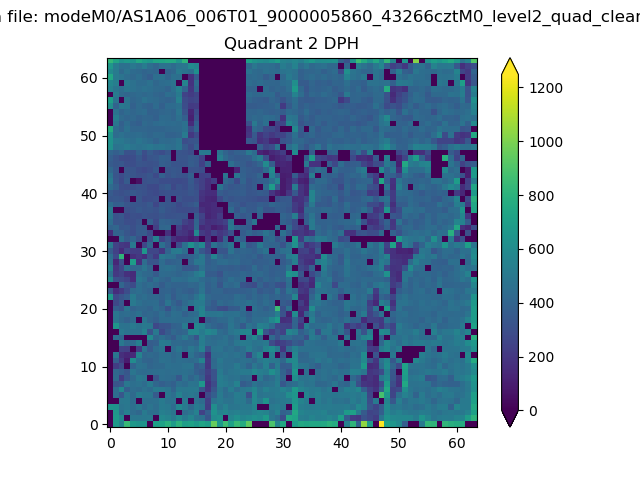 |
Quadrant C |
| Plot type | Count rate plots | Images |
|---|---|---|
| Comparison with Poisson distribution Blue bars denote a histogram of data divided into 1 sec bins. Red curve is a Poisson curve with rate = median count rate of data. |
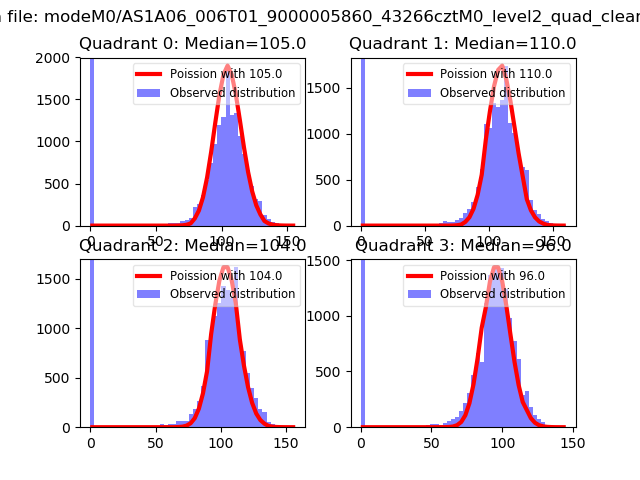 |
 |
| Quadrant-wise count rates Data is divided into 100 sec bins |
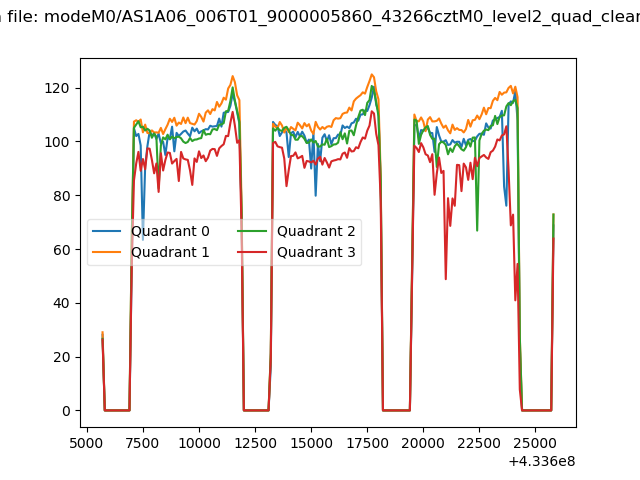 |
|
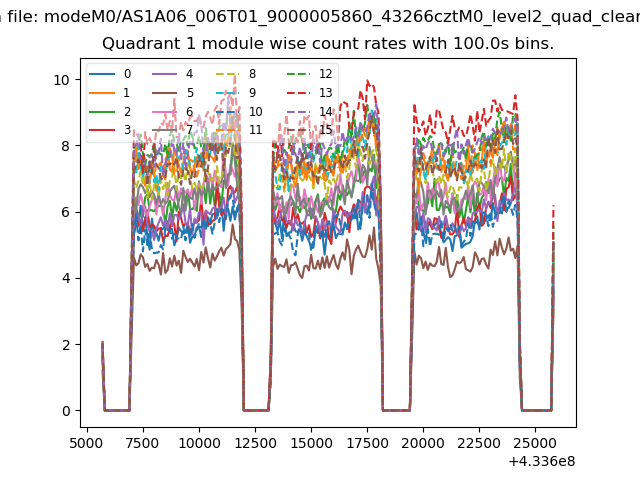
| Module-wise count rates for Quadrant A Data is divided into 100 sec bins |
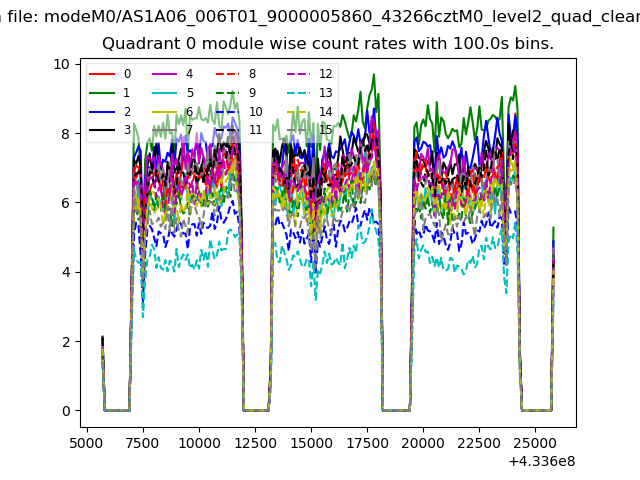 |
 |
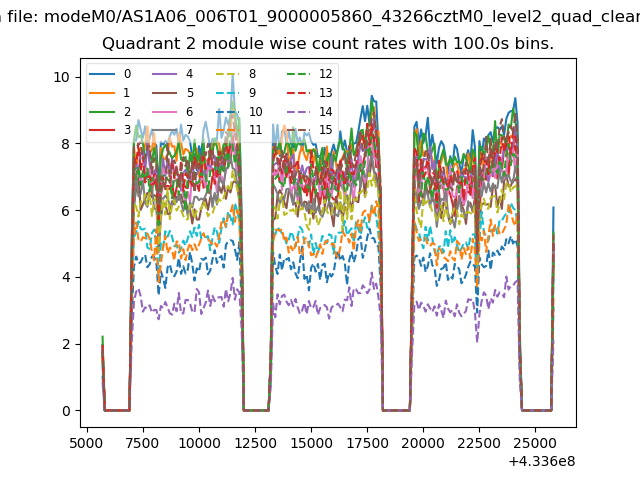
| Module-wise count rates for Quadrant B Data is divided into 100 sec bins |
 |
 |
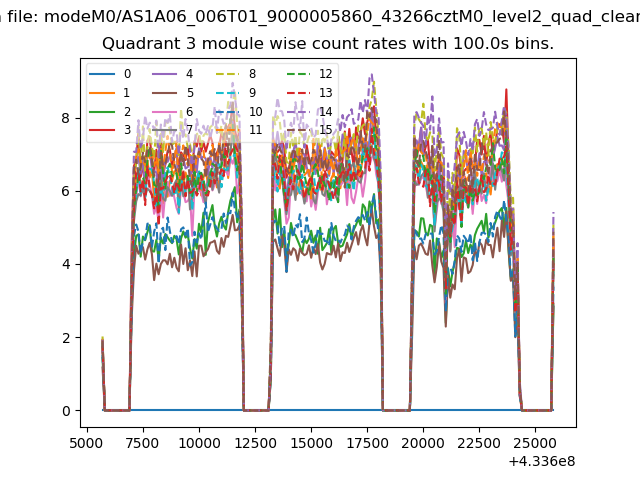
| Module-wise count rates for Quadrant C Data is divided into 100 sec bins |
 |
 |
| Module-wise count rates for Quadrant D Data is divided into 100 sec bins |
 |
 |
| Parameter | Plot |
|---|---|
| CZT HV Monitor | 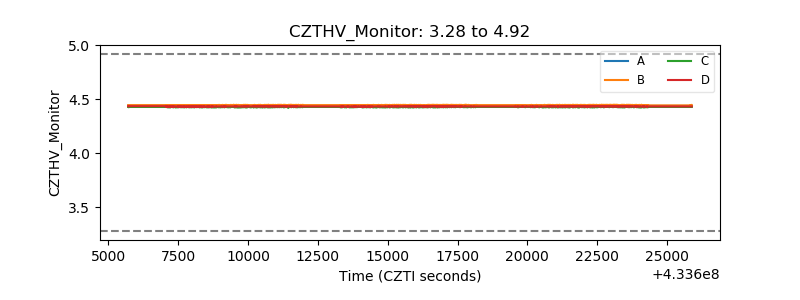 |
| D_VDD | 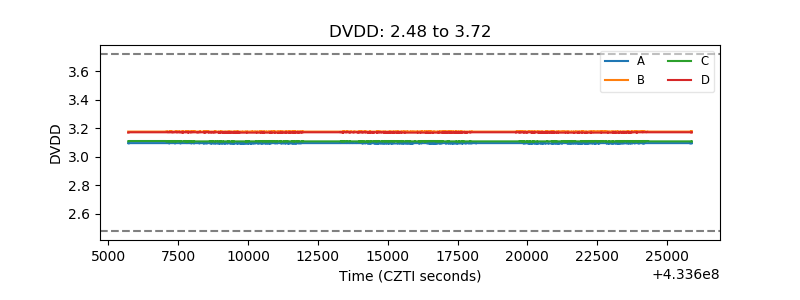 |
| Temperature 1 | 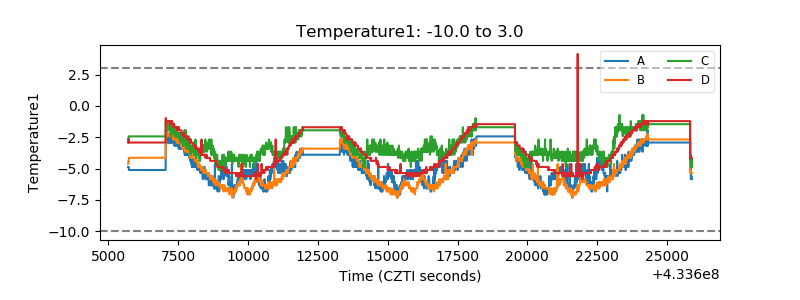 |
| Veto HV Monitor | 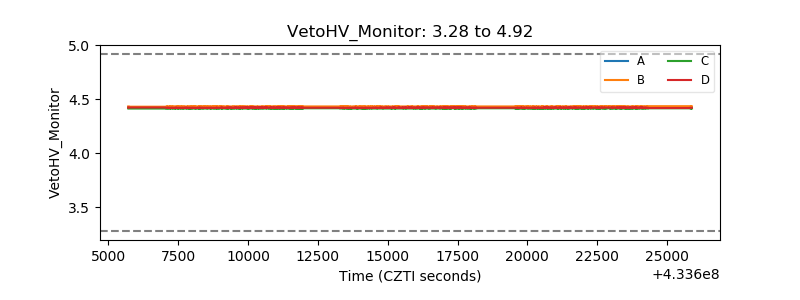 |
| Veto LLD | 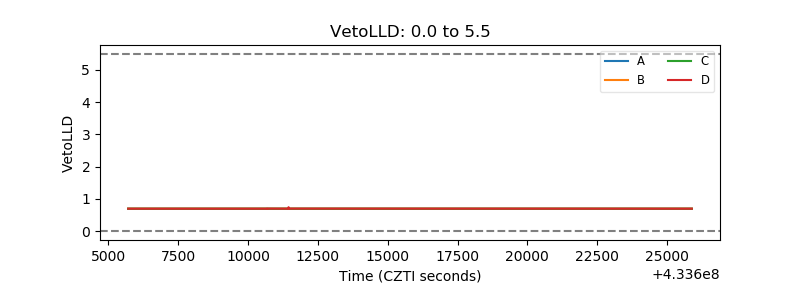 |
| Alpha Counter | 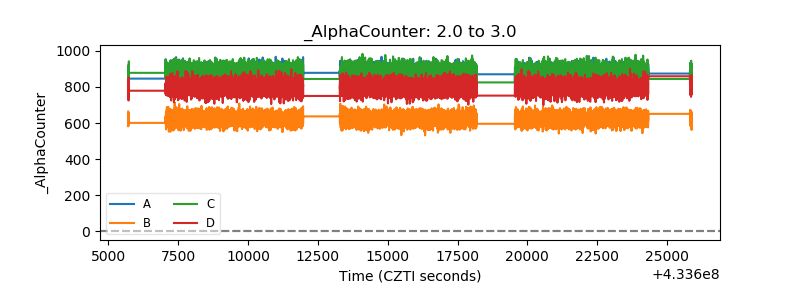 |
| _CPM_Rate | 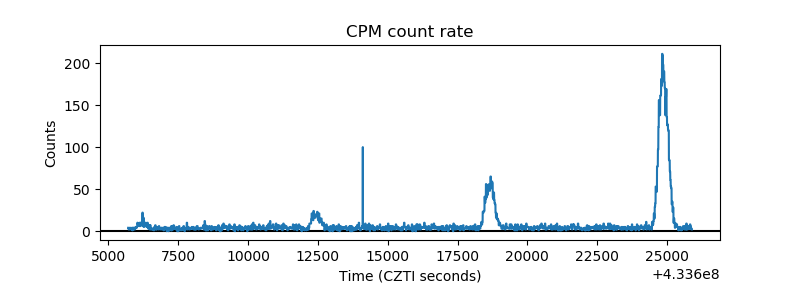 |
| CZT Counter | 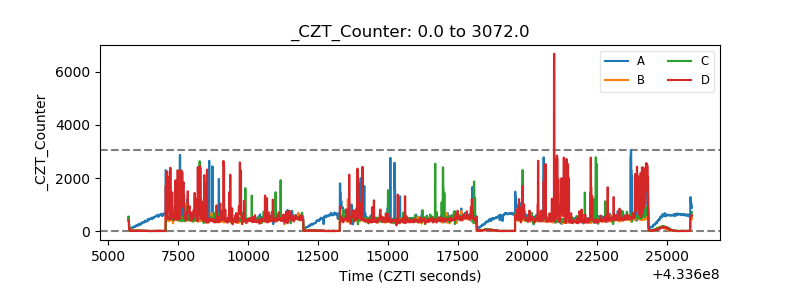 |
| +2.5 Volts monitor | 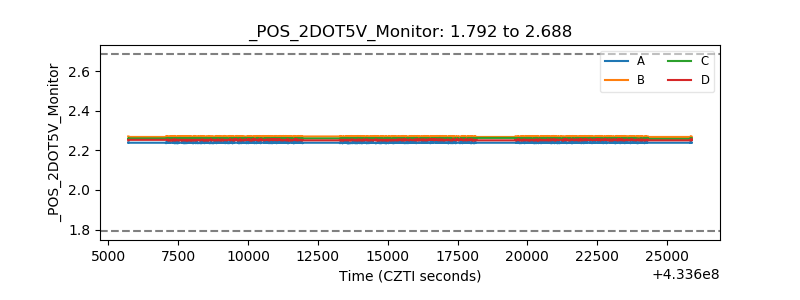 |
| +5 Volts monitor | 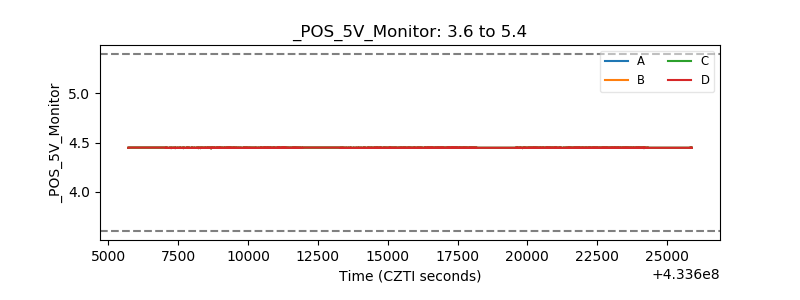 |
| _ROLL_ROT |  |
| _Roll_DEC |  |
| _Roll_RA | 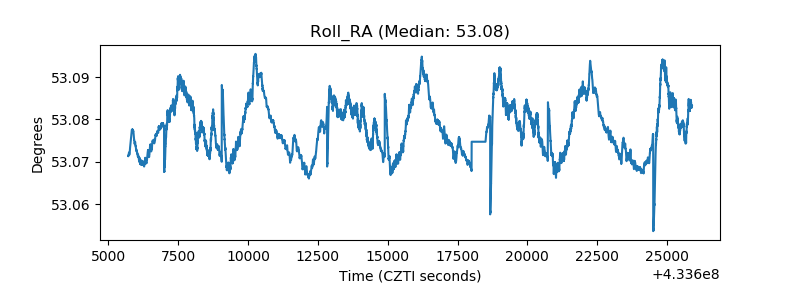 |
| Veto Counter | 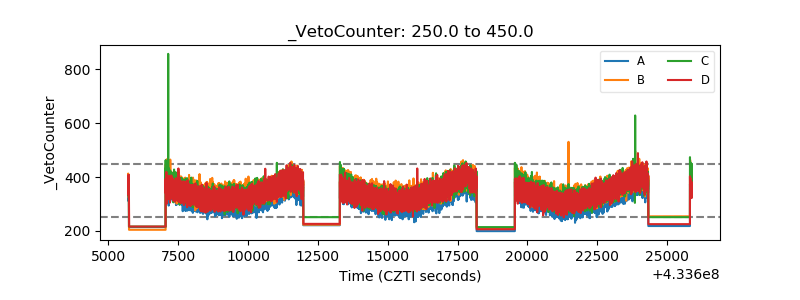 |