| Param | Original file | Final file |
|---|---|---|
| Filename | modeM0/AS1A06_006T01_9000005860_43271cztM0_level2.fits | modeM0/AS1A06_006T01_9000005860_43271cztM0_level2_quad_clean.evt |
| Size (bytes) | 302,610,240 | 87,937,920 |
| Size | 288.6 MB | 83.9 MB |
| Events in quadrant A | 3,050,465 | 582,691 |
| Events in quadrant B | 2,315,533 | 615,687 |
| Events in quadrant C | 2,559,247 | 588,341 |
| Events in quadrant D | 2,888,775 | 527,637 |
| Mode SS | |||
|---|---|---|---|
| Quadrant | BADHDUFLAG | Total packets | Discarded packets |
| A | 0 | 102 | 0 |
| B | 0 | 102 | 0 |
| C | 0 | 102 | 0 |
| D | 0 | 102 | 0 |
| Mode M9 | |||
|---|---|---|---|
| Quadrant | BADHDUFLAG | Total packets | Discarded packets |
| A | 0 | 28 | 0 |
| B | 0 | 29 | 0 |
| C | 0 | 29 | 0 |
| D | 0 | 29 | 0 |
| Mode M0 | |||
|---|---|---|---|
| Quadrant | BADHDUFLAG | Total packets | Discarded packets |
| A | 0 | 12055 | 2 |
| B | 0 | 10167 | 2 |
| C | 0 | 10414 | 2 |
| D | 0 | 12010 | 2 |
| Quadrant | Total seconds | Saturated seconds | Saturation percentage |
|---|---|---|---|
| A | 4970 | 70 | 1.408451% |
| B | 4970 | 25 | 0.503018% |
| C | 4970 | 15 | 0.301811% |
| D | 4970 | 148 | 2.977867% |
Noise dominated data is calculated using 1-second bins in cleaned event files. If a bin has >2000 counts, and if more than 50% of those come from <1% of pixels, then it is considered to be noise-dominated and hence unusable.
| Quadrant | # 1 sec bins | Bins with >0 counts | Bins with >2000 counts | High rate bins dominated by noise | Noise dominated (total time) | Noise dominated (detector-on time) | Marked lightcurve |
|---|---|---|---|---|---|---|---|
| A | 7063 | 4970 | 46 | 46 | 0.65% | 0.93% | 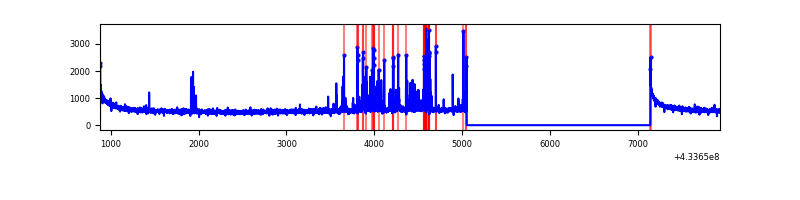 |
| B | 7063 | 4971 | 10 | 10 | 0.14% | 0.20% | 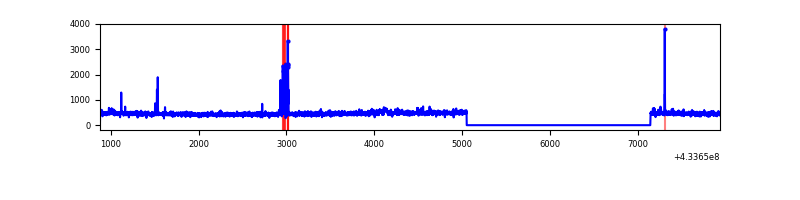 |
| C | 7063 | 4971 | 11 | 11 | 0.16% | 0.22% | 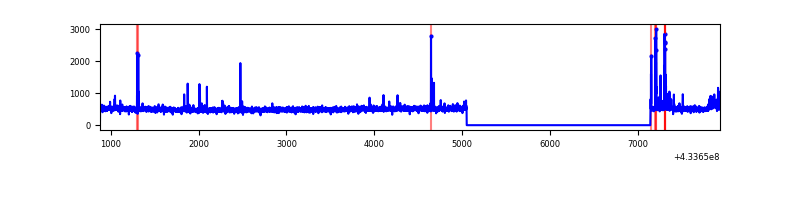 |
| D | 7063 | 4971 | 123 | 123 | 1.74% | 2.47% | 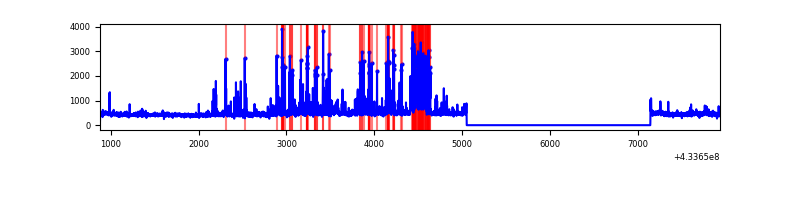 |
Top three noisy pixels from each quadrant. If the there are fewer than three noisy pixels in the level2.evt file, extra rows are filled as -1
| Pixel properties | Quadrant properties | ||||||
|---|---|---|---|---|---|---|---|
| Quadrant | DetID | PixID | Counts | Sigma | Mean | Median | Sigma |
| A | 10 | 83 | 532787 | 4531.39 | 570 | 559 | 117.5 |
| A | 13 | 248 | 214364 | 1820.34 | 570 | 559 | 117.5 |
| A | 15 | 237 | 92538 | 783.11 | 570 | 559 | 117.5 |
| B | 5 | 172 | 49928 | 453.61 | 567 | 552 | 108.9 |
| B | 5 | 255 | 15044 | 133.13 | 567 | 552 | 108.9 |
| B | 12 | 111 | 13477 | 118.74 | 567 | 552 | 108.9 |
| C | 15 | 214 | 209250 | 1564.97 | 569 | 573 | 133.3 |
| C | 14 | 254 | 75266 | 560.16 | 569 | 573 | 133.3 |
| C | 3 | 233 | 31939 | 235.23 | 569 | 573 | 133.3 |
| D | 2 | 249 | 424461 | 3128.36 | 560 | 545 | 135.5 |
| D | 12 | 233 | 145859 | 1072.37 | 560 | 545 | 135.5 |
| D | 13 | 249 | 87349 | 640.58 | 560 | 545 | 135.5 |
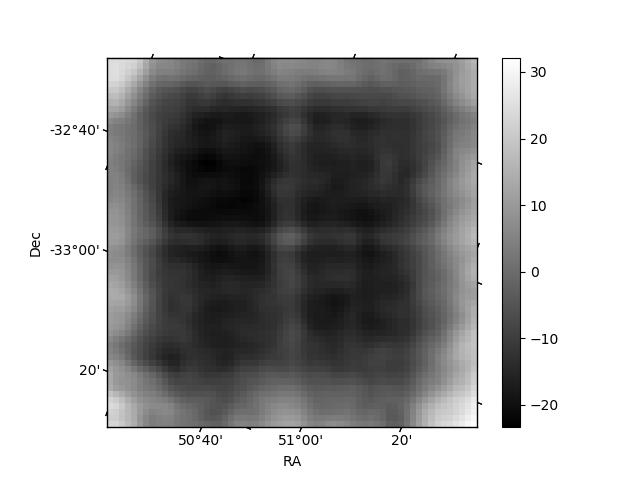
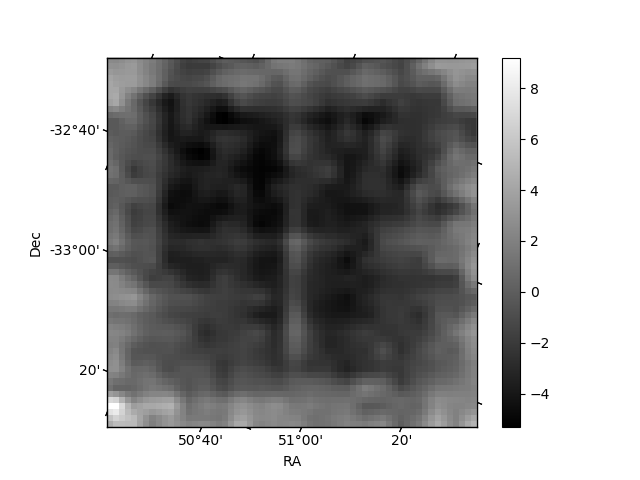
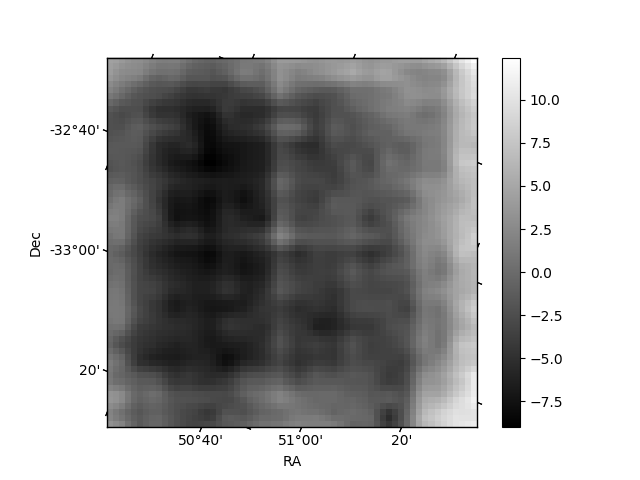
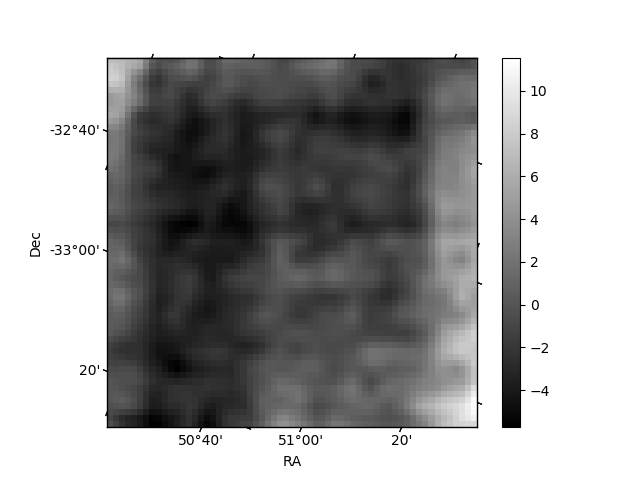
Histogram calculated using DETX and DETY for each event in the final _common_clean file
| Quadrant A | 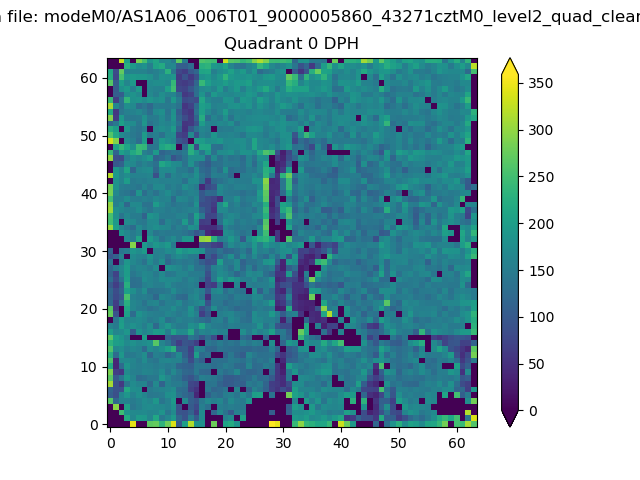 |
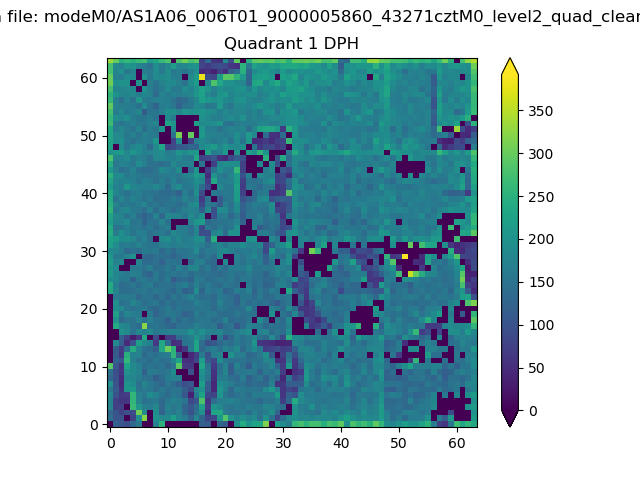 |
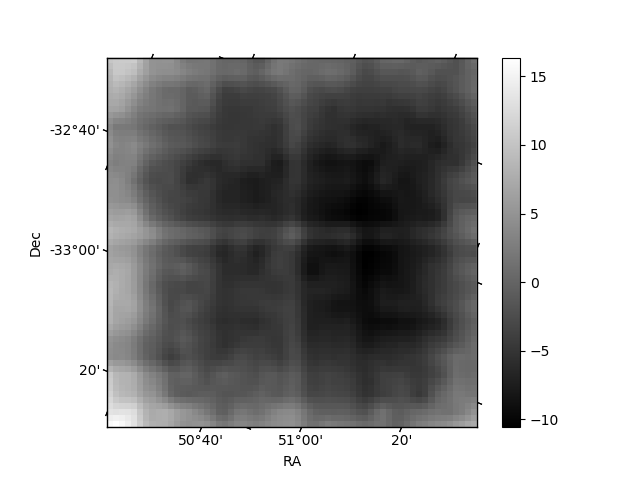
Quadrant B |
|---|---|---|---|
| Quadrant D | 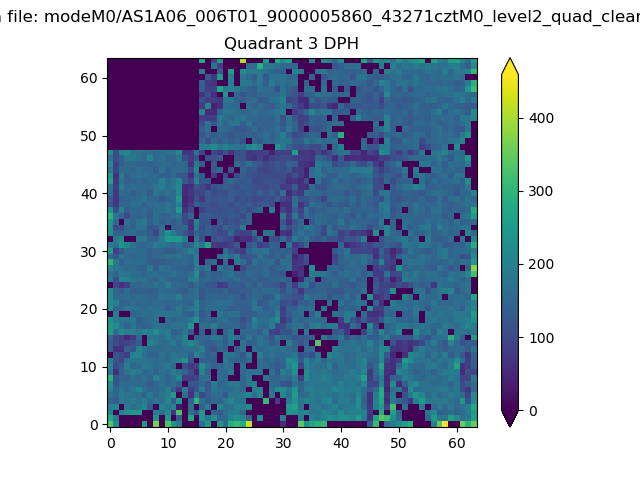 |
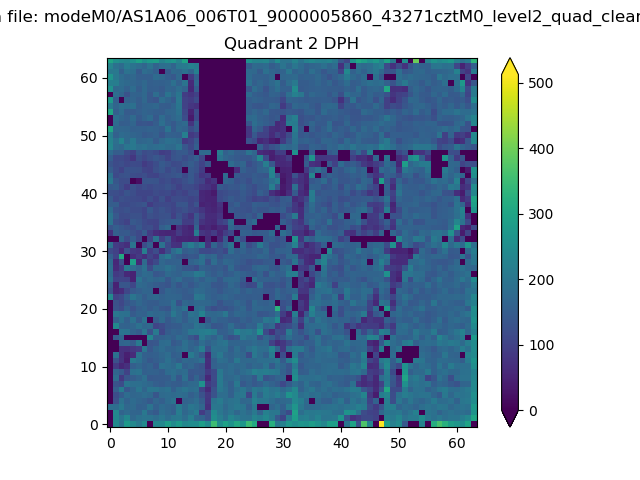 |
Quadrant C |
| Plot type | Count rate plots | Images |
|---|---|---|
| Comparison with Poisson distribution Blue bars denote a histogram of data divided into 1 sec bins. Red curve is a Poisson curve with rate = median count rate of data. |
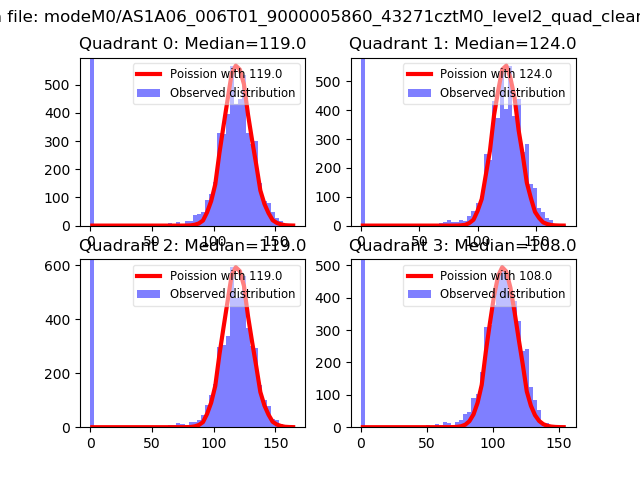 |
 |
| Quadrant-wise count rates Data is divided into 100 sec bins |
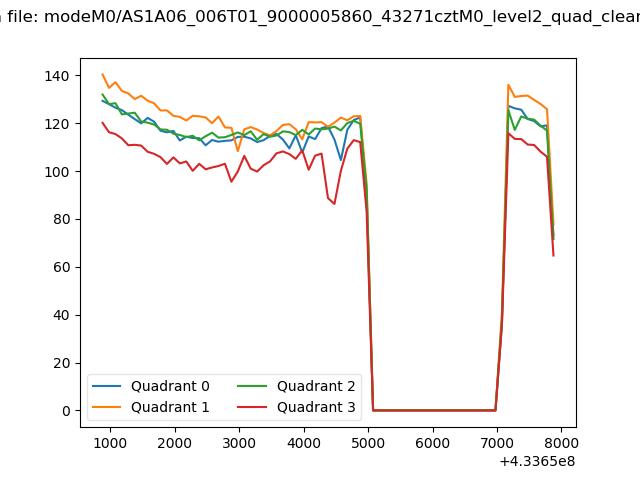 |
|
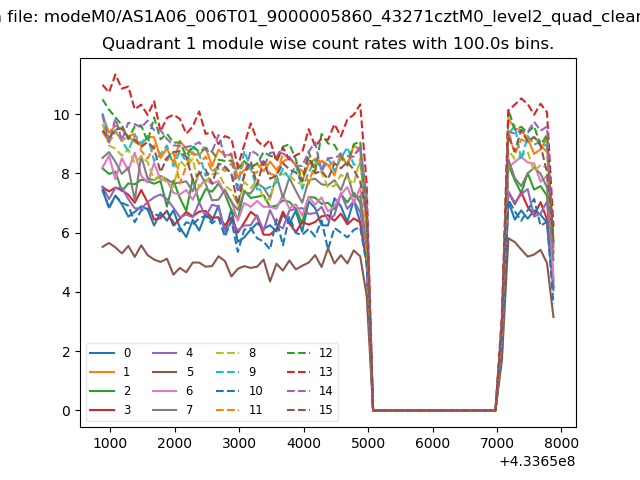
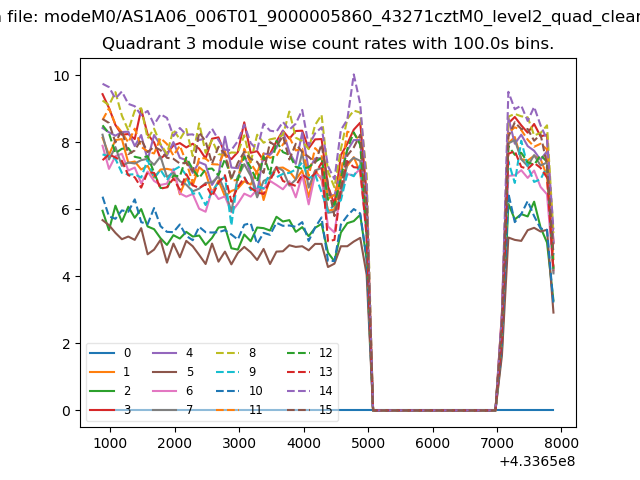
| Module-wise count rates for Quadrant A Data is divided into 100 sec bins |
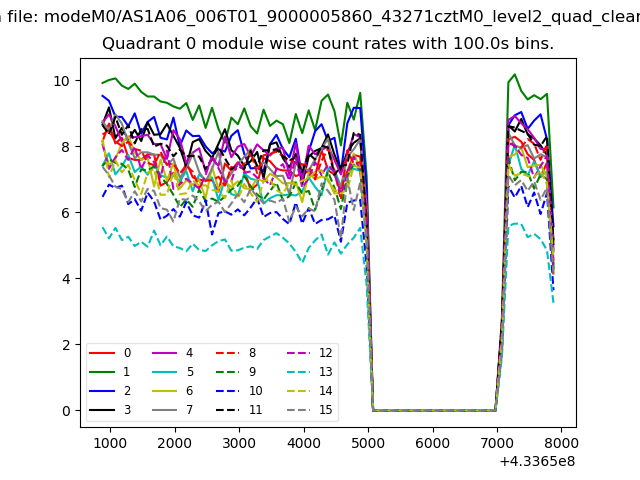 |
 |
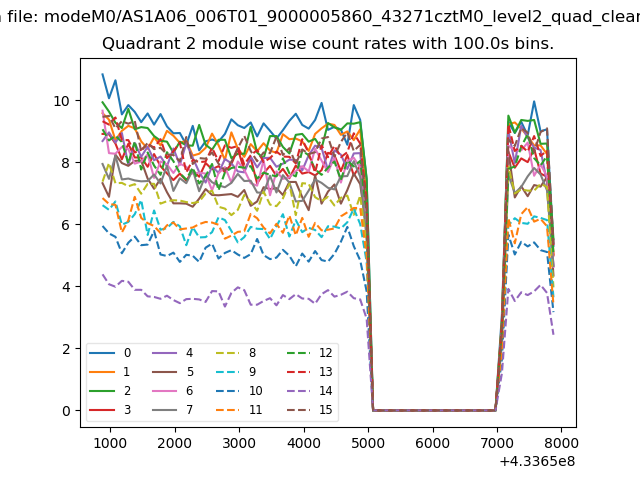
| Module-wise count rates for Quadrant B Data is divided into 100 sec bins |
 |
 |
| Module-wise count rates for Quadrant C Data is divided into 100 sec bins |
 |
 |
| Module-wise count rates for Quadrant D Data is divided into 100 sec bins |
 |
 |
| Parameter | Plot |
|---|---|
| CZT HV Monitor | 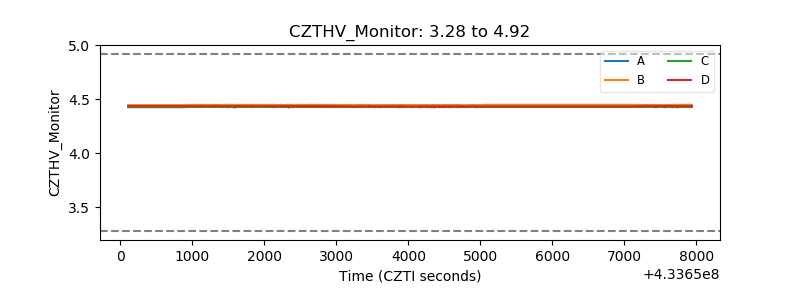 |
| D_VDD | 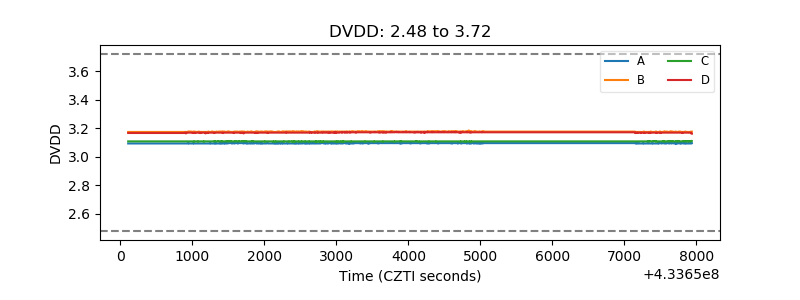 |
| Temperature 1 | 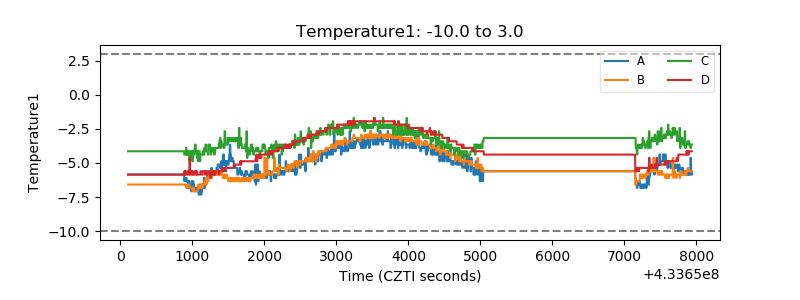 |
| Veto HV Monitor | 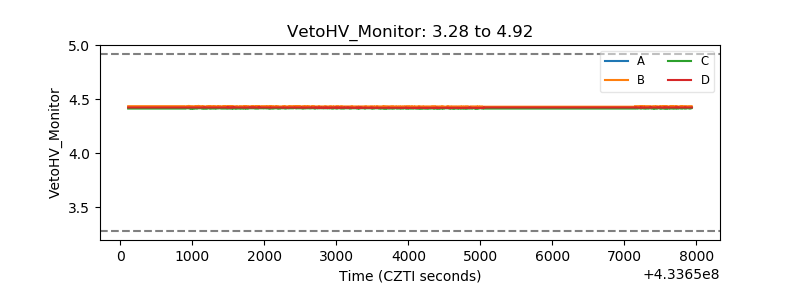 |
| Veto LLD | 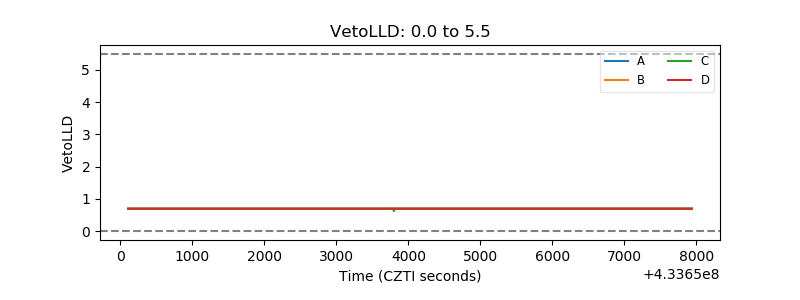 |
| Alpha Counter | 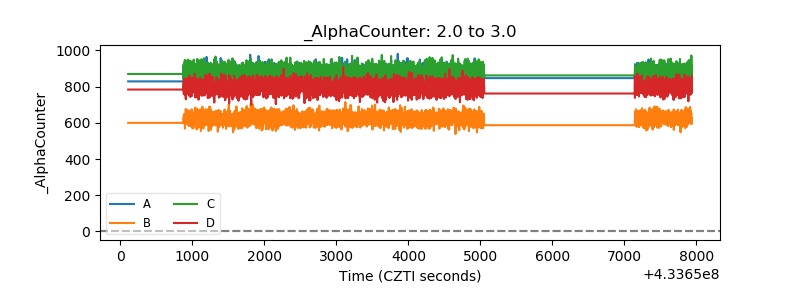 |
| _CPM_Rate | 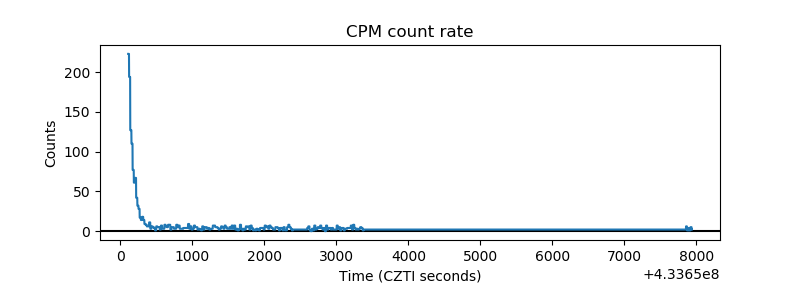 |
| CZT Counter | 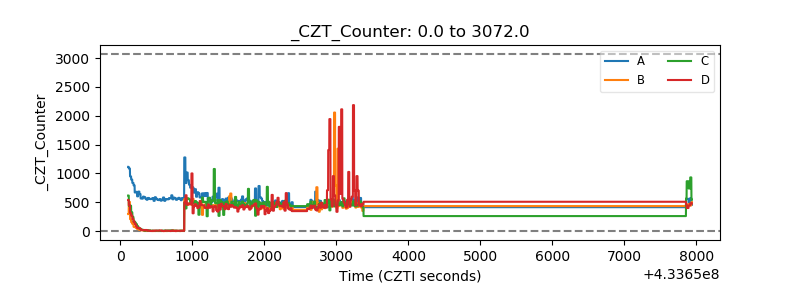 |
| +2.5 Volts monitor | 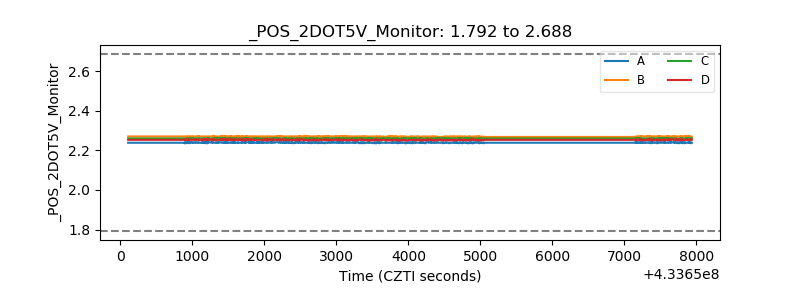 |
| +5 Volts monitor | 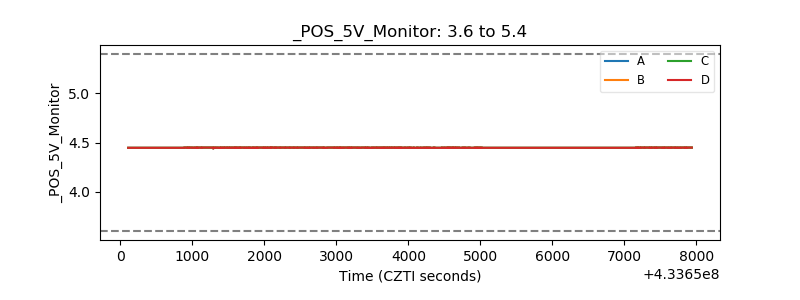 |
| _ROLL_ROT |  |
| _Roll_DEC | 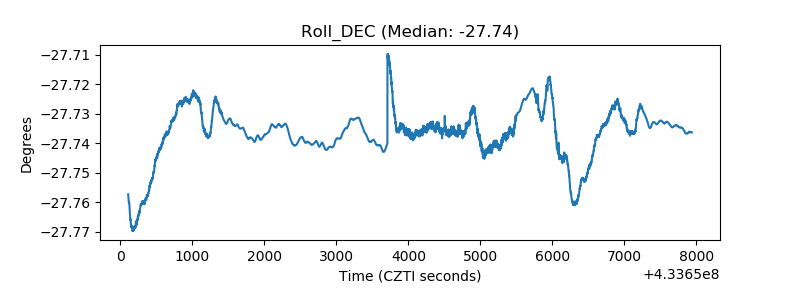 |
| _Roll_RA | 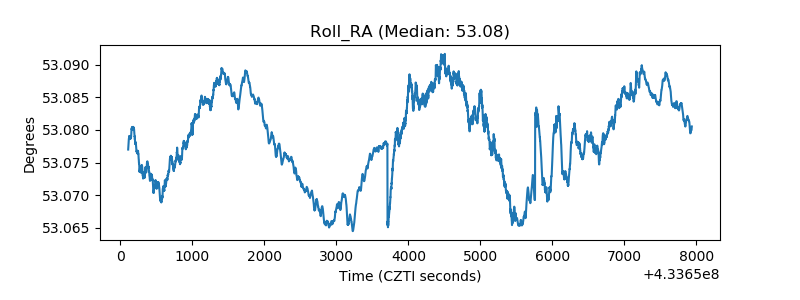 |
| Veto Counter | 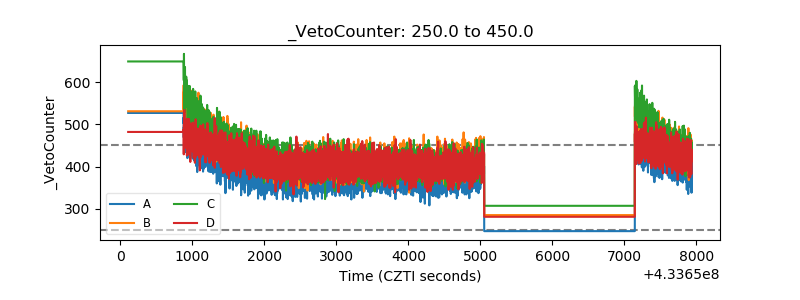 |