| Param | Original file | Final file |
|---|---|---|
| Filename | modeM0/AS1A06_006T01_9000005860_43275cztM0_level2.fits | modeM0/AS1A06_006T01_9000005860_43275cztM0_level2_quad_clean.evt |
| Size (bytes) | 328,075,200 | 88,951,680 |
| Size | 312.9 MB | 84.8 MB |
| Events in quadrant A | 3,597,905 | 573,353 |
| Events in quadrant B | 2,406,584 | 609,059 |
| Events in quadrant C | 2,687,272 | 587,860 |
| Events in quadrant D | 3,023,956 | 537,836 |
| Mode SS | |||
|---|---|---|---|
| Quadrant | BADHDUFLAG | Total packets | Discarded packets |
| A | 0 | 114 | 0 |
| B | 0 | 114 | 0 |
| C | 0 | 114 | 0 |
| D | 0 | 114 | 0 |
| Mode M9 | |||
|---|---|---|---|
| Quadrant | BADHDUFLAG | Total packets | Discarded packets |
| A | 0 | 27 | 0 |
| B | 0 | 28 | 0 |
| C | 0 | 28 | 0 |
| D | 0 | 28 | 0 |
| Mode M0 | |||
|---|---|---|---|
| Quadrant | BADHDUFLAG | Total packets | Discarded packets |
| A | 0 | 14060 | 2 |
| B | 0 | 11065 | 2 |
| C | 0 | 11422 | 3 |
| D | 0 | 12875 | 2 |
| Quadrant | Total seconds | Saturated seconds | Saturation percentage |
|---|---|---|---|
| A | 5500 | 166 | 3.018182% |
| B | 5500 | 8 | 0.145455% |
| C | 5499 | 27 | 0.490998% |
| D | 5499 | 109 | 1.982179% |
Noise dominated data is calculated using 1-second bins in cleaned event files. If a bin has >2000 counts, and if more than 50% of those come from <1% of pixels, then it is considered to be noise-dominated and hence unusable.
| Quadrant | # 1 sec bins | Bins with >0 counts | Bins with >2000 counts | High rate bins dominated by noise | Noise dominated (total time) | Noise dominated (detector-on time) | Marked lightcurve |
|---|---|---|---|---|---|---|---|
| A | 7084 | 5501 | 141 | 141 | 1.99% | 2.56% | 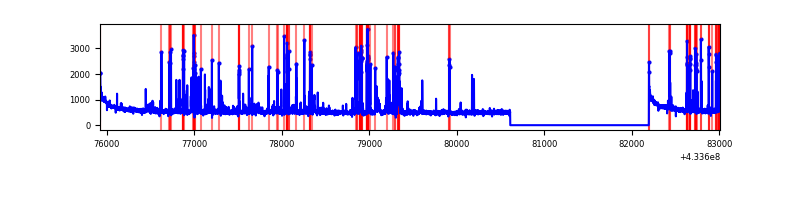 |
| B | 7084 | 5501 | 1 | 1 | 0.01% | 0.02% | 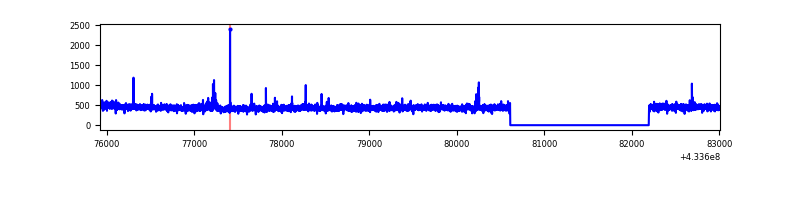 |
| C | 7083 | 5500 | 21 | 21 | 0.30% | 0.38% | 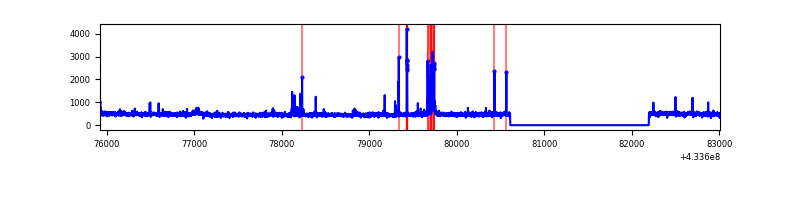 |
| D | 7083 | 5500 | 95 | 95 | 1.34% | 1.73% | 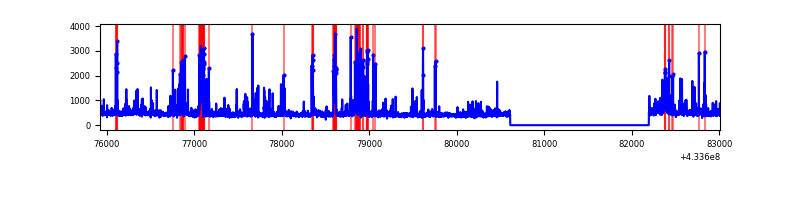 |
Top three noisy pixels from each quadrant. If the there are fewer than three noisy pixels in the level2.evt file, extra rows are filled as -1
| Pixel properties | Quadrant properties | ||||||
|---|---|---|---|---|---|---|---|
| Quadrant | DetID | PixID | Counts | Sigma | Mean | Median | Sigma |
| A | 10 | 83 | 603750 | 4852.09 | 595 | 580 | 124.3 |
| A | 15 | 237 | 528203 | 4244.37 | 595 | 580 | 124.3 |
| A | 13 | 248 | 145009 | 1161.83 | 595 | 580 | 124.3 |
| B | 0 | 189 | 22845 | 190.1 | 597 | 579 | 117.1 |
| B | 12 | 111 | 15101 | 123.98 | 597 | 579 | 117.1 |
| B | 11 | 111 | 13894 | 113.68 | 597 | 579 | 117.1 |
| C | 15 | 214 | 230998 | 1658.26 | 589 | 591 | 138.9 |
| C | 14 | 254 | 121022 | 866.76 | 589 | 591 | 138.9 |
| C | 7 | 220 | 17362 | 120.7 | 589 | 591 | 138.9 |
| D | 2 | 249 | 322366 | 2224.93 | 587 | 568 | 144.6 |
| D | 1 | 52 | 159032 | 1095.63 | 587 | 568 | 144.6 |
| D | 12 | 233 | 158810 | 1094.09 | 587 | 568 | 144.6 |
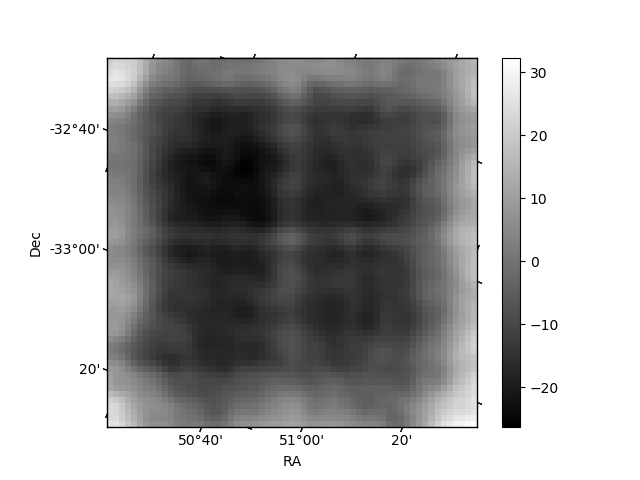
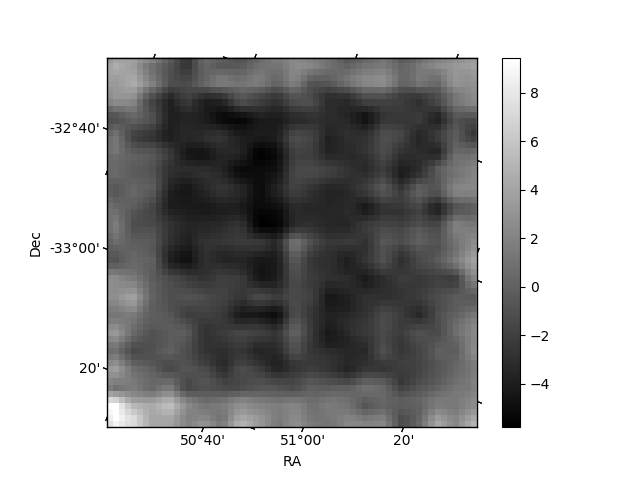
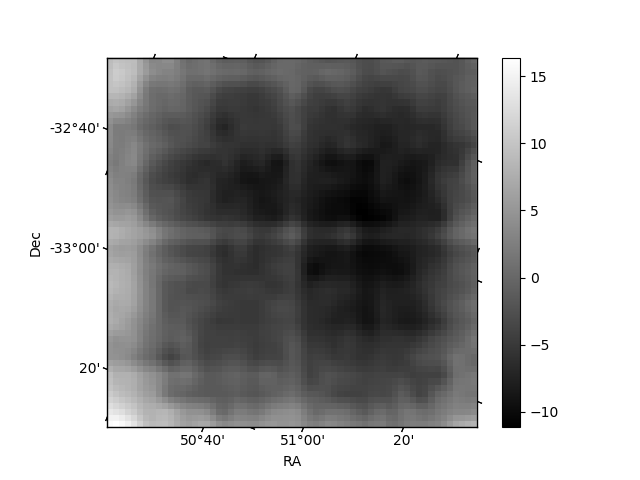
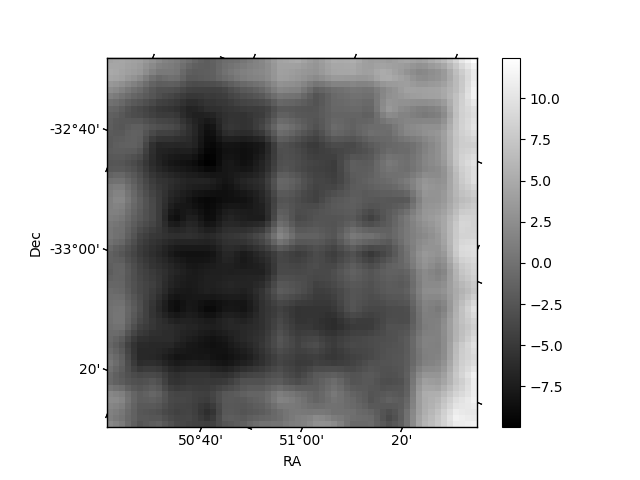
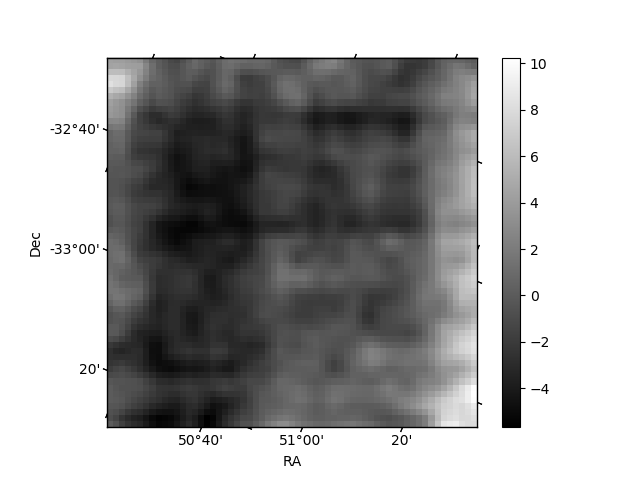
Histogram calculated using DETX and DETY for each event in the final _common_clean file
| Quadrant A | 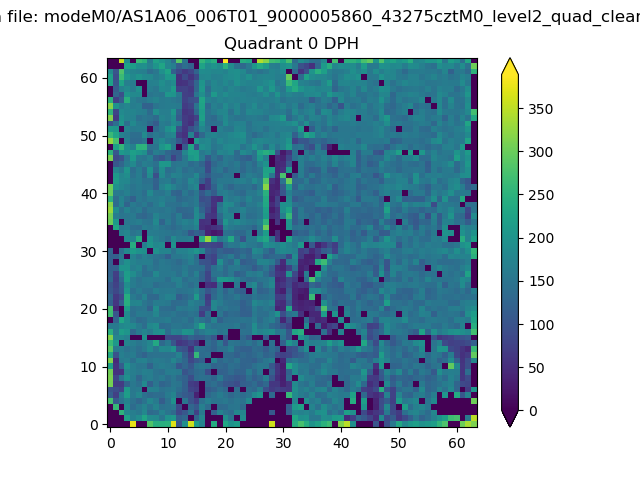 |
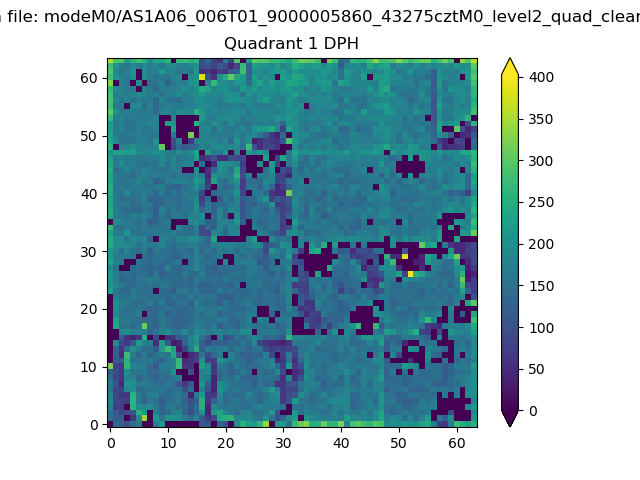 |
Quadrant B |
|---|---|---|---|
| Quadrant D | 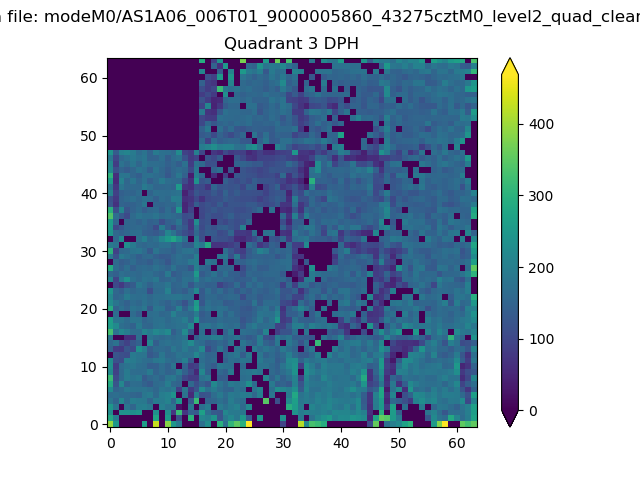 |
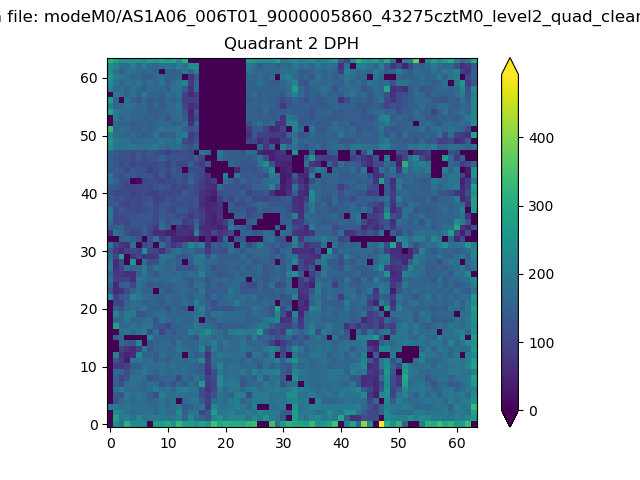 |
Quadrant C |
| Plot type | Count rate plots | Images |
|---|---|---|
| Comparison with Poisson distribution Blue bars denote a histogram of data divided into 1 sec bins. Red curve is a Poisson curve with rate = median count rate of data. |
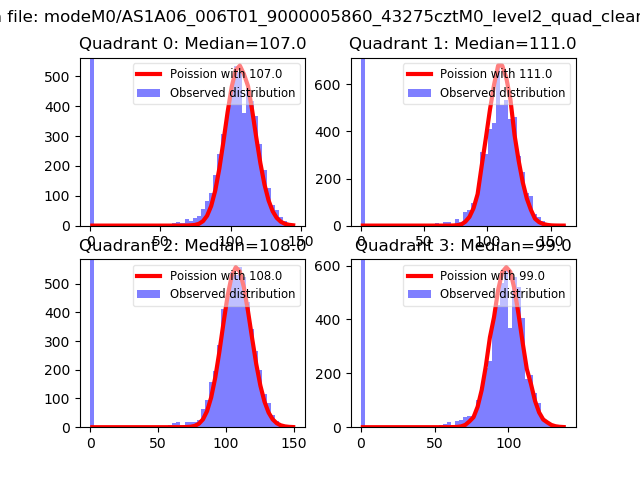 |
 |
| Quadrant-wise count rates Data is divided into 100 sec bins |
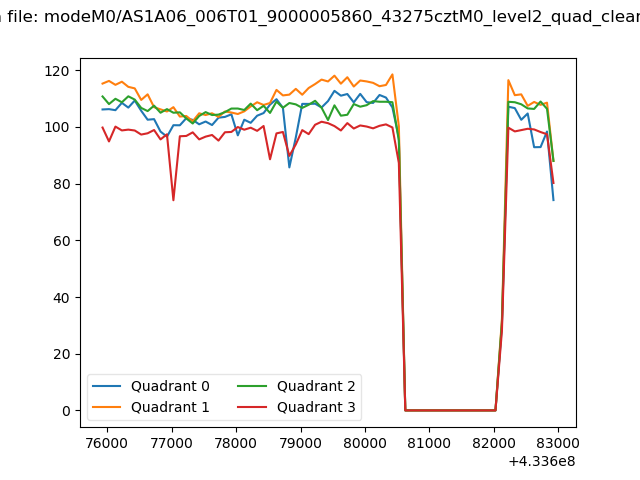 |
|
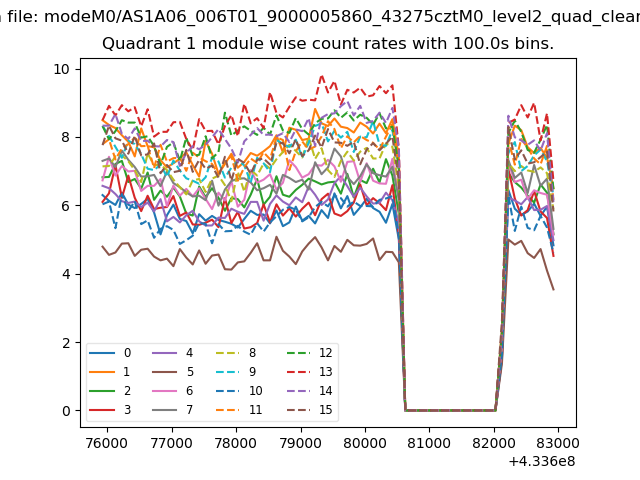
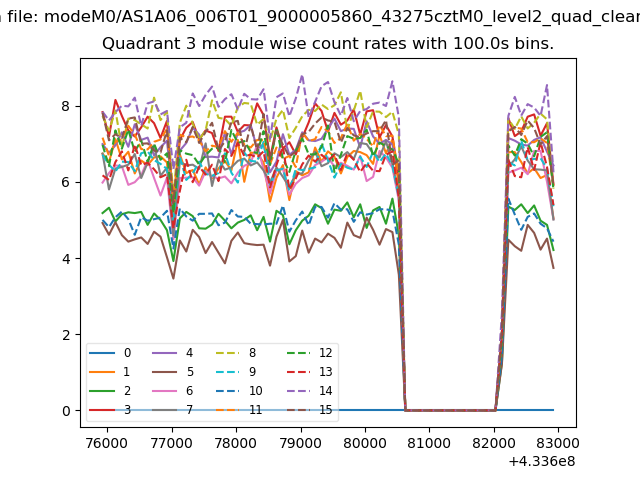
| Module-wise count rates for Quadrant A Data is divided into 100 sec bins |
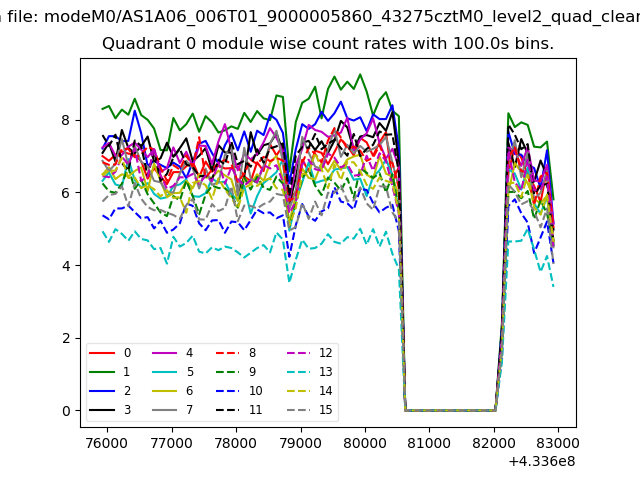 |
 |
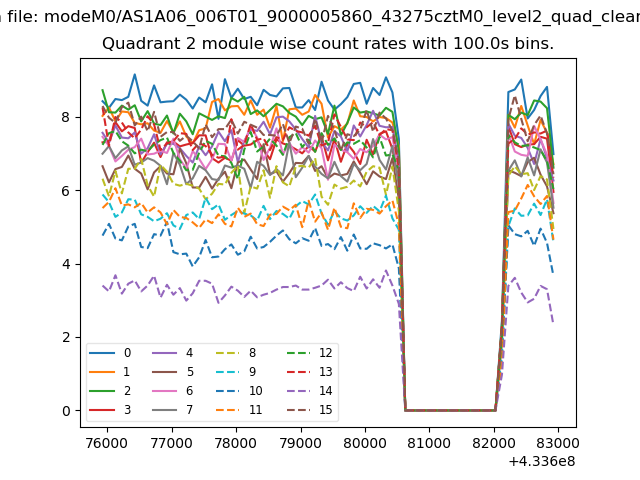
| Module-wise count rates for Quadrant B Data is divided into 100 sec bins |
 |
 |
| Module-wise count rates for Quadrant C Data is divided into 100 sec bins |
 |
 |
| Module-wise count rates for Quadrant D Data is divided into 100 sec bins |
 |
 |
| Parameter | Plot |
|---|---|
| CZT HV Monitor | 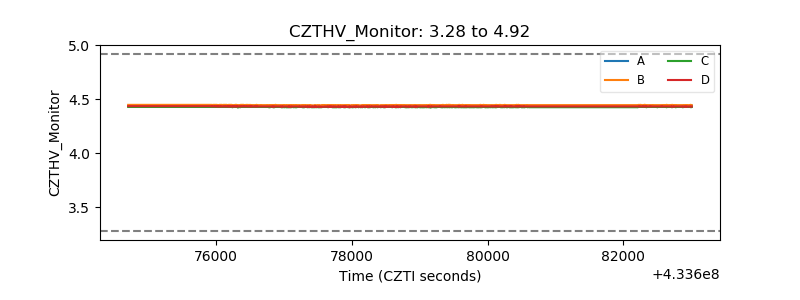 |
| D_VDD | 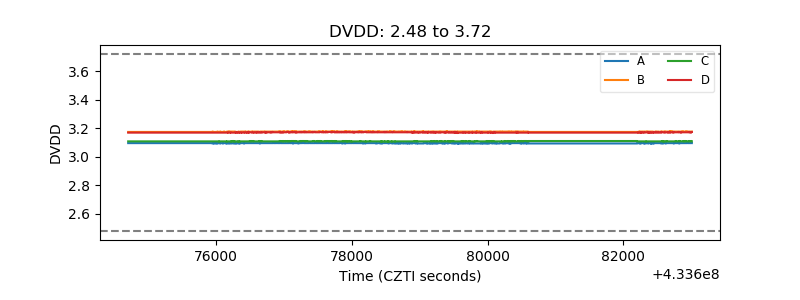 |
| Temperature 1 | 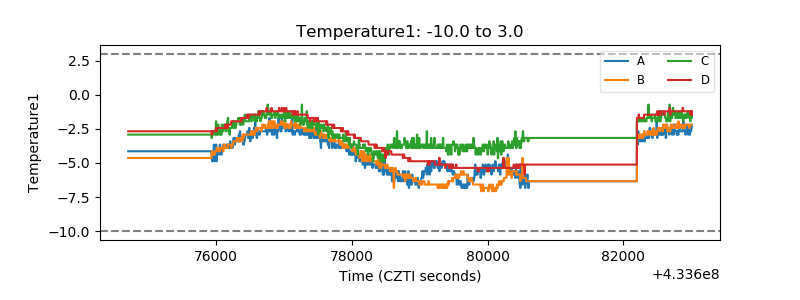 |
| Veto HV Monitor | 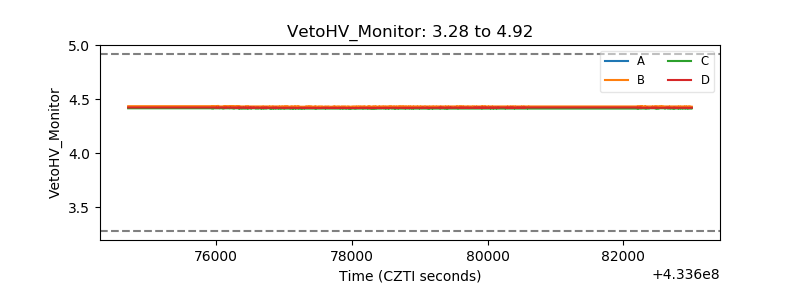 |
| Veto LLD | 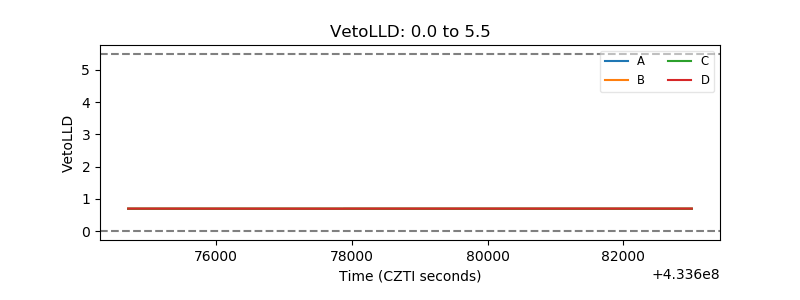 |
| Alpha Counter | 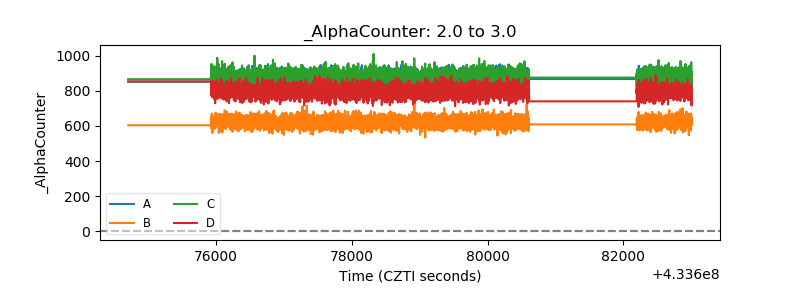 |
| _CPM_Rate | 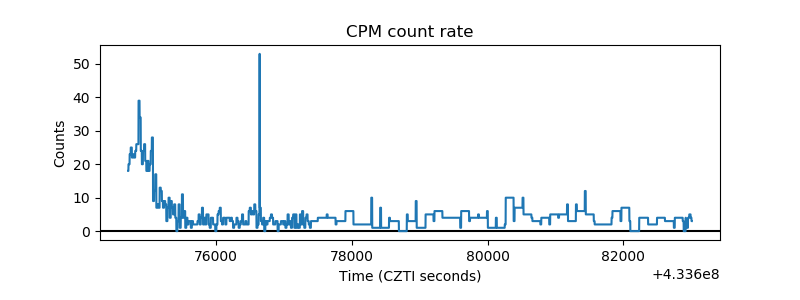 |
| CZT Counter | 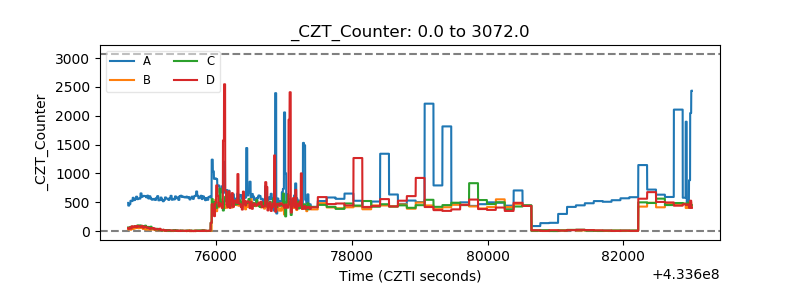 |
| +2.5 Volts monitor | 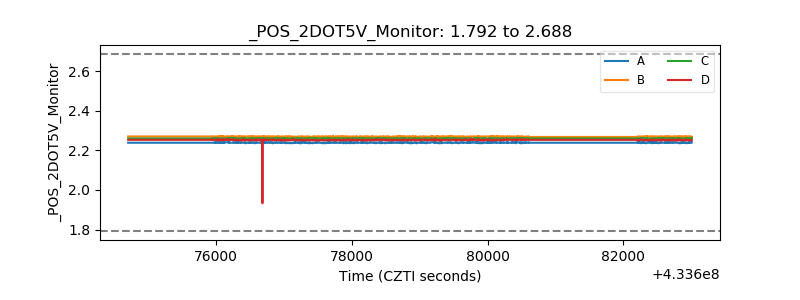 |
| +5 Volts monitor | 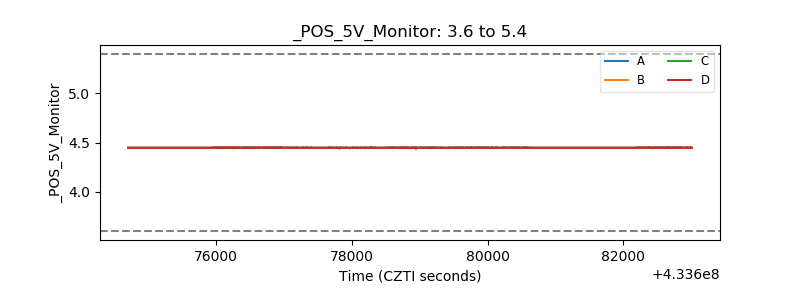 |
| _ROLL_ROT |  |
| _Roll_DEC | 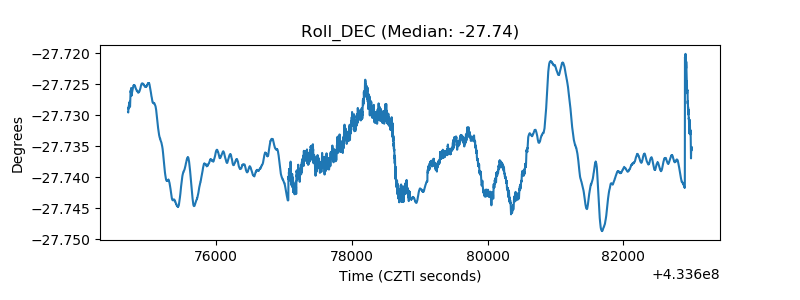 |
| _Roll_RA | 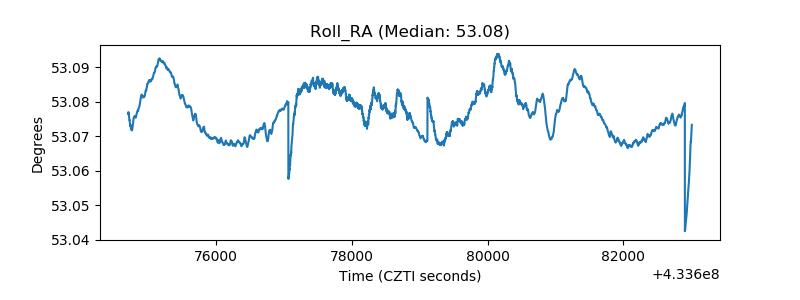 |
| Veto Counter | 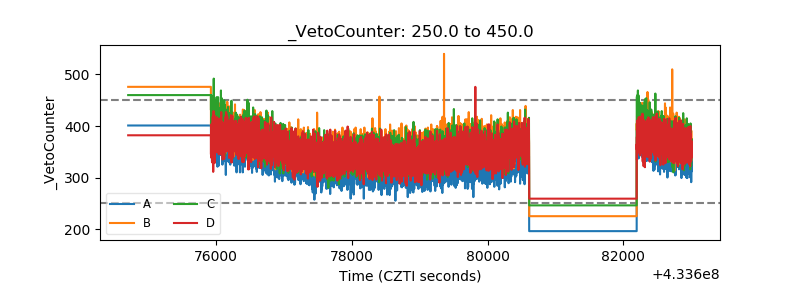 |