| Param | Original file | Final file |
|---|---|---|
| Filename | modeM0/AS1A06_006T01_9000005860_43276cztM0_level2.fits | modeM0/AS1A06_006T01_9000005860_43276cztM0_level2_quad_clean.evt |
| Size (bytes) | 383,088,960 | 95,310,720 |
| Size | 365.3 MB | 90.9 MB |
| Events in quadrant A | 3,767,670 | 624,293 |
| Events in quadrant B | 2,622,376 | 663,393 |
| Events in quadrant C | 2,840,698 | 639,897 |
| Events in quadrant D | 4,480,904 | 537,574 |
| Mode SS | |||
|---|---|---|---|
| Quadrant | BADHDUFLAG | Total packets | Discarded packets |
| A | 0 | 122 | 0 |
| B | 0 | 122 | 0 |
| C | 0 | 122 | 0 |
| D | 0 | 122 | 0 |
| Mode M9 | |||
|---|---|---|---|
| Quadrant | BADHDUFLAG | Total packets | Discarded packets |
| A | 0 | 22 | 0 |
| B | 0 | 23 | 0 |
| C | 0 | 23 | 0 |
| D | 0 | 23 | 0 |
| Mode M0 | |||
|---|---|---|---|
| Quadrant | BADHDUFLAG | Total packets | Discarded packets |
| A | 0 | 14853 | 2 |
| B | 0 | 12107 | 2 |
| C | 0 | 12259 | 2 |
| D | 0 | 17615 | 2 |
| Quadrant | Total seconds | Saturated seconds | Saturation percentage |
|---|---|---|---|
| A | 6023 | 194 | 3.220986% |
| B | 6023 | 10 | 0.166030% |
| C | 6023 | 15 | 0.249045% |
| D | 6023 | 612 | 10.161049% |
Noise dominated data is calculated using 1-second bins in cleaned event files. If a bin has >2000 counts, and if more than 50% of those come from <1% of pixels, then it is considered to be noise-dominated and hence unusable.
| Quadrant | # 1 sec bins | Bins with >0 counts | Bins with >2000 counts | High rate bins dominated by noise | Noise dominated (total time) | Noise dominated (detector-on time) | Marked lightcurve |
|---|---|---|---|---|---|---|---|
| A | 7366 | 6024 | 150 | 150 | 2.04% | 2.49% |  |
| B | 7366 | 6024 | 0 | 0 | 0.00% | 0.00% | 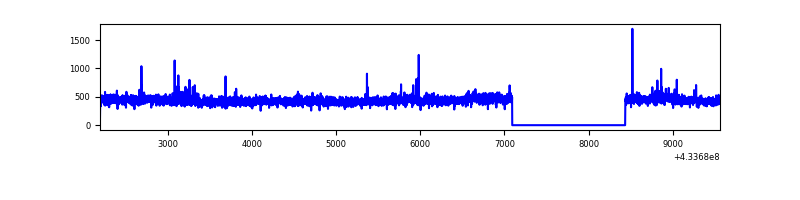 |
| C | 7366 | 6024 | 8 | 8 | 0.11% | 0.13% | 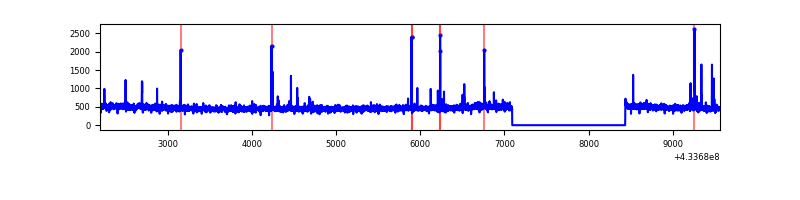 |
| D | 7366 | 6024 | 564 | 564 | 7.66% | 9.36% | 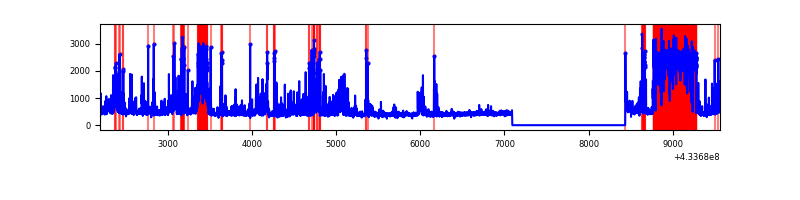 |
Top three noisy pixels from each quadrant. If the there are fewer than three noisy pixels in the level2.evt file, extra rows are filled as -1
| Pixel properties | Quadrant properties | ||||||
|---|---|---|---|---|---|---|---|
| Quadrant | DetID | PixID | Counts | Sigma | Mean | Median | Sigma |
| A | 10 | 83 | 639005 | 4758.89 | 646 | 630 | 134.1 |
| A | 15 | 237 | 564635 | 4204.48 | 646 | 630 | 134.1 |
| A | 13 | 248 | 43854 | 322.22 | 646 | 630 | 134.1 |
| B | 0 | 189 | 17699 | 133.53 | 651 | 634 | 127.8 |
| B | 12 | 111 | 16241 | 122.12 | 651 | 634 | 127.8 |
| B | 11 | 111 | 15291 | 114.69 | 651 | 634 | 127.8 |
| C | 15 | 214 | 249123 | 1640.54 | 646 | 648 | 151.5 |
| C | 14 | 254 | 63472 | 414.79 | 646 | 648 | 151.5 |
| C | 7 | 220 | 5547 | 32.34 | 646 | 648 | 151.5 |
| D | 12 | 233 | 1440299 | 9539.45 | 614 | 597 | 150.9 |
| D | 1 | 52 | 380776 | 2519.06 | 614 | 597 | 150.9 |
| D | 2 | 249 | 143061 | 943.97 | 614 | 597 | 150.9 |
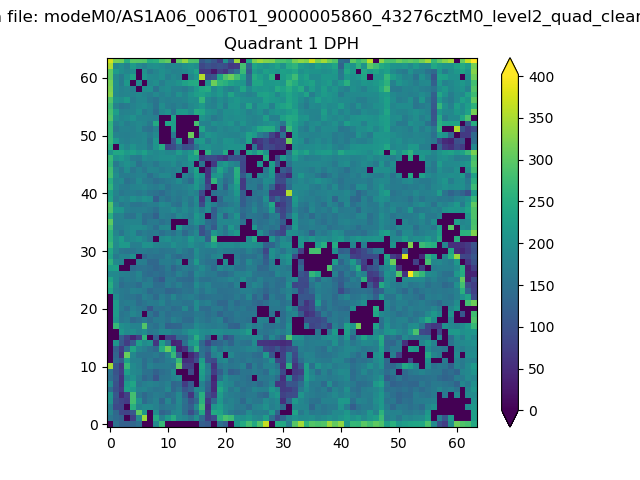
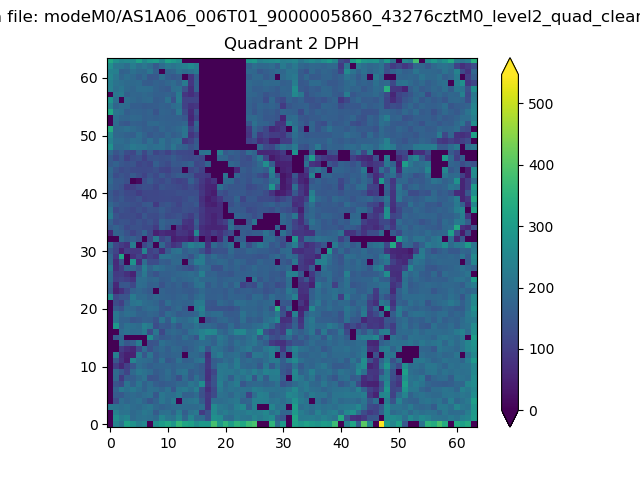
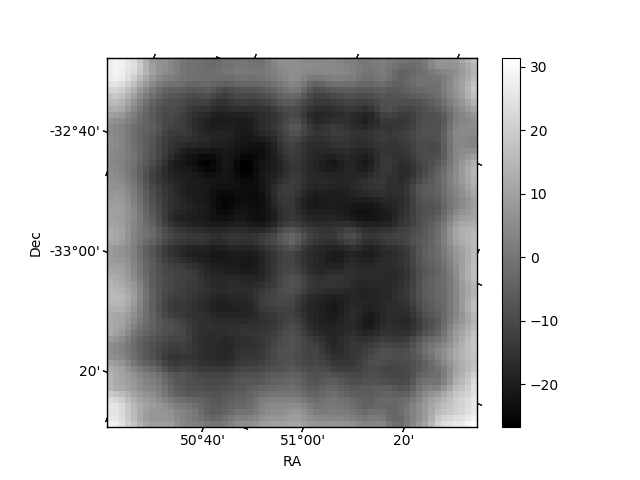
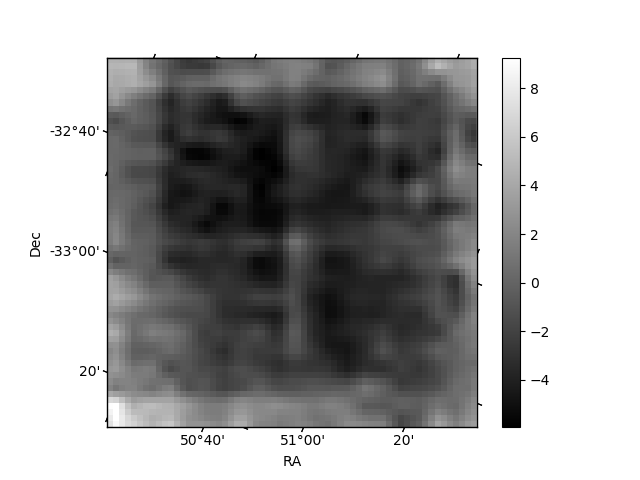
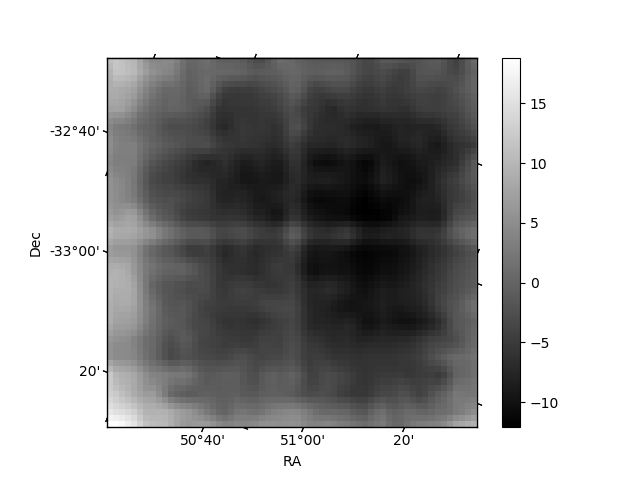
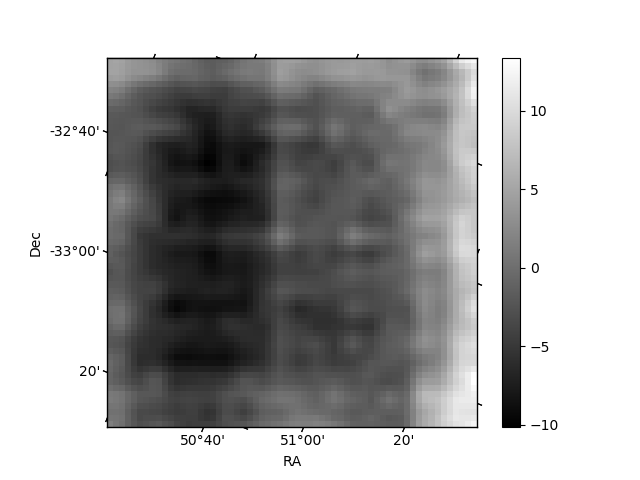
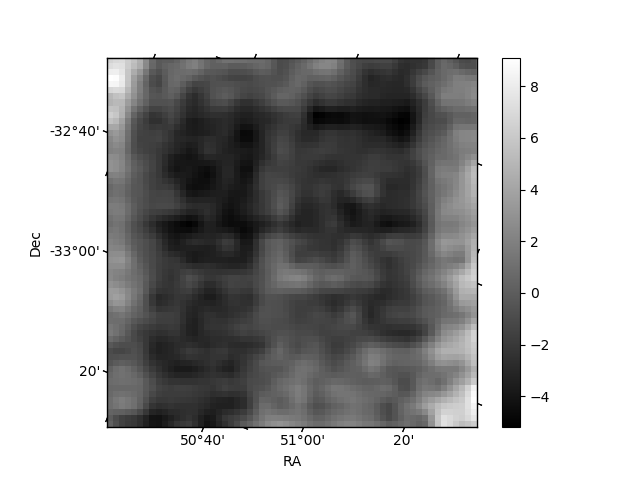
Histogram calculated using DETX and DETY for each event in the final _common_clean file
| Quadrant A | 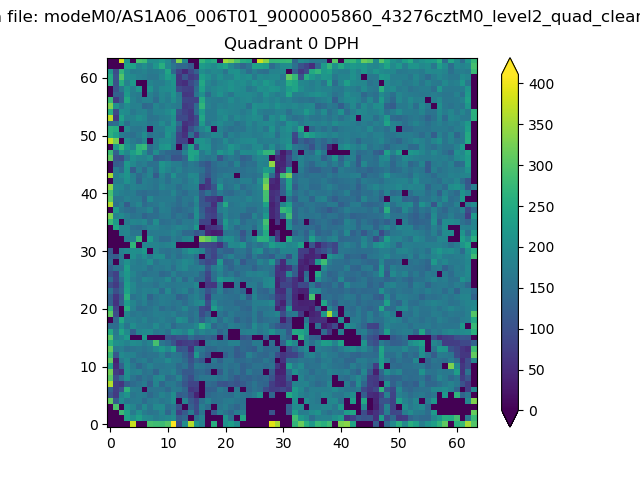 |
 |
Quadrant B |
|---|---|---|---|
| Quadrant D | 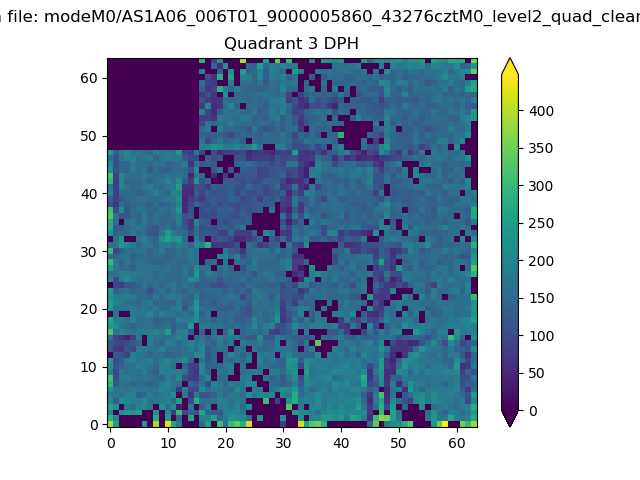 |
 |
Quadrant C |
| Plot type | Count rate plots | Images |
|---|---|---|
| Comparison with Poisson distribution Blue bars denote a histogram of data divided into 1 sec bins. Red curve is a Poisson curve with rate = median count rate of data. |
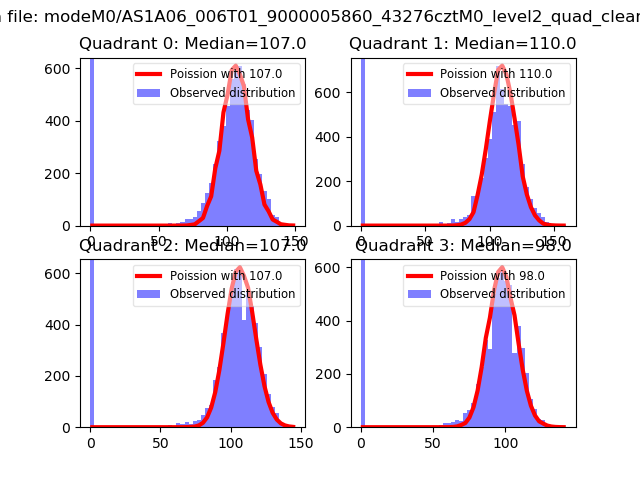 |
 |
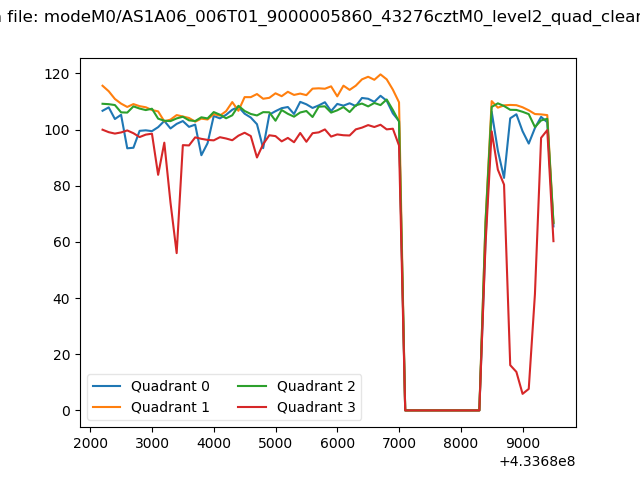
| Quadrant-wise count rates Data is divided into 100 sec bins |
 |
|
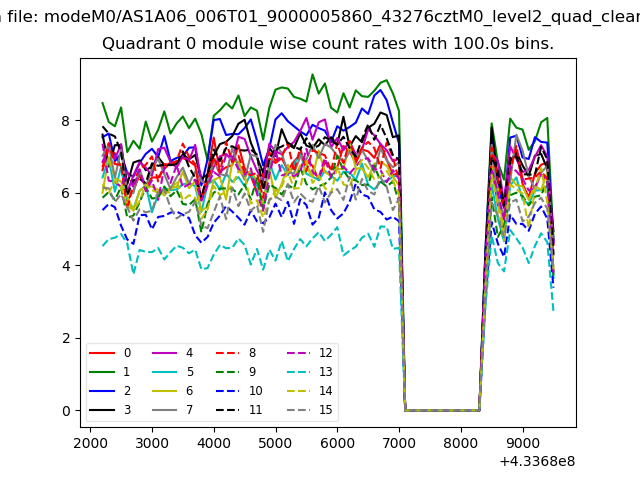
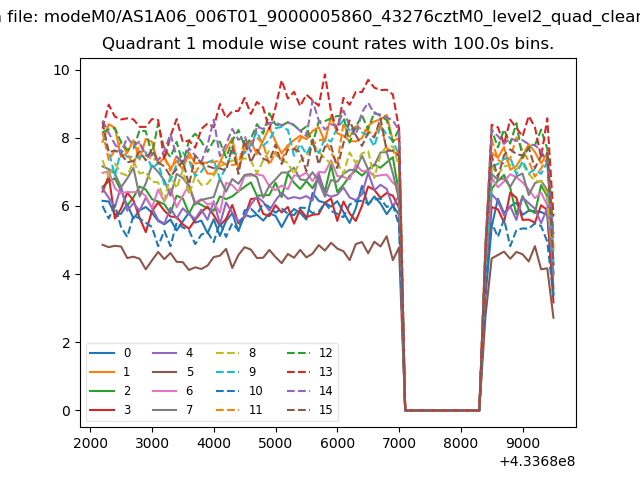
| Module-wise count rates for Quadrant A Data is divided into 100 sec bins |
 |
 |
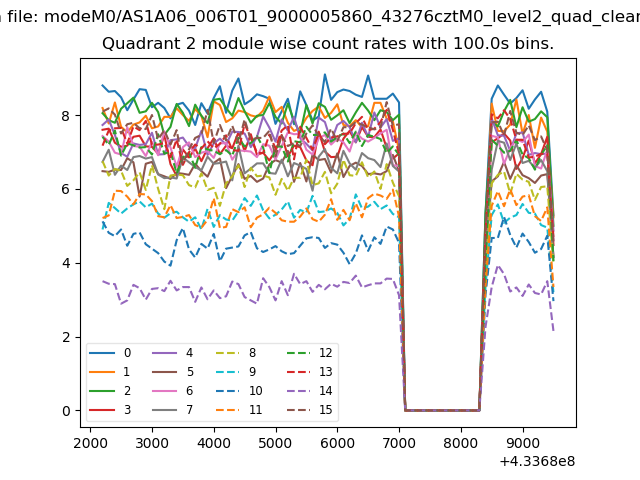
| Module-wise count rates for Quadrant B Data is divided into 100 sec bins |
 |
 |
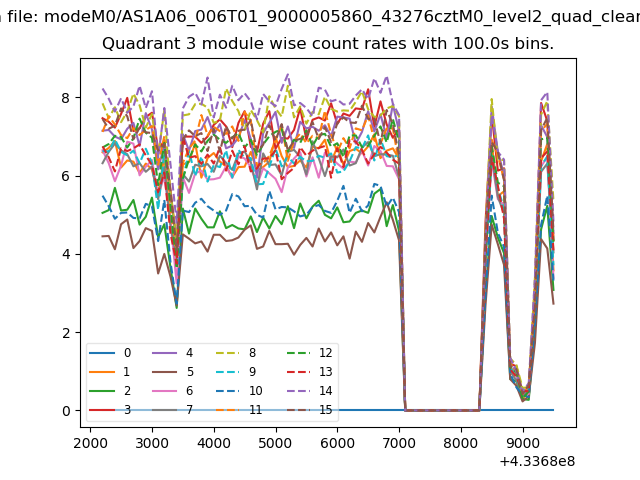
| Module-wise count rates for Quadrant C Data is divided into 100 sec bins |
 |
 |
| Module-wise count rates for Quadrant D Data is divided into 100 sec bins |
 |
 |
| Parameter | Plot |
|---|---|
| CZT HV Monitor | 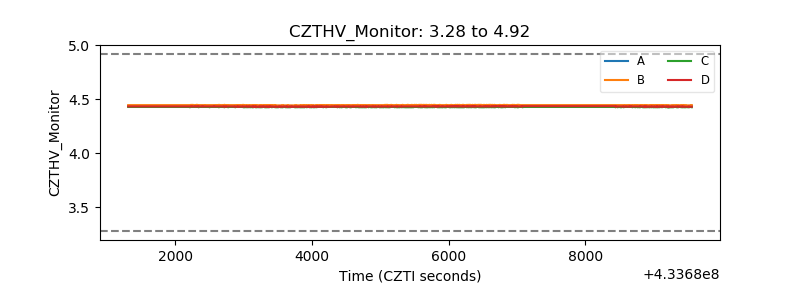 |
| D_VDD | 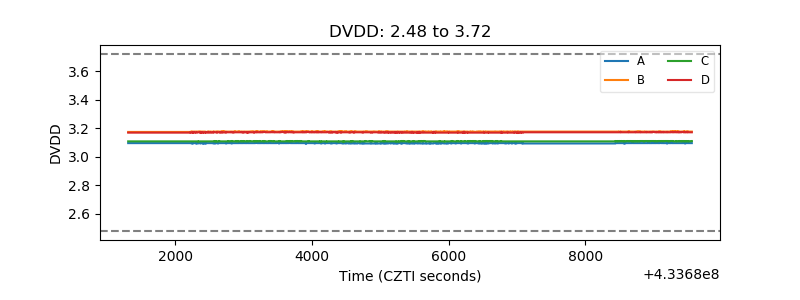 |
| Temperature 1 | 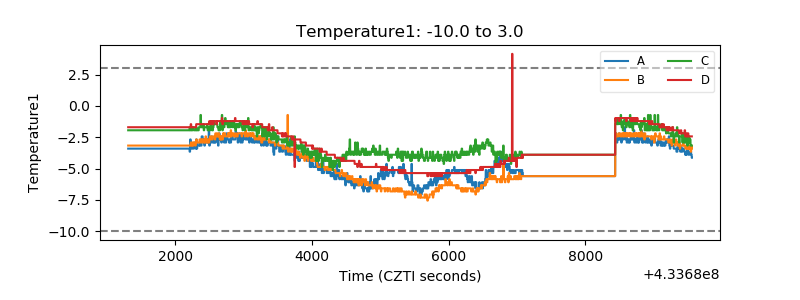 |
| Veto HV Monitor | 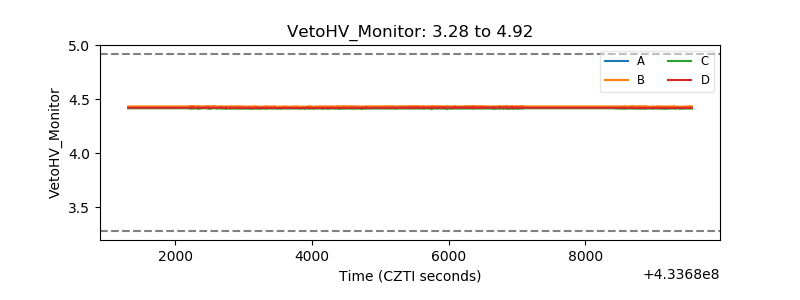 |
| Veto LLD | 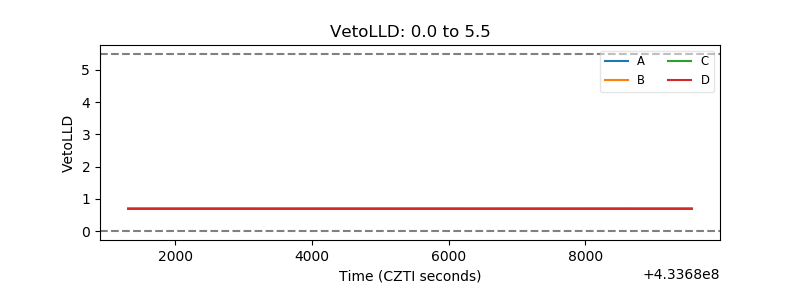 |
| Alpha Counter | 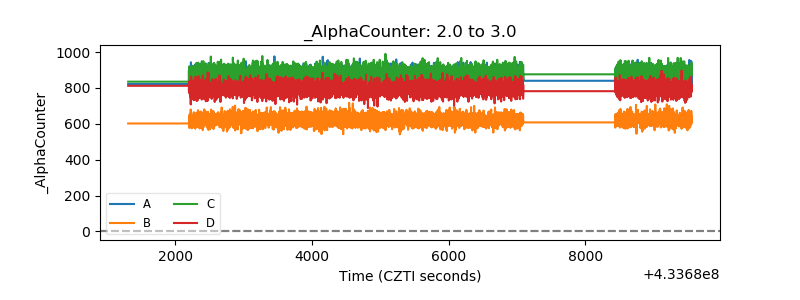 |
| _CPM_Rate | 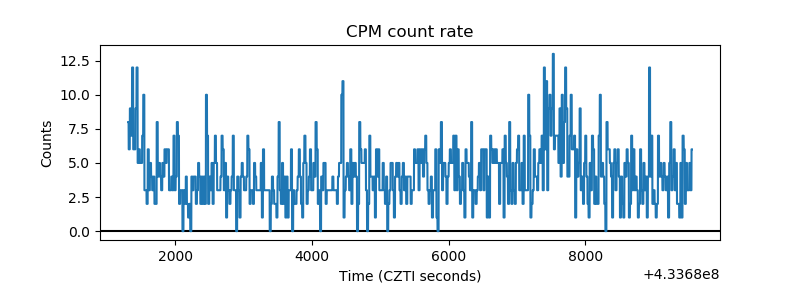 |
| CZT Counter | 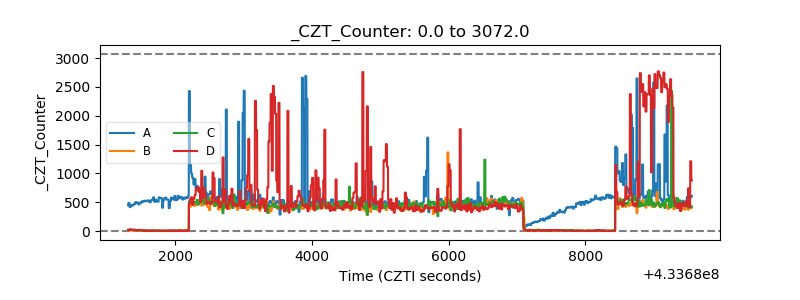 |
| +2.5 Volts monitor | 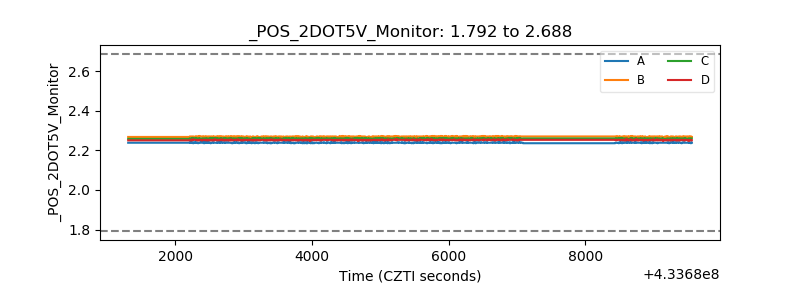 |
| +5 Volts monitor | 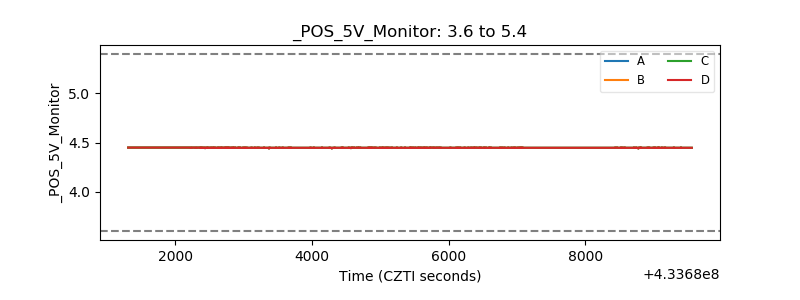 |
| _ROLL_ROT | 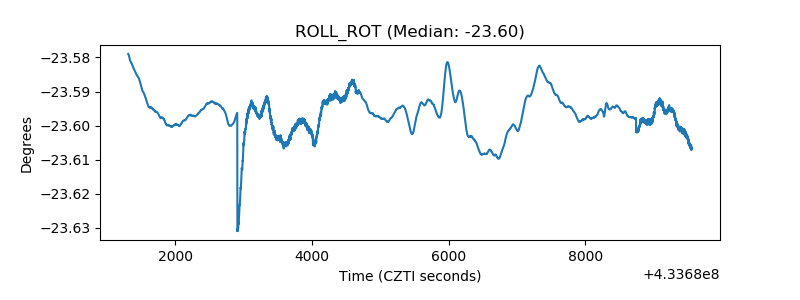 |
| _Roll_DEC | 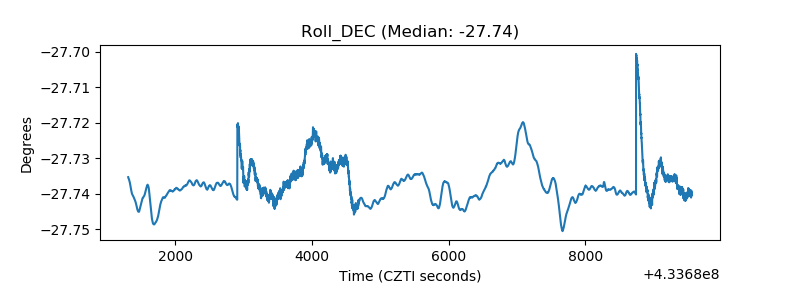 |
| _Roll_RA | 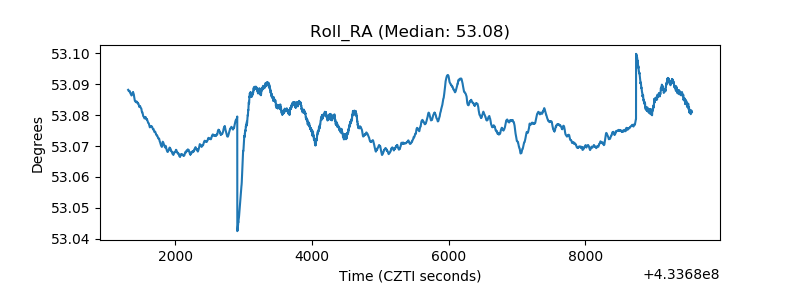 |
| Veto Counter | 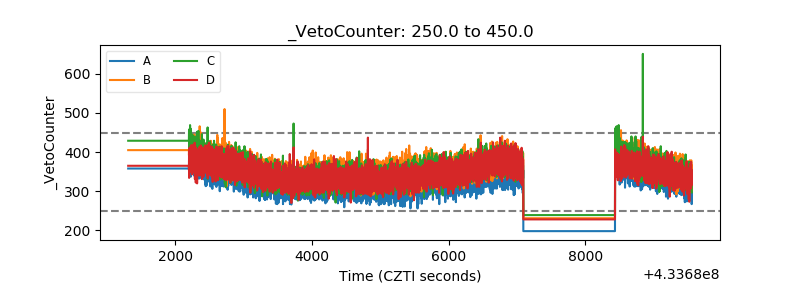 |