| Param | Original file | Final file |
|---|---|---|
| Filename | modeM0/AS1A06_006T01_9000005860_43280cztM0_level2.fits | modeM0/AS1A06_006T01_9000005860_43280cztM0_level2_quad_clean.evt |
| Size (bytes) | 706,296,960 | 186,240,960 |
| Size | 673.6 MB | 177.6 MB |
| Events in quadrant A | 7,006,618 | 1,222,733 |
| Events in quadrant B | 5,247,364 | 1,290,898 |
| Events in quadrant C | 5,897,233 | 1,230,659 |
| Events in quadrant D | 7,080,903 | 1,080,590 |
| Mode SS | |||
|---|---|---|---|
| Quadrant | BADHDUFLAG | Total packets | Discarded packets |
| A | 0 | 242 | 0 |
| B | 0 | 242 | 0 |
| C | 0 | 242 | 0 |
| D | 0 | 242 | 0 |
| Mode M9 | |||
|---|---|---|---|
| Quadrant | BADHDUFLAG | Total packets | Discarded packets |
| A | 0 | 31 | 0 |
| B | 0 | 32 | 0 |
| C | 0 | 32 | 0 |
| D | 0 | 32 | 0 |
| Mode M0 | |||
|---|---|---|---|
| Quadrant | BADHDUFLAG | Total packets | Discarded packets |
| A | 0 | 28090 | 3 |
| B | 0 | 23974 | 3 |
| C | 0 | 25166 | 3 |
| D | 0 | 29635 | 3 |
| Quadrant | Total seconds | Saturated seconds | Saturation percentage |
|---|---|---|---|
| A | 11760 | 310 | 2.636054% |
| B | 11760 | 41 | 0.348639% |
| C | 11759 | 94 | 0.799388% |
| D | 11759 | 606 | 5.153499% |
Noise dominated data is calculated using 1-second bins in cleaned event files. If a bin has >2000 counts, and if more than 50% of those come from <1% of pixels, then it is considered to be noise-dominated and hence unusable.
| Quadrant | # 1 sec bins | Bins with >0 counts | Bins with >2000 counts | High rate bins dominated by noise | Noise dominated (total time) | Noise dominated (detector-on time) | Marked lightcurve |
|---|---|---|---|---|---|---|---|
| A | 14384 | 11762 | 225 | 225 | 1.56% | 1.91% | 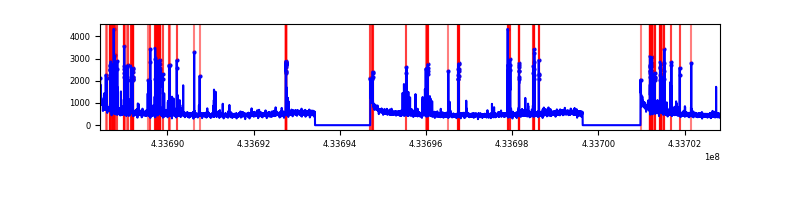 |
| B | 14384 | 11762 | 21 | 21 | 0.15% | 0.18% | 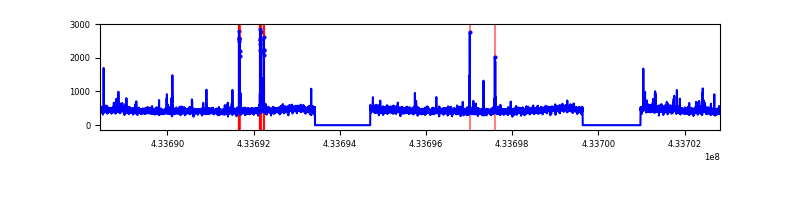 |
| C | 14383 | 11761 | 80 | 80 | 0.56% | 0.68% | 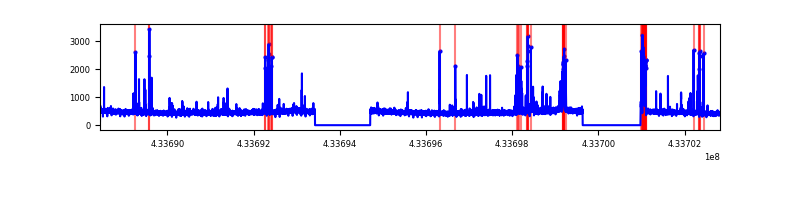 |
| D | 14383 | 11761 | 559 | 559 | 3.89% | 4.75% | 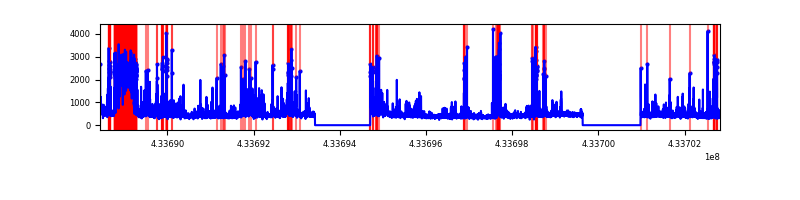 |
Top three noisy pixels from each quadrant. If the there are fewer than three noisy pixels in the level2.evt file, extra rows are filled as -1
| Pixel properties | Quadrant properties | ||||||
|---|---|---|---|---|---|---|---|
| Quadrant | DetID | PixID | Counts | Sigma | Mean | Median | Sigma |
| A | 10 | 83 | 1141795 | 4401.82 | 1256 | 1229 | 259.1 |
| A | 15 | 237 | 925145 | 3565.69 | 1256 | 1229 | 259.1 |
| A | 13 | 248 | 54715 | 206.42 | 1256 | 1229 | 259.1 |
| B | 5 | 172 | 98287 | 392.11 | 1267 | 1232 | 247.5 |
| B | 0 | 189 | 95289 | 379.99 | 1267 | 1232 | 247.5 |
| B | 12 | 111 | 32017 | 124.37 | 1267 | 1232 | 247.5 |
| C | 15 | 214 | 483852 | 1654.92 | 1246 | 1252 | 291.6 |
| C | 14 | 254 | 311769 | 1064.82 | 1246 | 1252 | 291.6 |
| C | 2 | 16 | 151153 | 514.04 | 1246 | 1252 | 291.6 |
| D | 12 | 233 | 1311186 | 4412.92 | 1210 | 1174 | 296.9 |
| D | 1 | 52 | 389536 | 1308.24 | 1210 | 1174 | 296.9 |
| D | 12 | 6 | 312160 | 1047.59 | 1210 | 1174 | 296.9 |
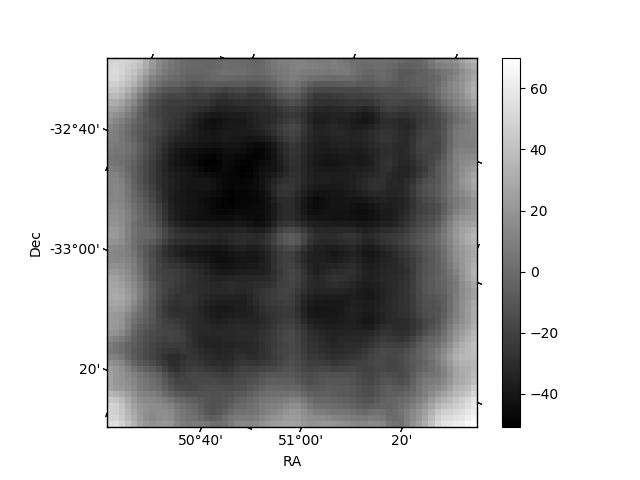
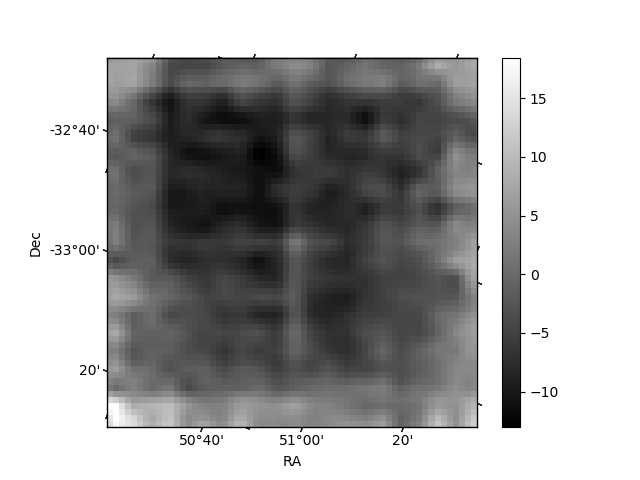
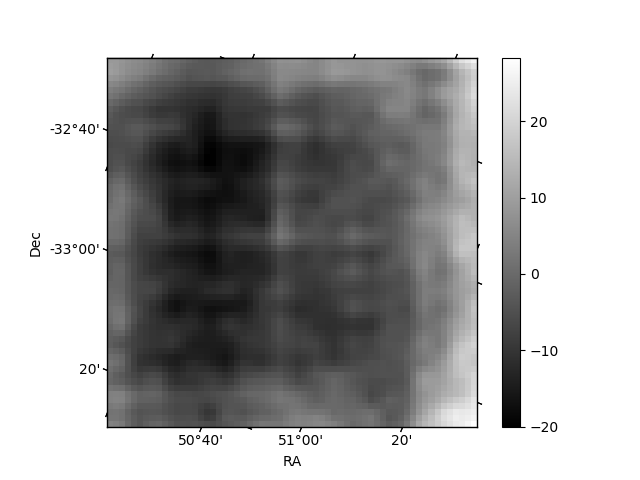
Histogram calculated using DETX and DETY for each event in the final _common_clean file
| Quadrant A | 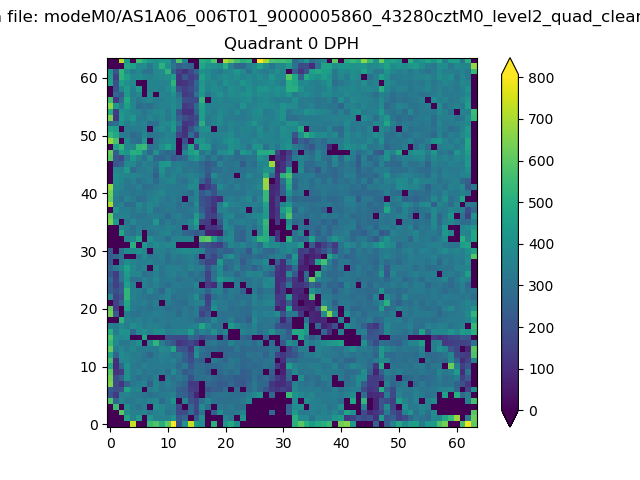 |
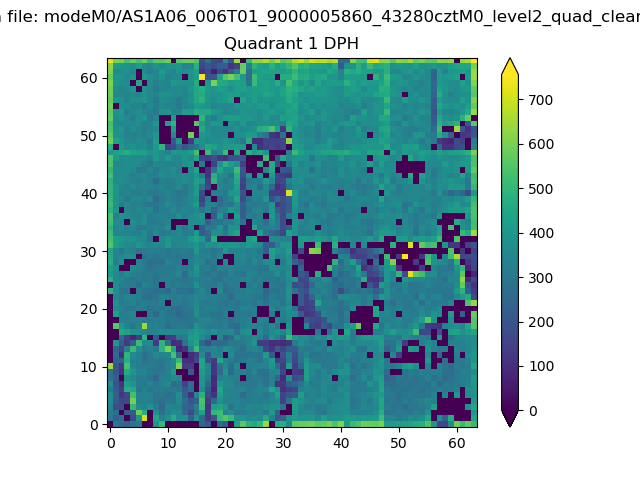 |
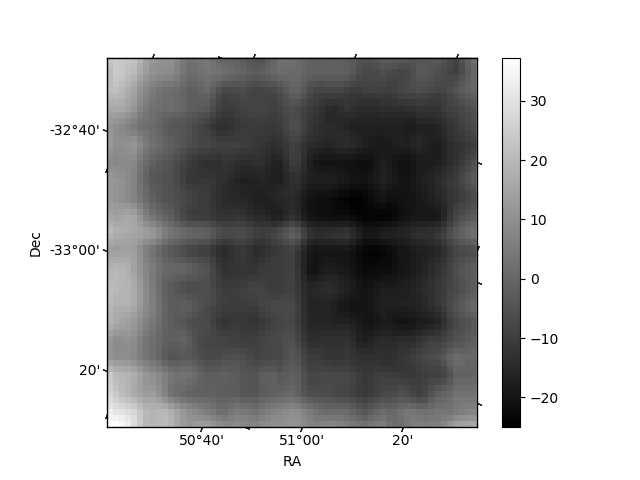
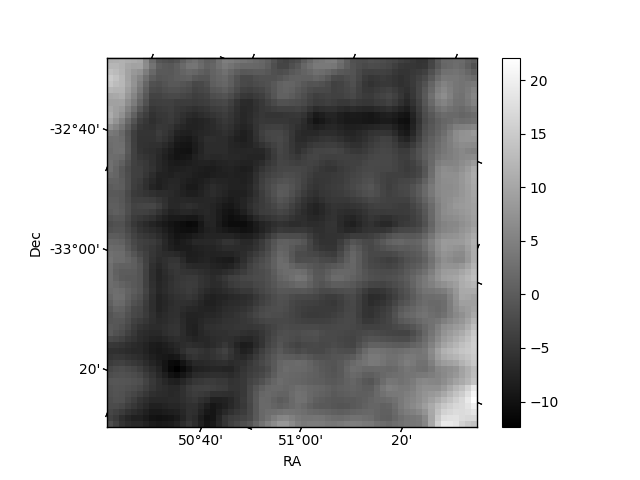
Quadrant B |
|---|---|---|---|
| Quadrant D | 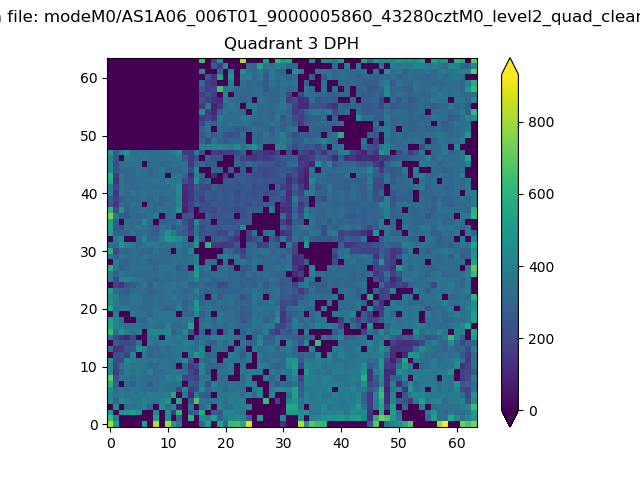 |
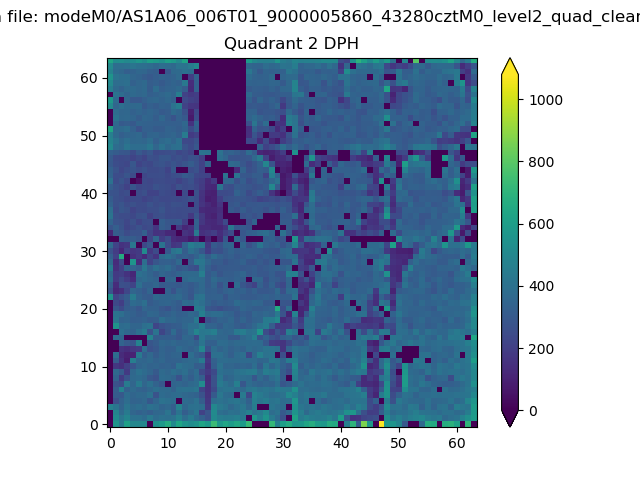 |
Quadrant C |
| Plot type | Count rate plots | Images |
|---|---|---|
| Comparison with Poisson distribution Blue bars denote a histogram of data divided into 1 sec bins. Red curve is a Poisson curve with rate = median count rate of data. |
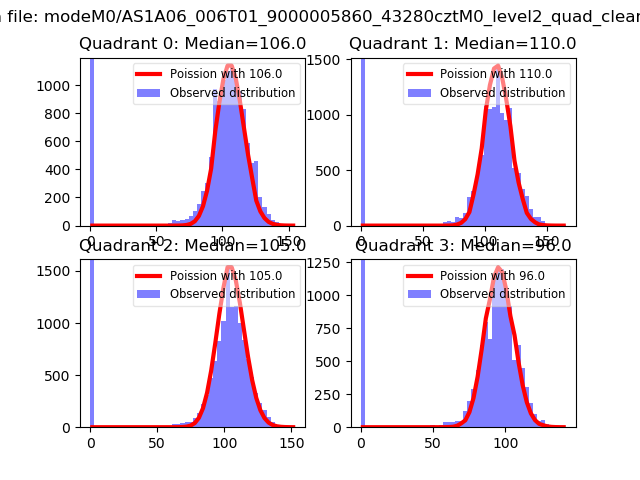 |
 |
| Quadrant-wise count rates Data is divided into 100 sec bins |
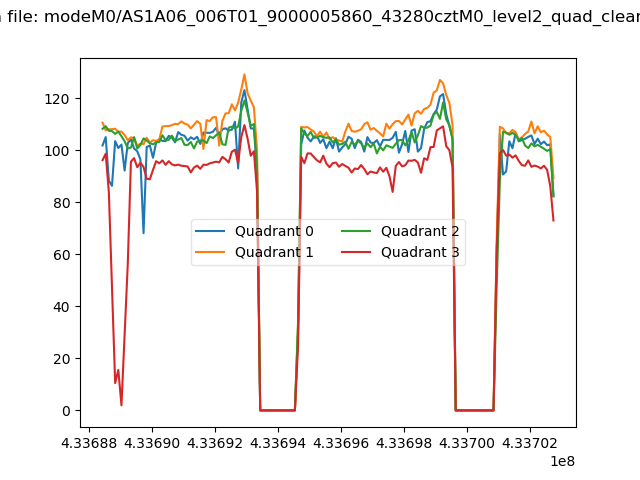 |
|
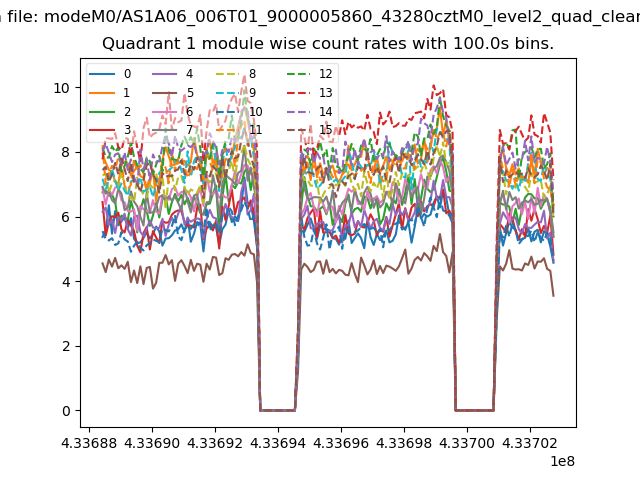
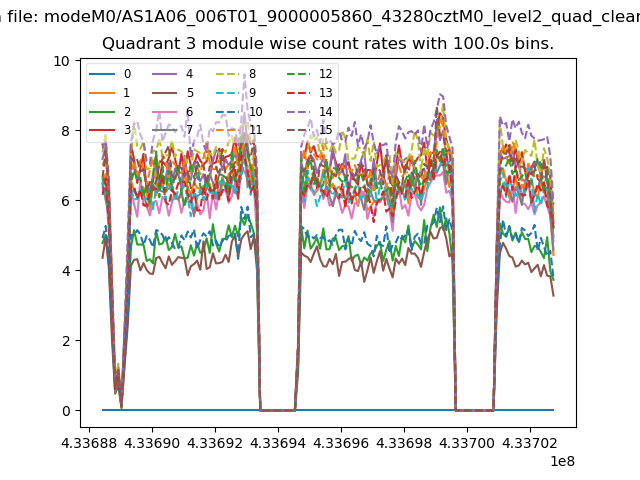
| Module-wise count rates for Quadrant A Data is divided into 100 sec bins |
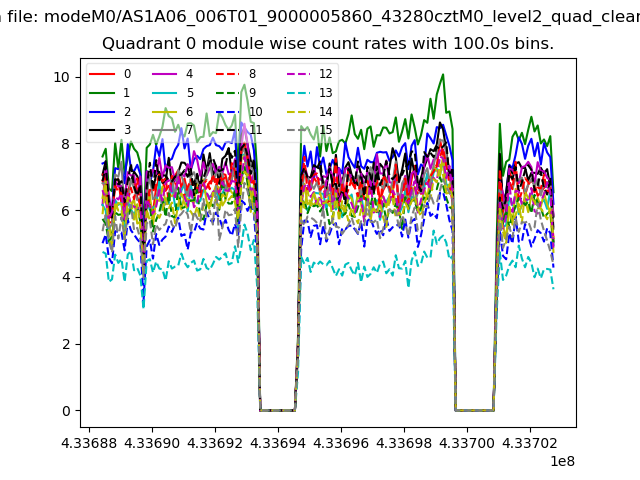 |
 |
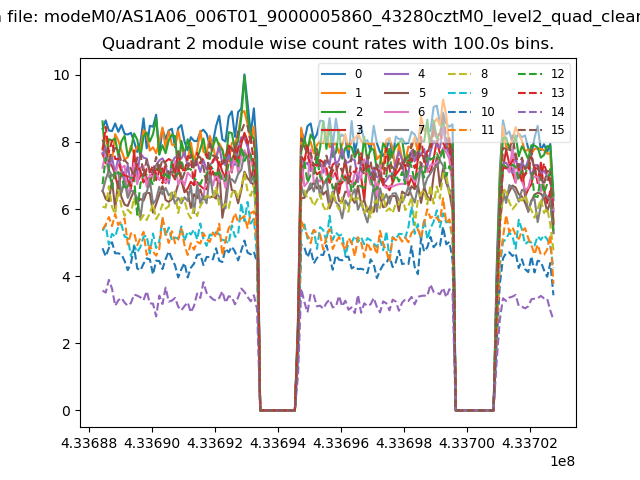
| Module-wise count rates for Quadrant B Data is divided into 100 sec bins |
 |
 |
| Module-wise count rates for Quadrant C Data is divided into 100 sec bins |
 |
 |
| Module-wise count rates for Quadrant D Data is divided into 100 sec bins |
 |
 |
| Parameter | Plot |
|---|---|
| CZT HV Monitor | 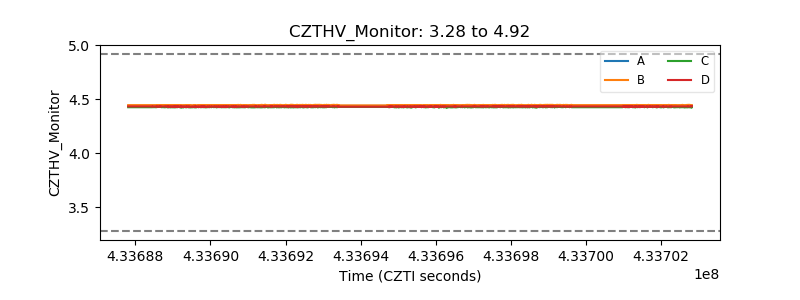 |
| D_VDD | 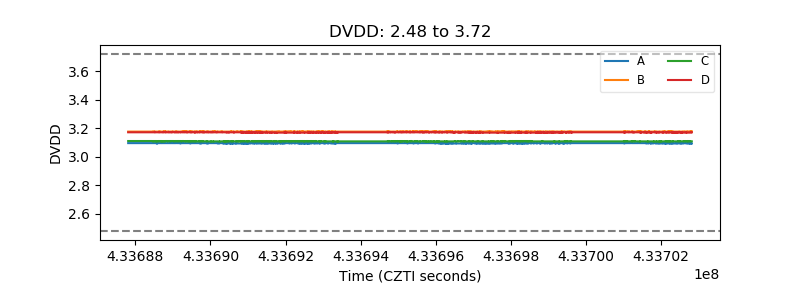 |
| Temperature 1 | 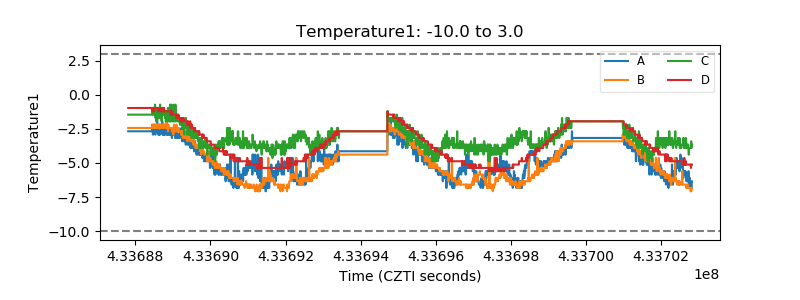 |
| Veto HV Monitor | 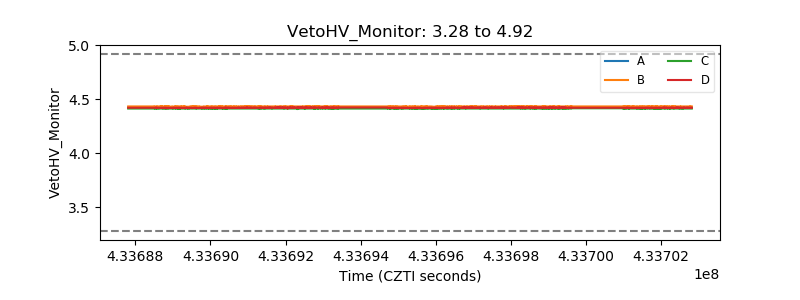 |
| Veto LLD | 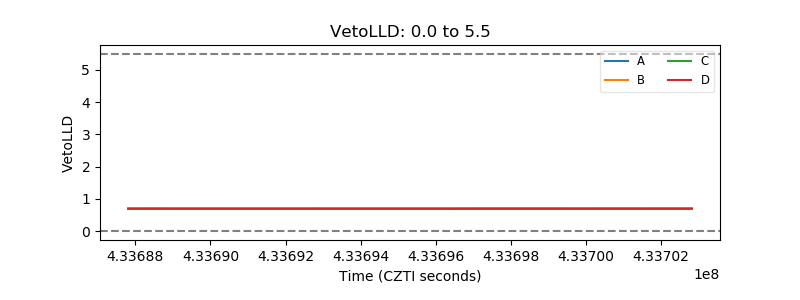 |
| Alpha Counter | 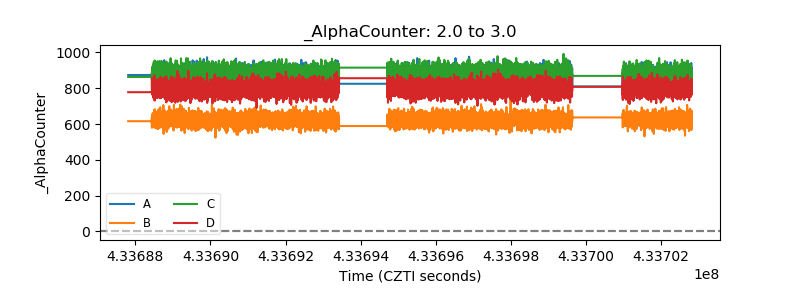 |
| _CPM_Rate | 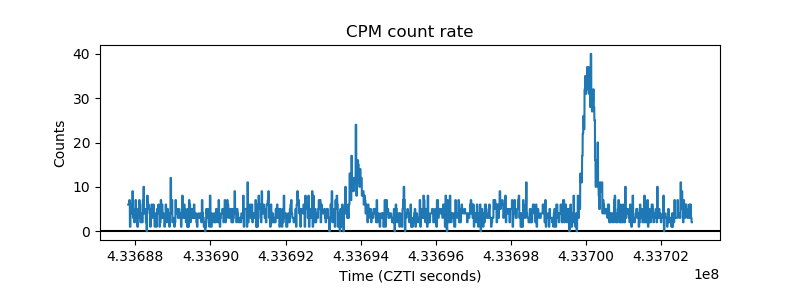 |
| CZT Counter | 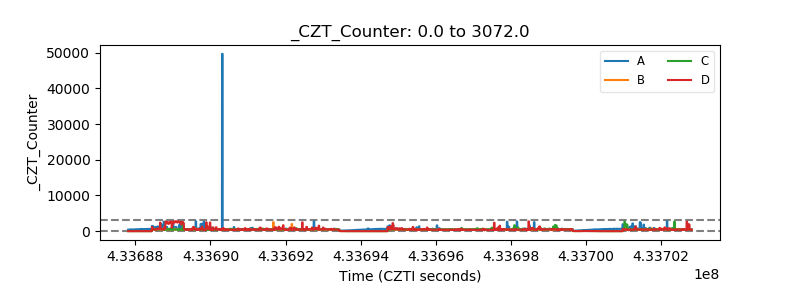 |
| +2.5 Volts monitor | 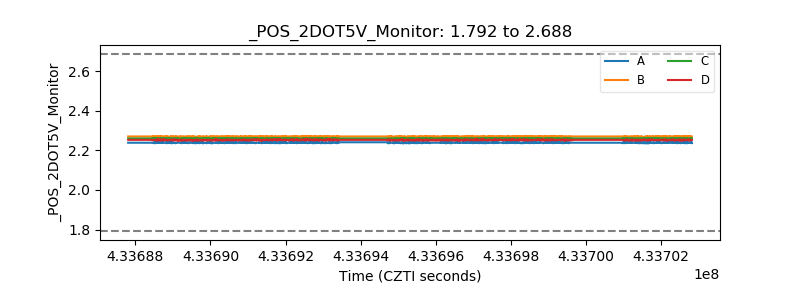 |
| +5 Volts monitor | 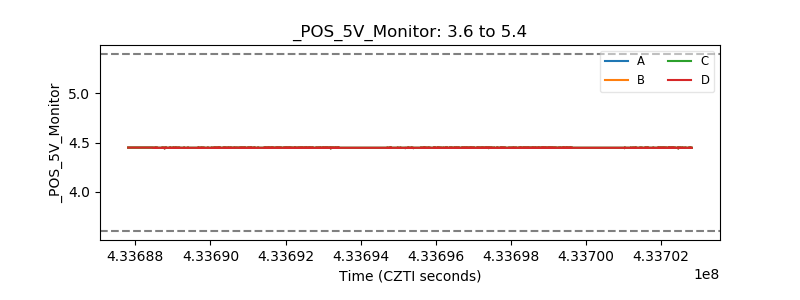 |
| _ROLL_ROT | 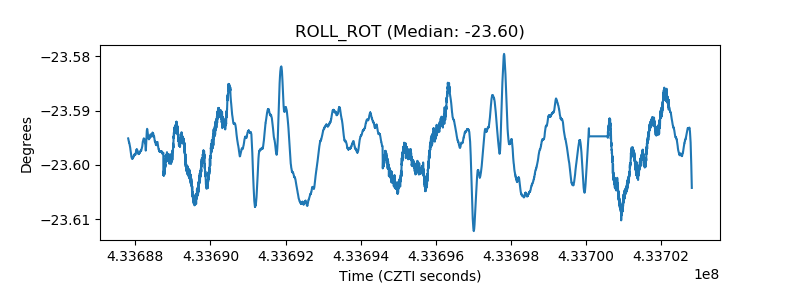 |
| _Roll_DEC | 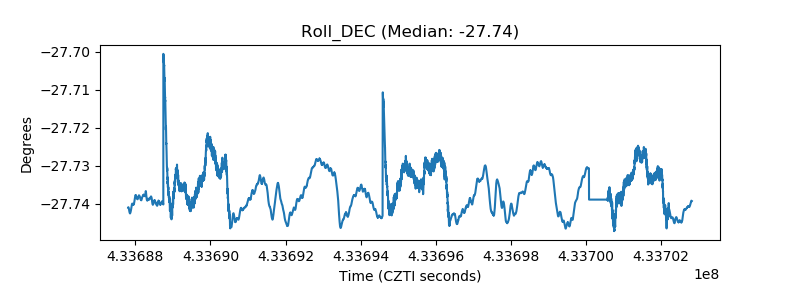 |
| _Roll_RA | 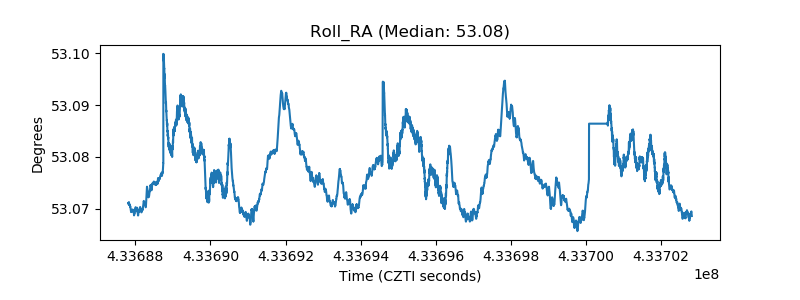 |
| Veto Counter | 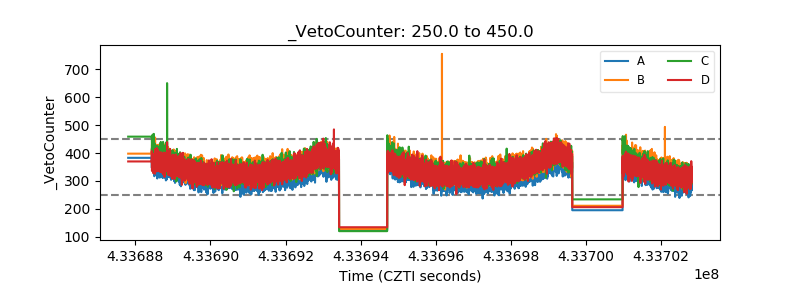 |