| Param | Original file | Final file |
|---|---|---|
| Filename | modeM0/AS1A06_006T01_9000005860_43283cztM0_level2.fits | modeM0/AS1A06_006T01_9000005860_43283cztM0_level2_quad_clean.evt |
| Size (bytes) | 809,864,640 | 218,534,400 |
| Size | 772.3 MB | 208.4 MB |
| Events in quadrant A | 8,152,594 | 1,413,368 |
| Events in quadrant B | 6,056,393 | 1,528,661 |
| Events in quadrant C | 7,645,986 | 1,410,390 |
| Events in quadrant D | 7,060,504 | 1,317,812 |
| Mode SS | |||
|---|---|---|---|
| Quadrant | BADHDUFLAG | Total packets | Discarded packets |
| A | 0 | 280 | 0 |
| B | 0 | 280 | 0 |
| C | 0 | 280 | 0 |
| D | 0 | 280 | 0 |
| Mode M9 | |||
|---|---|---|---|
| Quadrant | BADHDUFLAG | Total packets | Discarded packets |
| A | 0 | 47 | 0 |
| B | 0 | 47 | 0 |
| C | 0 | 47 | 0 |
| D | 0 | 47 | 0 |
| Mode M0 | |||
|---|---|---|---|
| Quadrant | BADHDUFLAG | Total packets | Discarded packets |
| A | 0 | 32937 | 3 |
| B | 0 | 27795 | 3 |
| C | 0 | 31451 | 3 |
| D | 0 | 31221 | 3 |
| Quadrant | Total seconds | Saturated seconds | Saturation percentage |
|---|---|---|---|
| A | 13706 | 414 | 3.020575% |
| B | 13706 | 18 | 0.131329% |
| C | 13706 | 396 | 2.889246% |
| D | 13706 | 163 | 1.189260% |
Noise dominated data is calculated using 1-second bins in cleaned event files. If a bin has >2000 counts, and if more than 50% of those come from <1% of pixels, then it is considered to be noise-dominated and hence unusable.
| Quadrant | # 1 sec bins | Bins with >0 counts | Bins with >2000 counts | High rate bins dominated by noise | Noise dominated (total time) | Noise dominated (detector-on time) | Marked lightcurve |
|---|---|---|---|---|---|---|---|
| A | 18365 | 13709 | 332 | 332 | 1.81% | 2.42% | 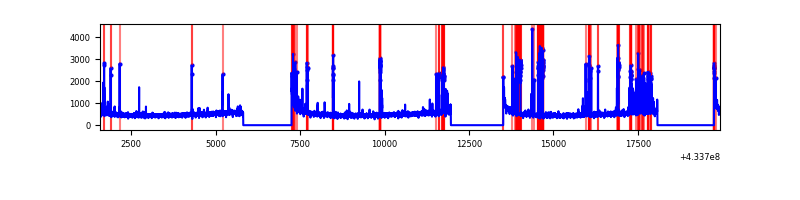 |
| B | 18365 | 13709 | 7 | 7 | 0.04% | 0.05% | 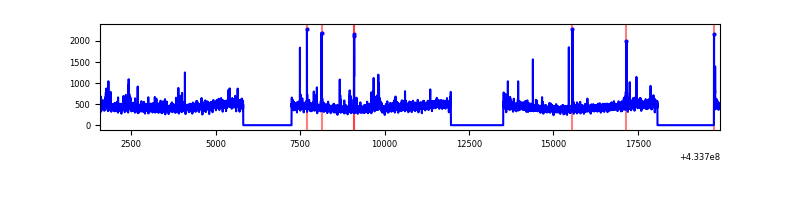 |
| C | 18365 | 13709 | 368 | 368 | 2.00% | 2.68% | 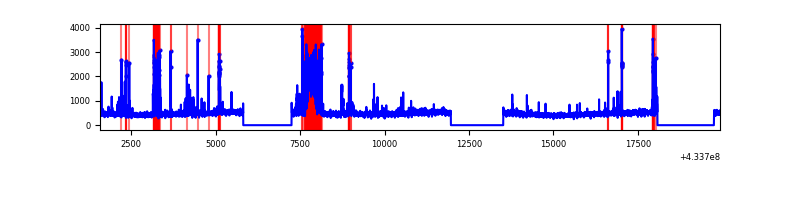 |
| D | 18365 | 13709 | 169 | 169 | 0.92% | 1.23% | 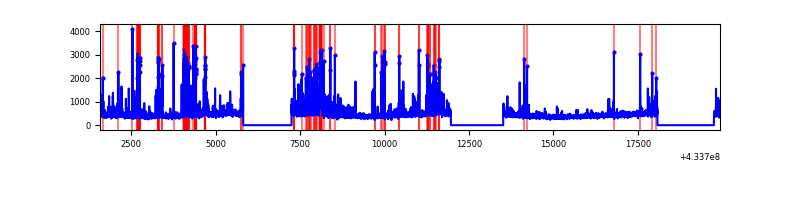 |
Top three noisy pixels from each quadrant. If the there are fewer than three noisy pixels in the level2.evt file, extra rows are filled as -1
| Pixel properties | Quadrant properties | ||||||
|---|---|---|---|---|---|---|---|
| Quadrant | DetID | PixID | Counts | Sigma | Mean | Median | Sigma |
| A | 10 | 83 | 1185104 | 3957.69 | 1459 | 1430 | 299.1 |
| A | 15 | 237 | 1005951 | 3358.68 | 1459 | 1430 | 299.1 |
| A | 13 | 248 | 312587 | 1040.37 | 1459 | 1430 | 299.1 |
| B | 0 | 189 | 117697 | 405.66 | 1479 | 1437 | 286.6 |
| B | 5 | 172 | 63464 | 216.43 | 1479 | 1437 | 286.6 |
| B | 12 | 111 | 37291 | 125.1 | 1479 | 1437 | 286.6 |
| C | 14 | 254 | 1386611 | 4083.33 | 1442 | 1450 | 339.2 |
| C | 15 | 214 | 556432 | 1636.04 | 1442 | 1450 | 339.2 |
| C | 3 | 233 | 29468 | 82.59 | 1442 | 1450 | 339.2 |
| D | 1 | 52 | 559720 | 1579.4 | 1446 | 1408 | 353.5 |
| D | 12 | 6 | 482107 | 1359.85 | 1446 | 1408 | 353.5 |
| D | 2 | 249 | 244901 | 688.82 | 1446 | 1408 | 353.5 |
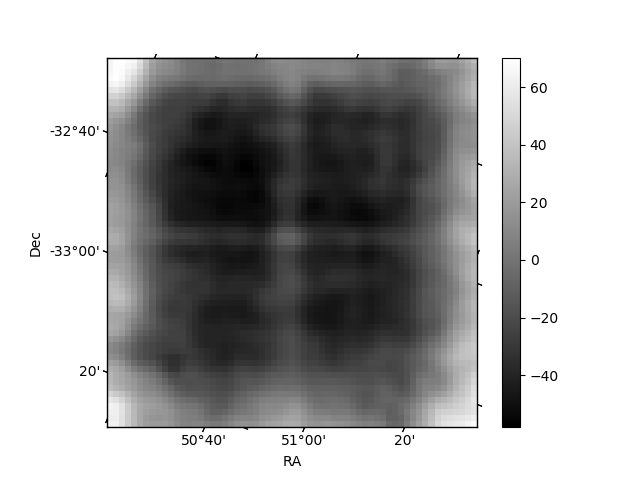
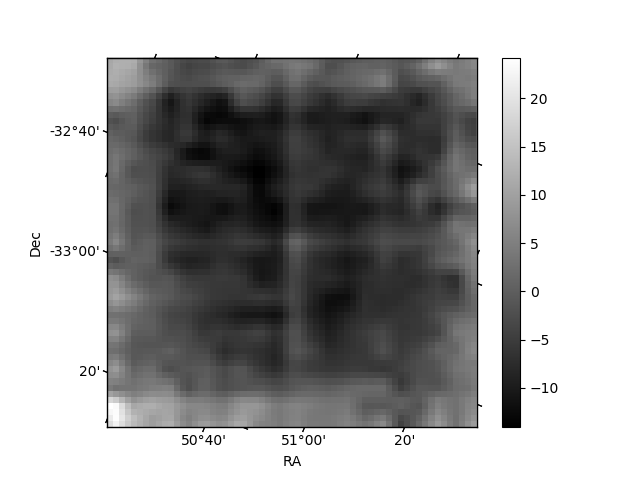
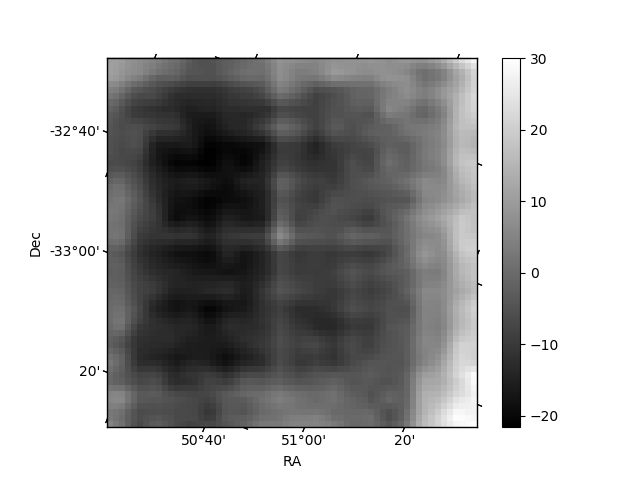
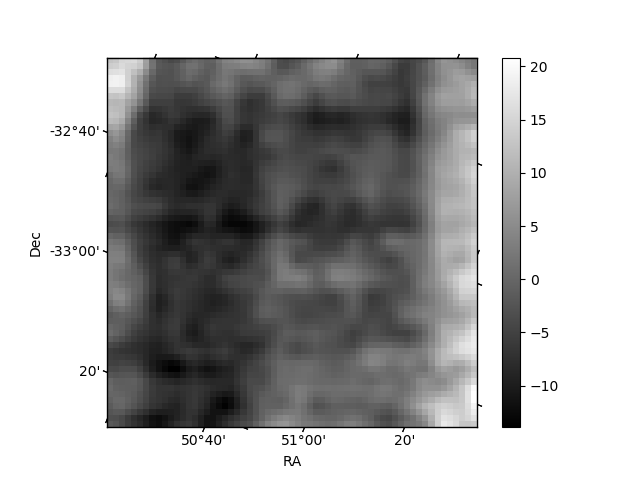
Histogram calculated using DETX and DETY for each event in the final _common_clean file
| Quadrant A | 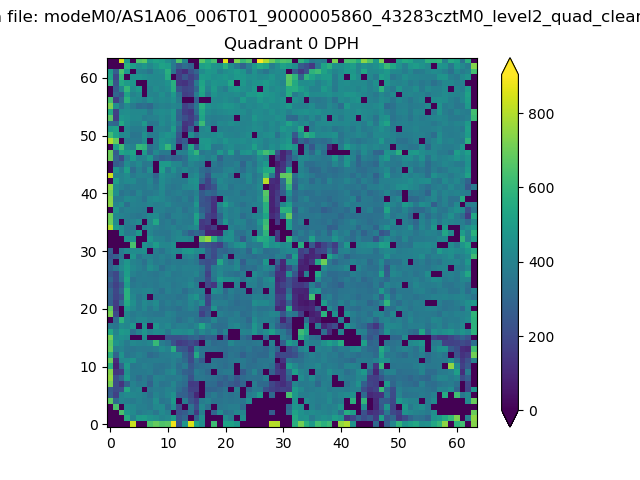 |
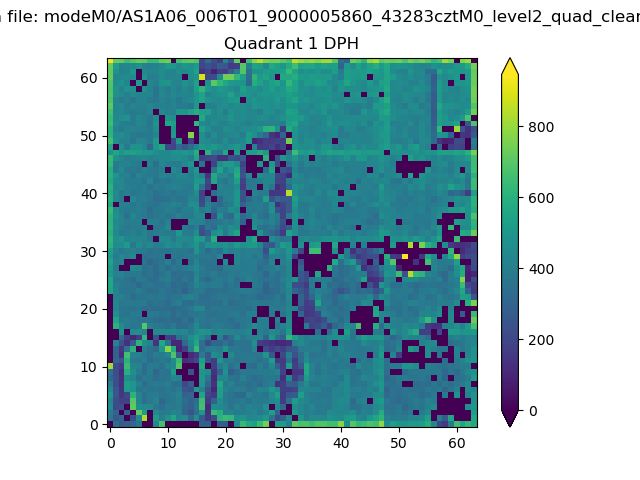 |
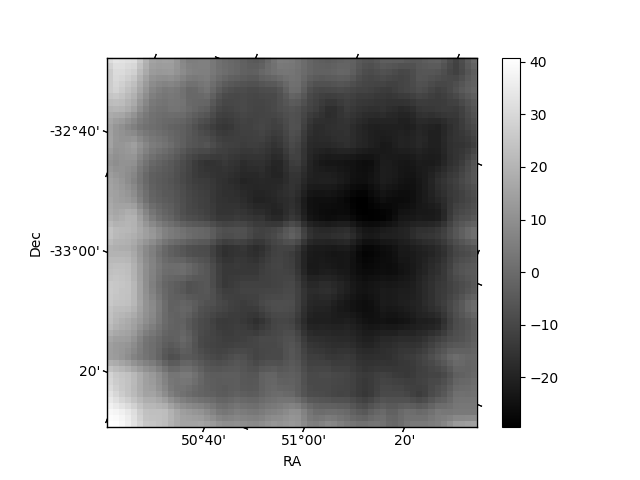
Quadrant B |
|---|---|---|---|
| Quadrant D | 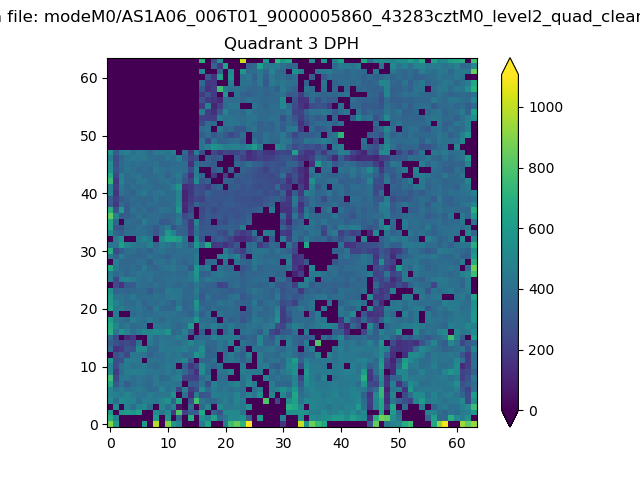 |
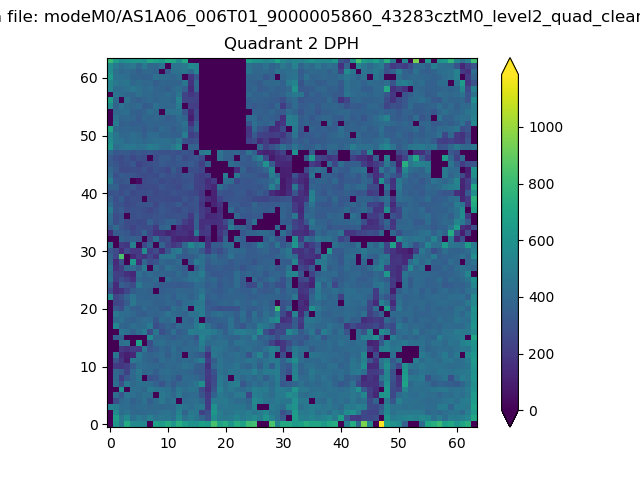 |
Quadrant C |
| Plot type | Count rate plots | Images |
|---|---|---|
| Comparison with Poisson distribution Blue bars denote a histogram of data divided into 1 sec bins. Red curve is a Poisson curve with rate = median count rate of data. |
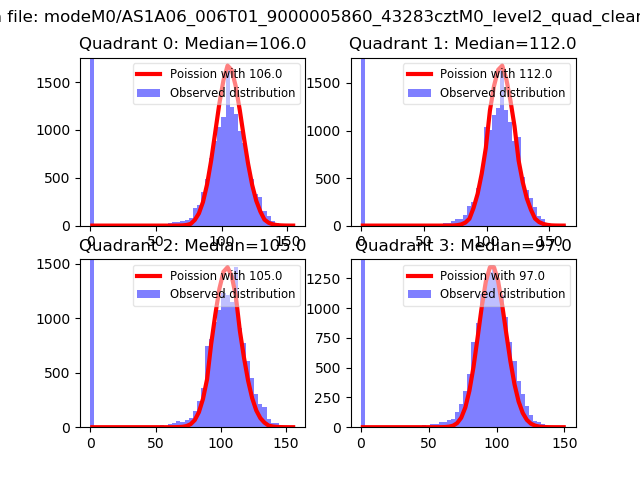 |
 |
| Quadrant-wise count rates Data is divided into 100 sec bins |
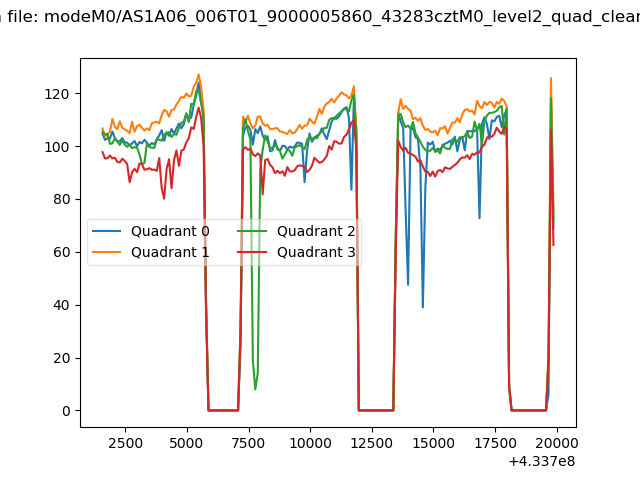 |
|
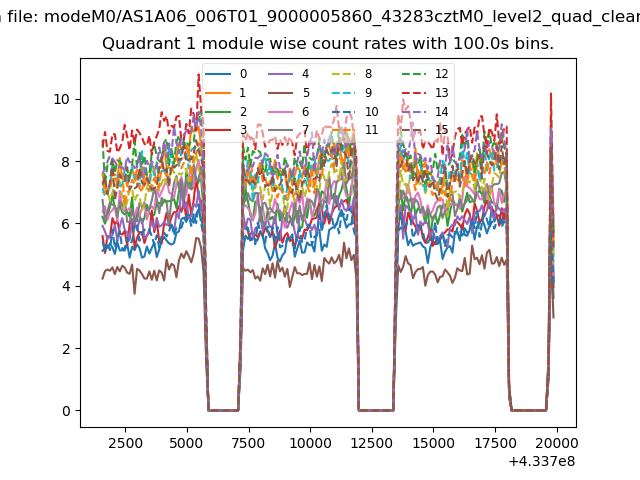
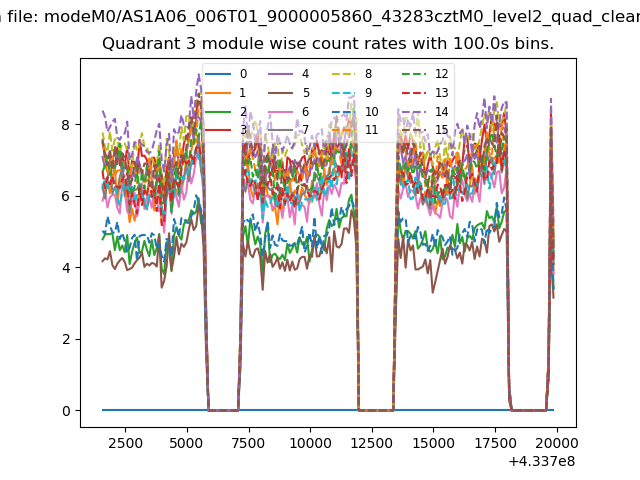
| Module-wise count rates for Quadrant A Data is divided into 100 sec bins |
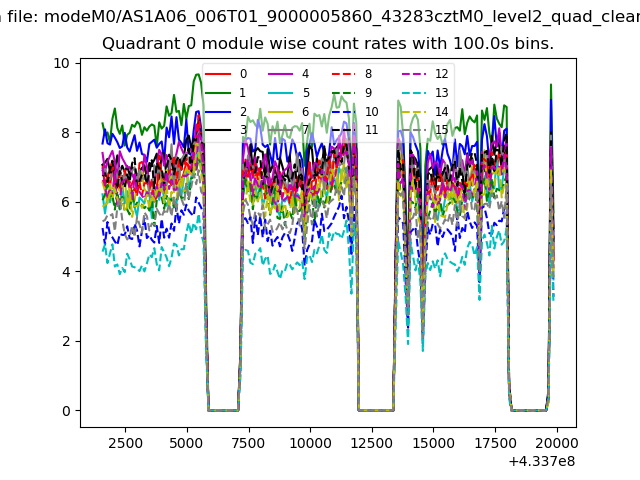 |
 |
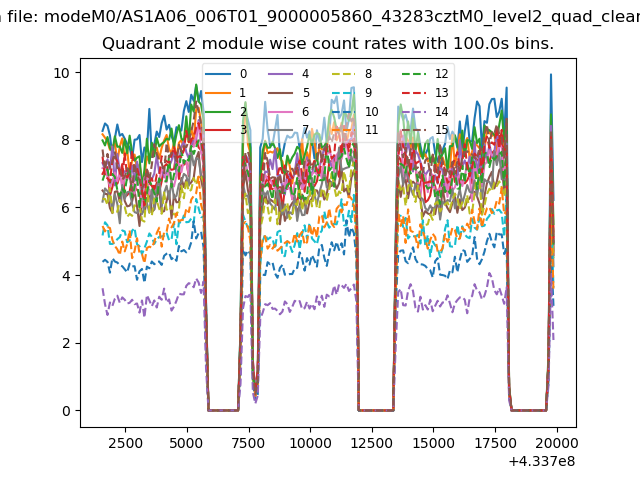
| Module-wise count rates for Quadrant B Data is divided into 100 sec bins |
 |
 |
| Module-wise count rates for Quadrant C Data is divided into 100 sec bins |
 |
 |
| Module-wise count rates for Quadrant D Data is divided into 100 sec bins |
 |
 |
| Parameter | Plot |
|---|---|
| CZT HV Monitor | 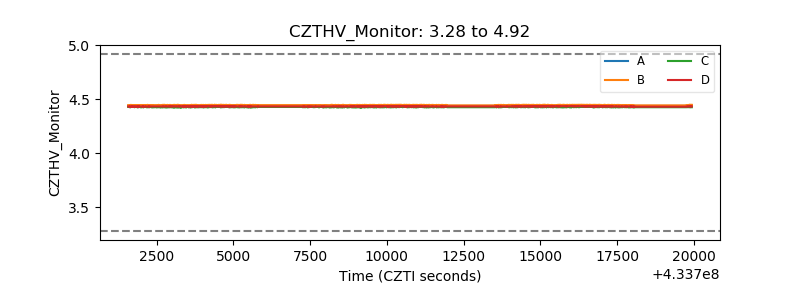 |
| D_VDD | 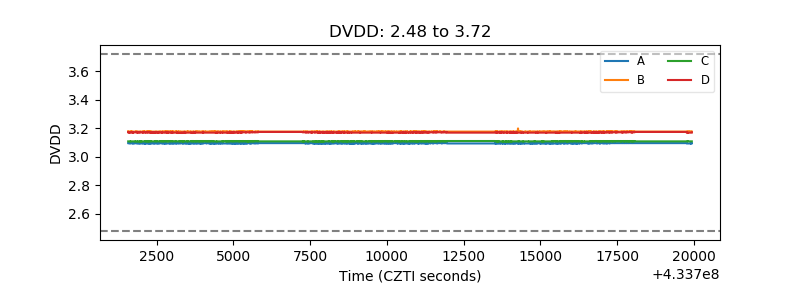 |
| Temperature 1 | 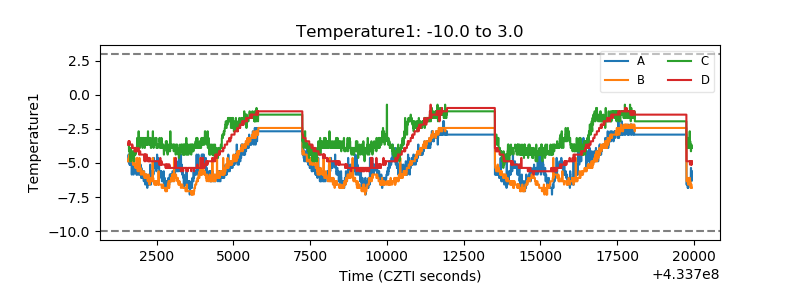 |
| Veto HV Monitor | 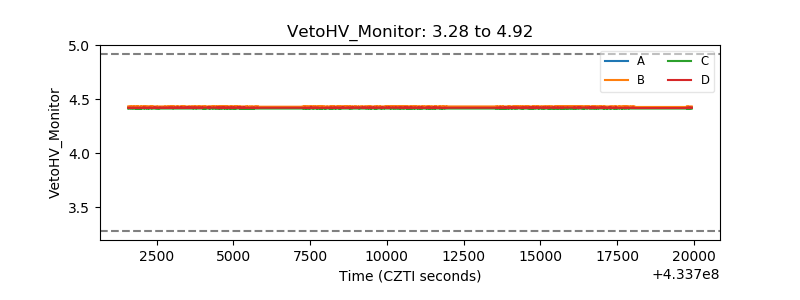 |
| Veto LLD | 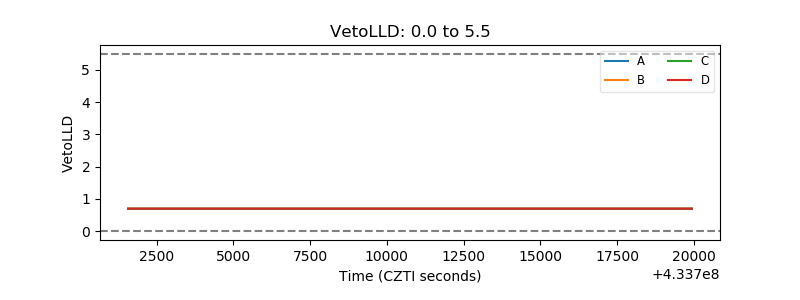 |
| Alpha Counter | 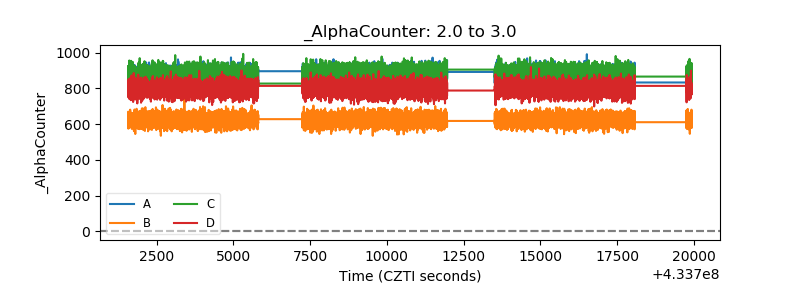 |
| _CPM_Rate | 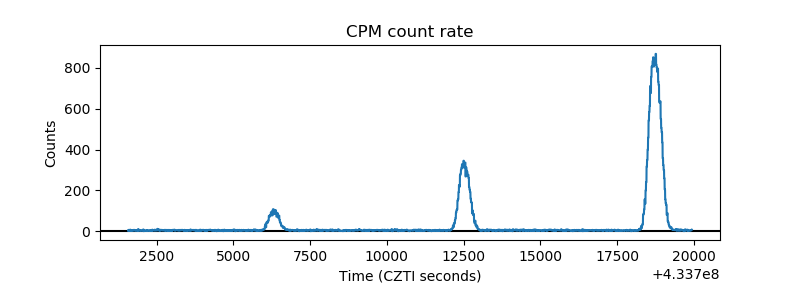 |
| CZT Counter | 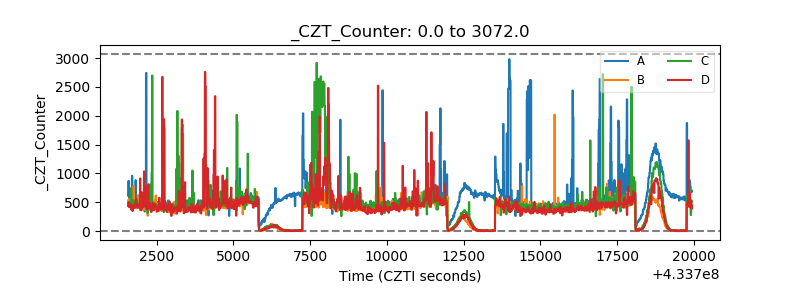 |
| +2.5 Volts monitor | 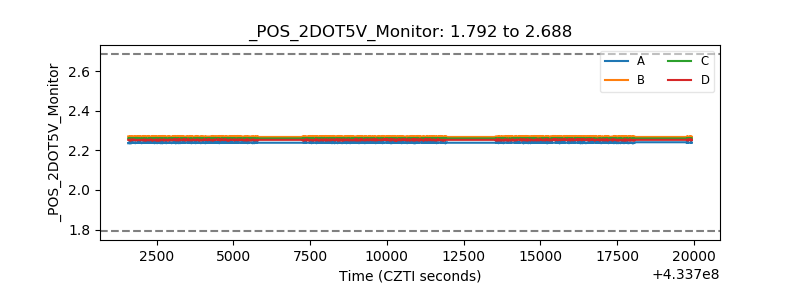 |
| +5 Volts monitor | 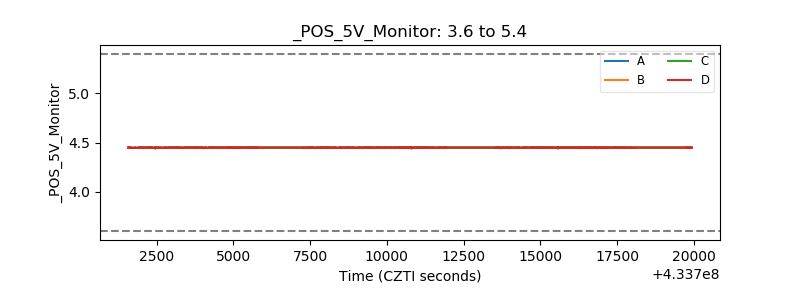 |
| _ROLL_ROT | 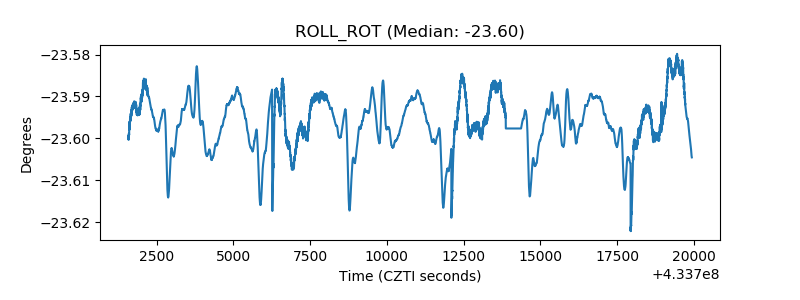 |
| _Roll_DEC | 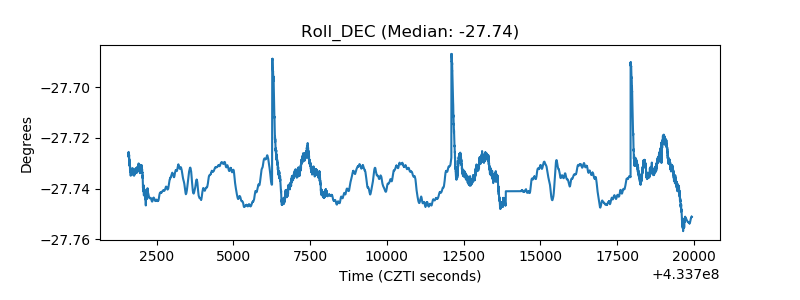 |
| _Roll_RA | 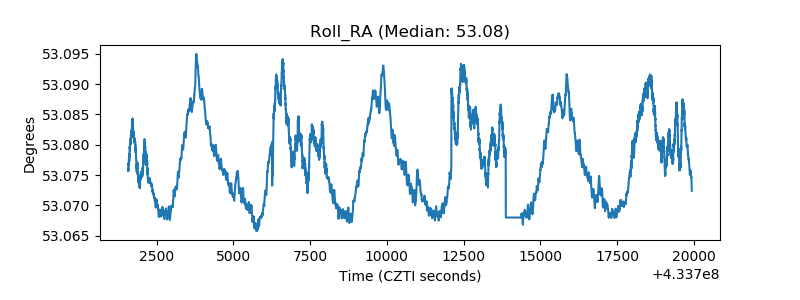 |
| Veto Counter | 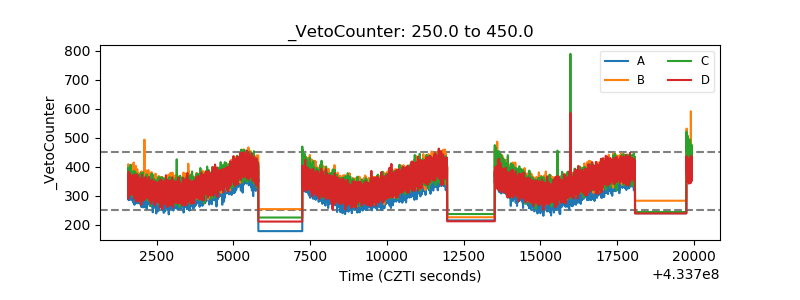 |