| Param | Original file | Final file |
|---|---|---|
| Filename | modeM0/AS1C07_001T10_9000005862_43283cztM0_level2.fits | modeM0/AS1C07_001T10_9000005862_43283cztM0_level2_quad_clean.evt |
| Size (bytes) | 218,427,840 | 66,744,000 |
| Size | 208.3 MB | 63.7 MB |
| Events in quadrant A | 2,168,178 | 441,618 |
| Events in quadrant B | 1,751,822 | 456,833 |
| Events in quadrant C | 1,853,374 | 435,867 |
| Events in quadrant D | 1,997,267 | 402,665 |
| Mode SS | |||
|---|---|---|---|
| Quadrant | BADHDUFLAG | Total packets | Discarded packets |
| A | 0 | 84 | 0 |
| B | 0 | 84 | 0 |
| C | 0 | 84 | 0 |
| D | 0 | 84 | 0 |
| Mode M9 | |||
|---|---|---|---|
| Quadrant | BADHDUFLAG | Total packets | Discarded packets |
| A | 0 | 18 | 0 |
| B | 0 | 18 | 0 |
| C | 0 | 18 | 0 |
| D | 0 | 18 | 0 |
| Mode M0 | |||
|---|---|---|---|
| Quadrant | BADHDUFLAG | Total packets | Discarded packets |
| A | 0 | 9018 | 1 |
| B | 0 | 8193 | 1 |
| C | 0 | 8162 | 1 |
| D | 0 | 9037 | 1 |
| Quadrant | Total seconds | Saturated seconds | Saturation percentage |
|---|---|---|---|
| A | 4023 | 32 | 0.795426% |
| B | 4023 | 10 | 0.248571% |
| C | 4023 | 6 | 0.149142% |
| D | 4023 | 26 | 0.646284% |
Noise dominated data is calculated using 1-second bins in cleaned event files. If a bin has >2000 counts, and if more than 50% of those come from <1% of pixels, then it is considered to be noise-dominated and hence unusable.
| Quadrant | # 1 sec bins | Bins with >0 counts | Bins with >2000 counts | High rate bins dominated by noise | Noise dominated (total time) | Noise dominated (detector-on time) | Marked lightcurve |
|---|---|---|---|---|---|---|---|
| A | 5816 | 4024 | 22 | 22 | 0.38% | 0.55% | 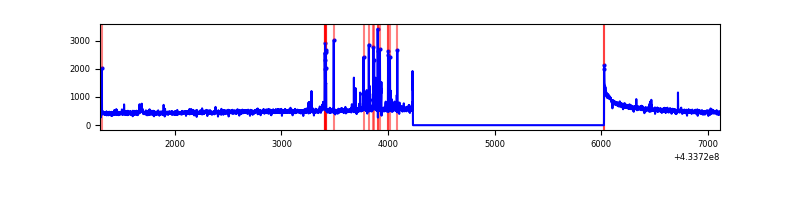 |
| B | 5816 | 4024 | 8 | 8 | 0.14% | 0.20% | 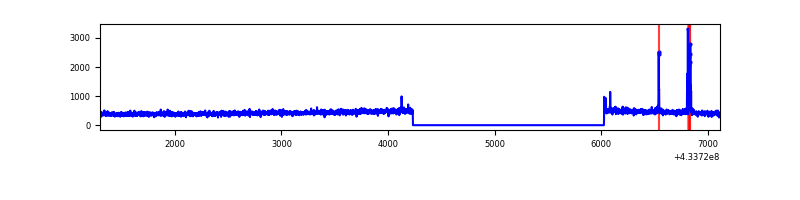 |
| C | 5816 | 4024 | 7 | 7 | 0.12% | 0.17% | 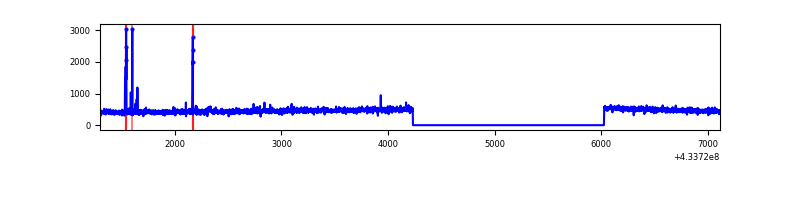 |
| D | 5816 | 4024 | 36 | 36 | 0.62% | 0.89% | 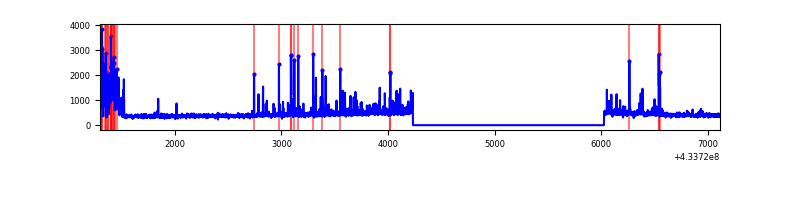 |
Top three noisy pixels from each quadrant. If the there are fewer than three noisy pixels in the level2.evt file, extra rows are filled as -1
| Pixel properties | Quadrant properties | ||||||
|---|---|---|---|---|---|---|---|
| Quadrant | DetID | PixID | Counts | Sigma | Mean | Median | Sigma |
| A | 10 | 83 | 373328 | 4178.69 | 429 | 419 | 89.2 |
| A | 15 | 237 | 111738 | 1247.4 | 429 | 419 | 89.2 |
| A | 13 | 248 | 23462 | 258.21 | 429 | 419 | 89.2 |
| B | 5 | 172 | 46045 | 542.37 | 428 | 416 | 84.1 |
| B | 0 | 189 | 16374 | 189.68 | 428 | 416 | 84.1 |
| B | 12 | 111 | 10613 | 121.21 | 428 | 416 | 84.1 |
| C | 15 | 214 | 176605 | 1796.28 | 417 | 419 | 98.1 |
| C | 14 | 254 | 42395 | 427.96 | 417 | 419 | 98.1 |
| C | 3 | 233 | 4440 | 41.0 | 417 | 419 | 98.1 |
| D | 2 | 249 | 255255 | 2490.73 | 416 | 404 | 102.3 |
| D | 12 | 16 | 67170 | 652.52 | 416 | 404 | 102.3 |
| D | 12 | 6 | 51603 | 500.38 | 416 | 404 | 102.3 |
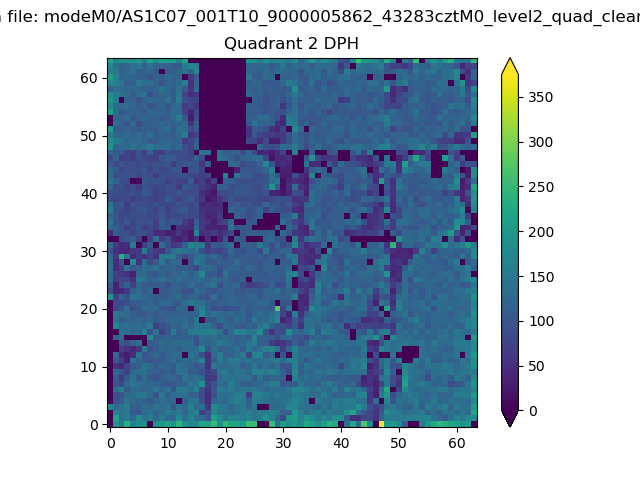
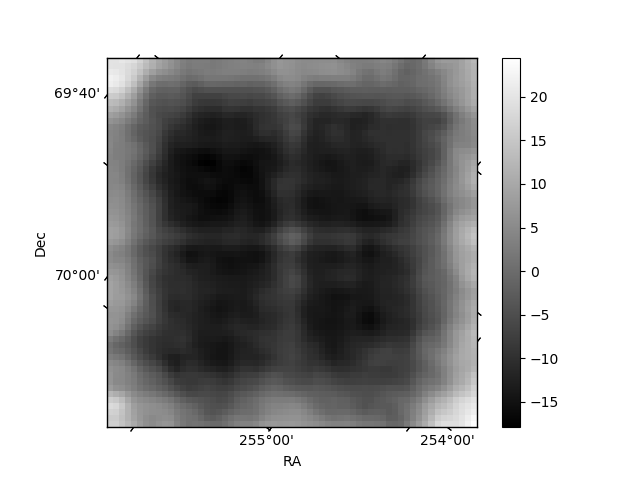
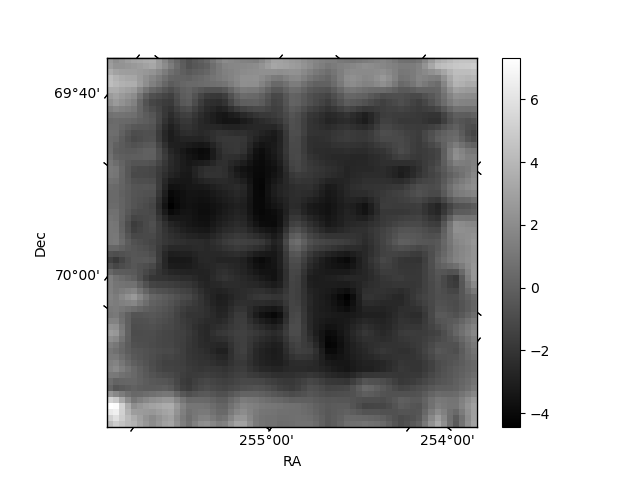
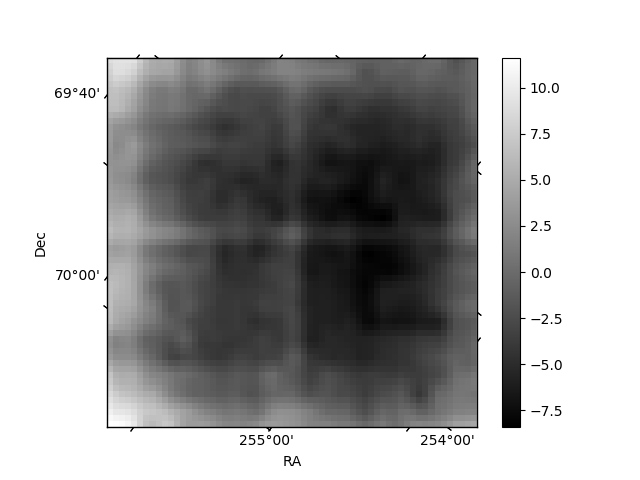
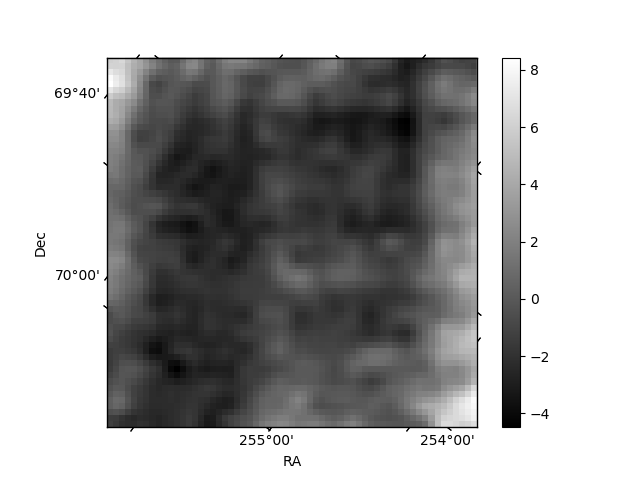
Histogram calculated using DETX and DETY for each event in the final _common_clean file
| Quadrant A | 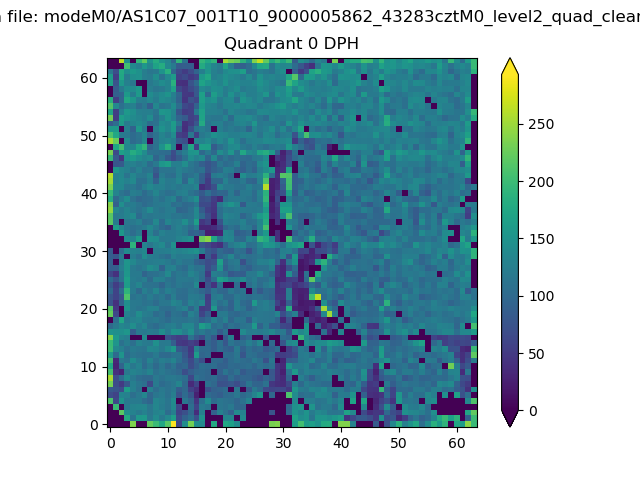 |
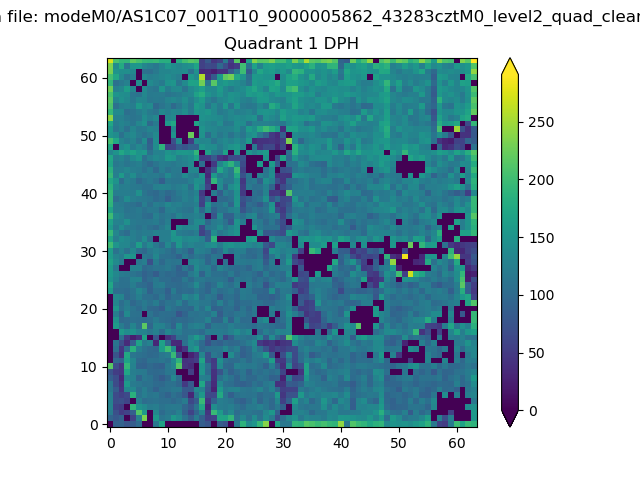 |
Quadrant B |
|---|---|---|---|
| Quadrant D | 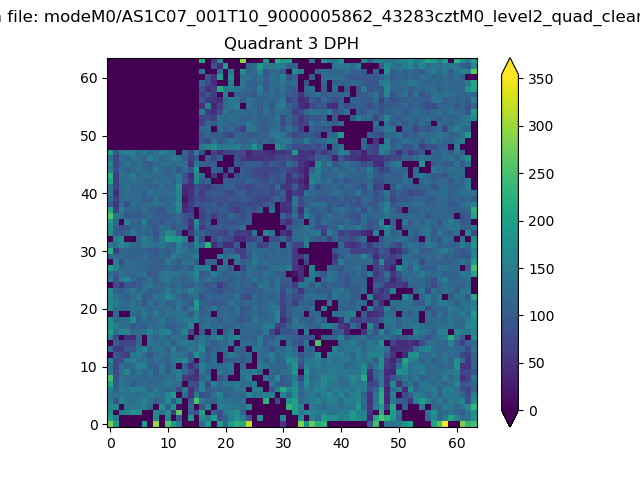 |
 |
Quadrant C |
| Plot type | Count rate plots | Images |
|---|---|---|
| Comparison with Poisson distribution Blue bars denote a histogram of data divided into 1 sec bins. Red curve is a Poisson curve with rate = median count rate of data. |
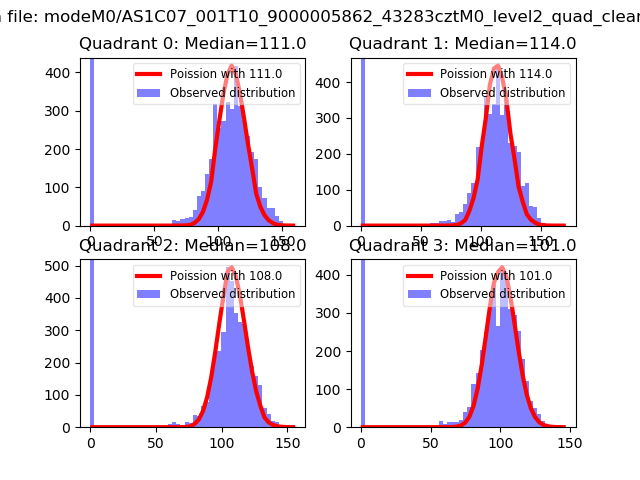 |
 |
| Quadrant-wise count rates Data is divided into 100 sec bins |
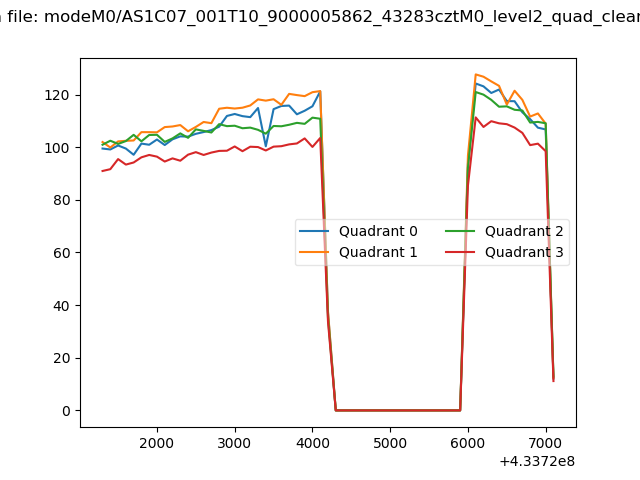 |
|
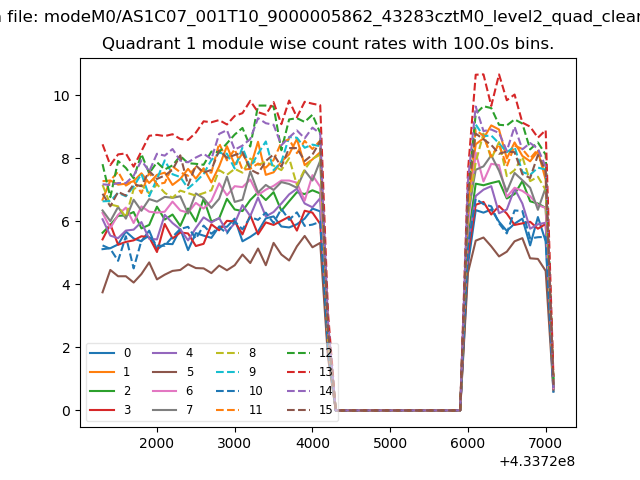
| Module-wise count rates for Quadrant A Data is divided into 100 sec bins |
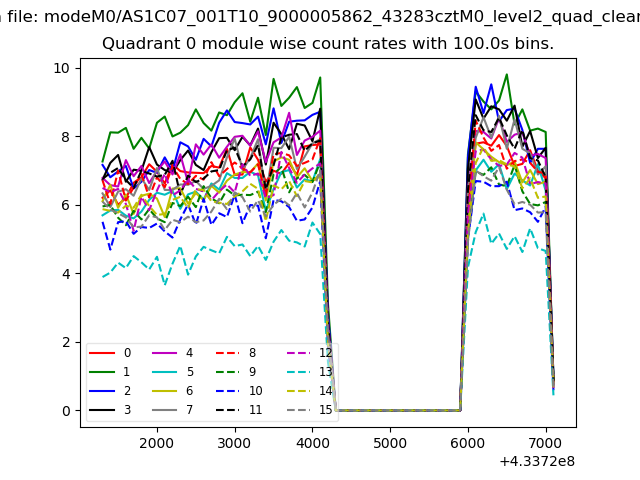 |
 |
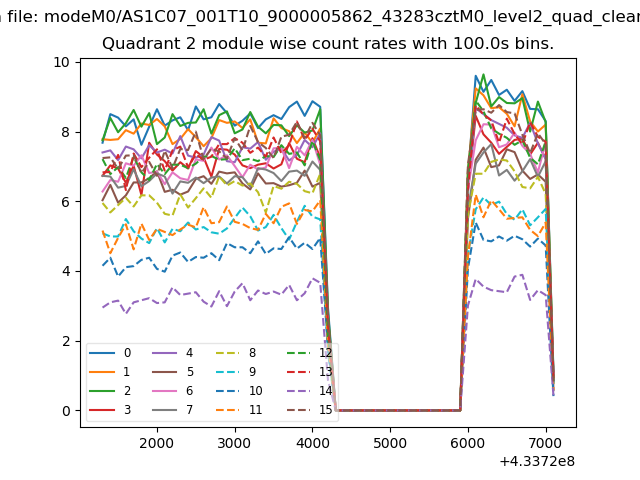
| Module-wise count rates for Quadrant B Data is divided into 100 sec bins |
 |
 |
| Module-wise count rates for Quadrant C Data is divided into 100 sec bins |
 |
 |
| Module-wise count rates for Quadrant D Data is divided into 100 sec bins |
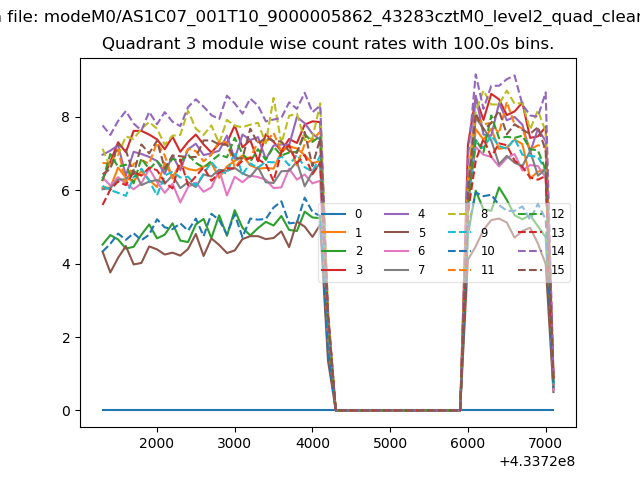 |
 |
| Parameter | Plot |
|---|---|
| CZT HV Monitor | 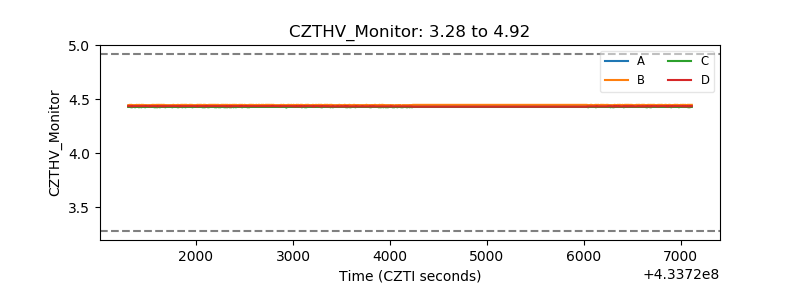 |
| D_VDD | 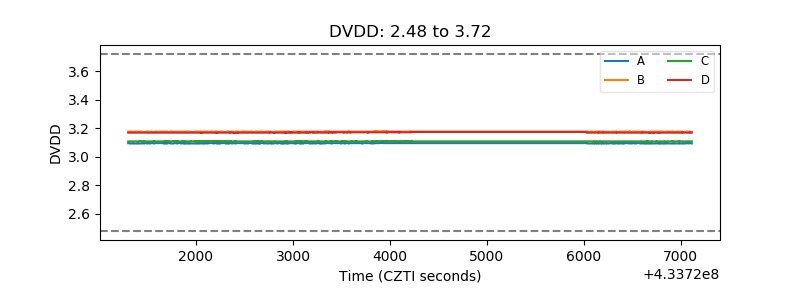 |
| Temperature 1 | 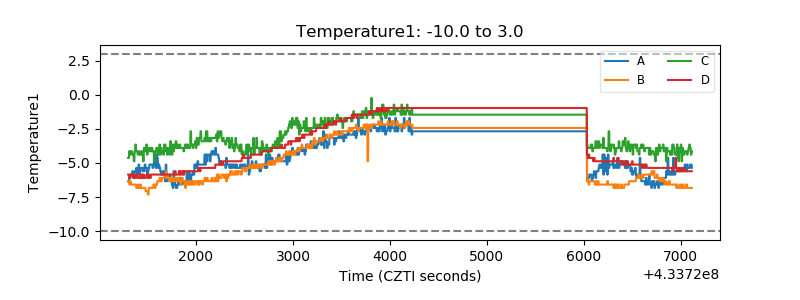 |
| Veto HV Monitor | 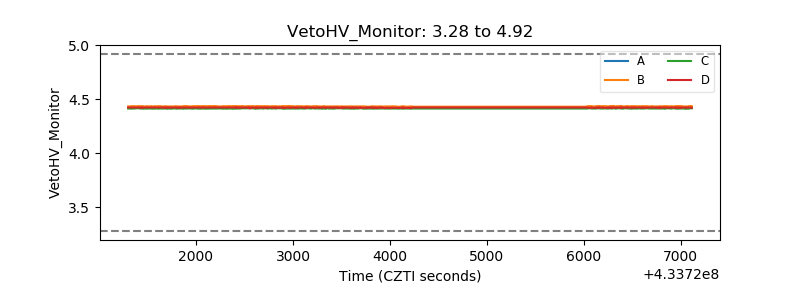 |
| Veto LLD | 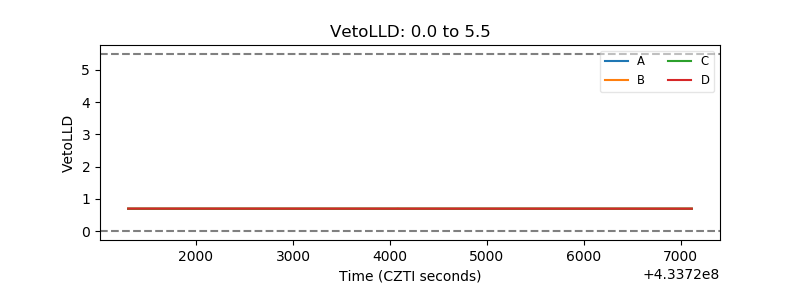 |
| Alpha Counter | 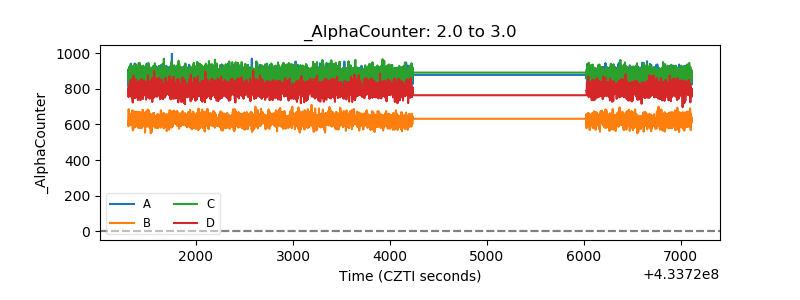 |
| _CPM_Rate | 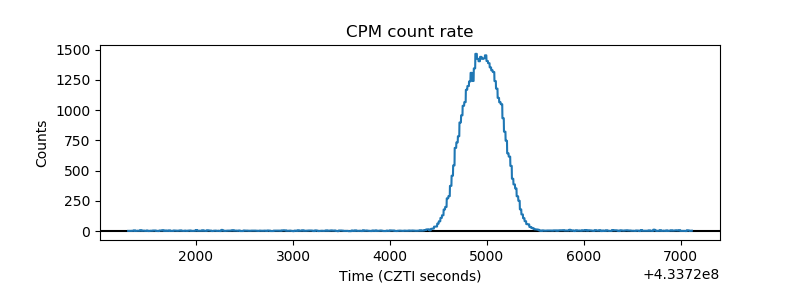 |
| CZT Counter | 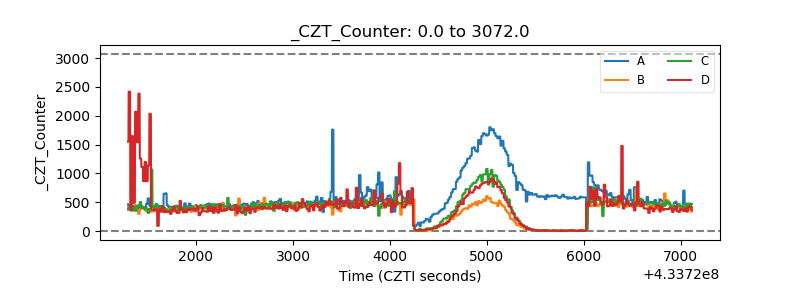 |
| +2.5 Volts monitor | 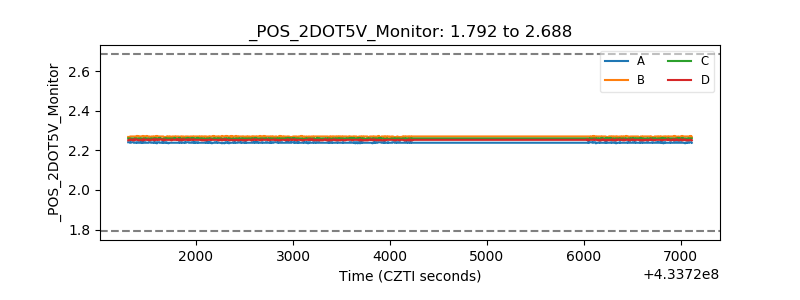 |
| +5 Volts monitor | 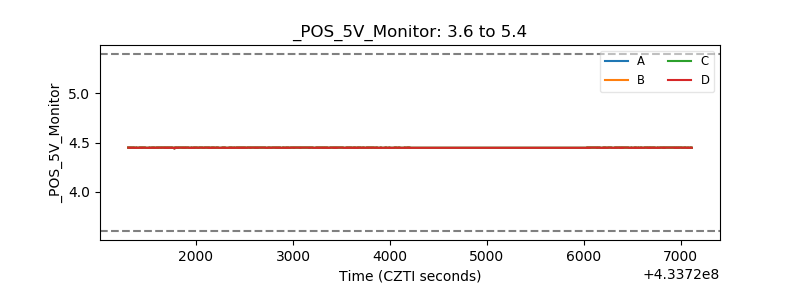 |
| _ROLL_ROT | 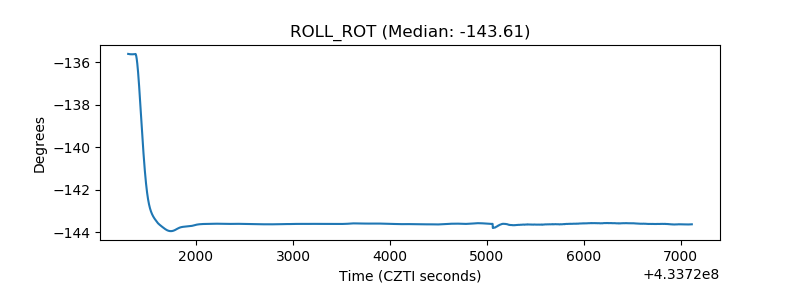 |
| _Roll_DEC |  |
| _Roll_RA | 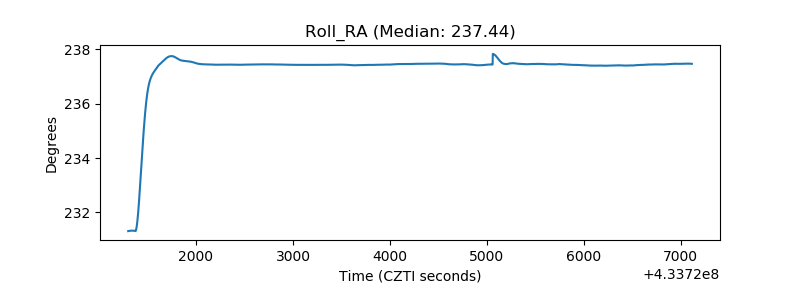 |
| Veto Counter |  |