| Param | Original file | Final file |
|---|---|---|
| Filename | modeM0/AS1A12_089T01_9000005864_43287cztM0_level2.fits | modeM0/AS1A12_089T01_9000005864_43287cztM0_level2_quad_clean.evt |
| Size (bytes) | 312,442,560 | 85,757,760 |
| Size | 298.0 MB | 81.8 MB |
| Events in quadrant A | 3,616,961 | 559,181 |
| Events in quadrant B | 2,324,597 | 602,967 |
| Events in quadrant C | 2,463,256 | 573,514 |
| Events in quadrant D | 2,778,126 | 516,620 |
| Mode M9 | |||
|---|---|---|---|
| Quadrant | BADHDUFLAG | Total packets | Discarded packets |
| A | 0 | 27 | 0 |
| B | 0 | 28 | 0 |
| C | 0 | 28 | 0 |
| D | 0 | 28 | 0 |
| Mode SS | |||
|---|---|---|---|
| Quadrant | BADHDUFLAG | Total packets | Discarded packets |
| A | 0 | 102 | 0 |
| B | 0 | 102 | 0 |
| C | 0 | 102 | 0 |
| D | 0 | 102 | 0 |
| Mode M0 | |||
|---|---|---|---|
| Quadrant | BADHDUFLAG | Total packets | Discarded packets |
| A | 0 | 13790 | 2 |
| B | 0 | 10025 | 3 |
| C | 0 | 10091 | 2 |
| D | 0 | 11527 | 2 |
| Quadrant | Total seconds | Saturated seconds | Saturation percentage |
|---|---|---|---|
| A | 4908 | 256 | 5.215974% |
| B | 4907 | 11 | 0.224170% |
| C | 4907 | 6 | 0.122274% |
| D | 4907 | 87 | 1.772977% |
Noise dominated data is calculated using 1-second bins in cleaned event files. If a bin has >2000 counts, and if more than 50% of those come from <1% of pixels, then it is considered to be noise-dominated and hence unusable.
| Quadrant | # 1 sec bins | Bins with >0 counts | Bins with >2000 counts | High rate bins dominated by noise | Noise dominated (total time) | Noise dominated (detector-on time) | Marked lightcurve |
|---|---|---|---|---|---|---|---|
| A | 7030 | 4909 | 194 | 194 | 2.76% | 3.95% | 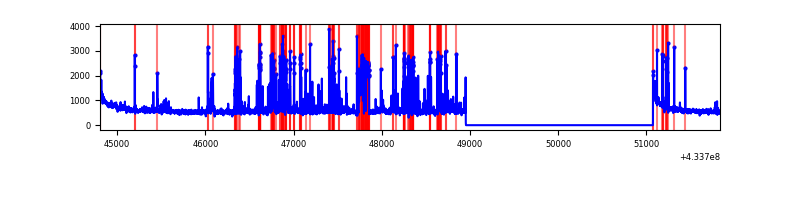 |
| B | 7029 | 4908 | 0 | 0 | 0.00% | 0.00% | 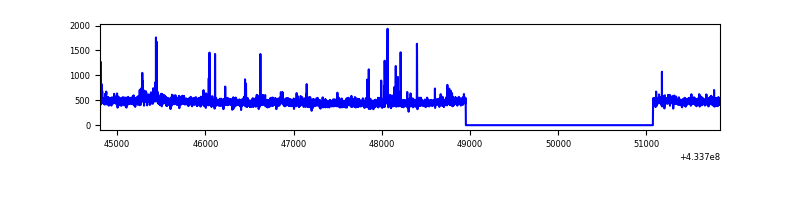 |
| C | 7029 | 4908 | 3 | 3 | 0.04% | 0.06% | 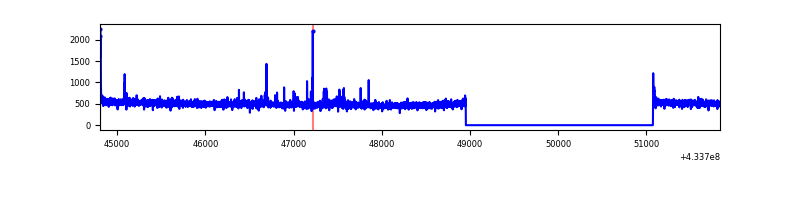 |
| D | 7029 | 4908 | 75 | 75 | 1.07% | 1.53% | 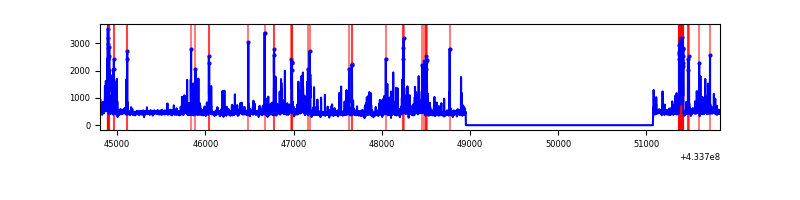 |
Top three noisy pixels from each quadrant. If the there are fewer than three noisy pixels in the level2.evt file, extra rows are filled as -1
| Pixel properties | Quadrant properties | ||||||
|---|---|---|---|---|---|---|---|
| Quadrant | DetID | PixID | Counts | Sigma | Mean | Median | Sigma |
| A | 15 | 237 | 829993 | 7337.47 | 555 | 545 | 113.0 |
| A | 10 | 83 | 561949 | 4966.3 | 555 | 545 | 113.0 |
| A | 12 | 189 | 42785 | 373.66 | 555 | 545 | 113.0 |
| B | 0 | 186 | 26989 | 241.75 | 566 | 551 | 109.4 |
| B | 5 | 255 | 25992 | 232.63 | 566 | 551 | 109.4 |
| B | 0 | 190 | 18766 | 166.56 | 566 | 551 | 109.4 |
| C | 15 | 214 | 211976 | 1618.83 | 554 | 557 | 130.6 |
| C | 3 | 233 | 63192 | 479.6 | 554 | 557 | 130.6 |
| C | 14 | 254 | 21925 | 163.61 | 554 | 557 | 130.6 |
| D | 12 | 6 | 221337 | 1640.67 | 551 | 538 | 134.6 |
| D | 2 | 249 | 165948 | 1229.1 | 551 | 538 | 134.6 |
| D | 1 | 52 | 96516 | 713.17 | 551 | 538 | 134.6 |
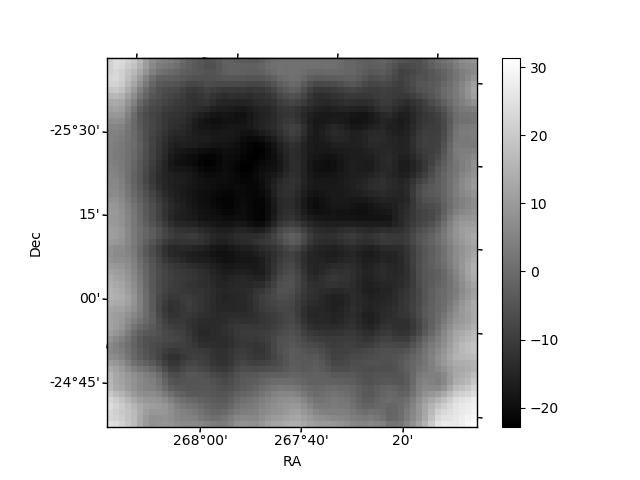
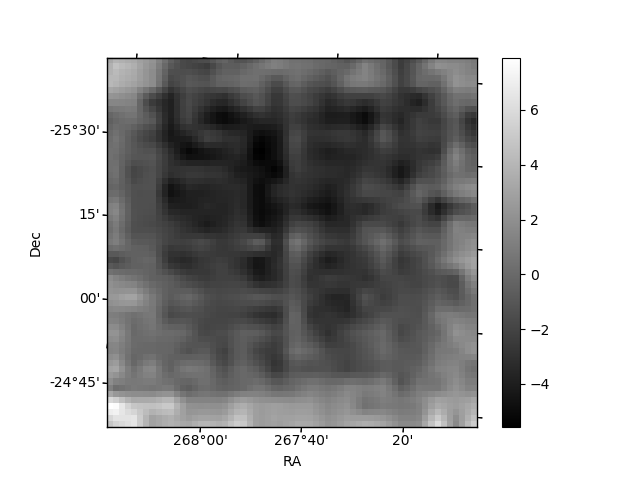
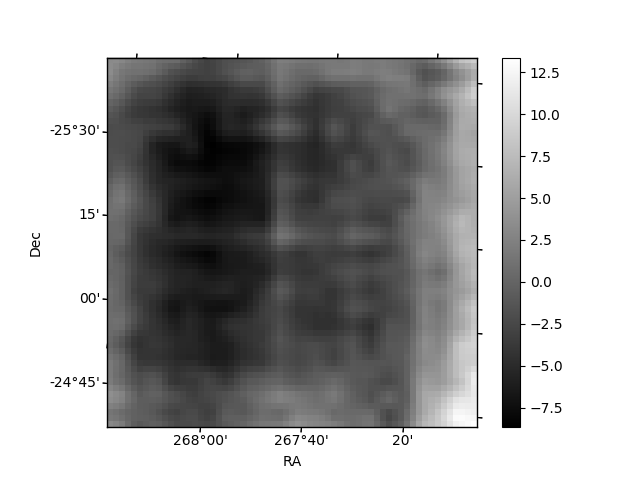
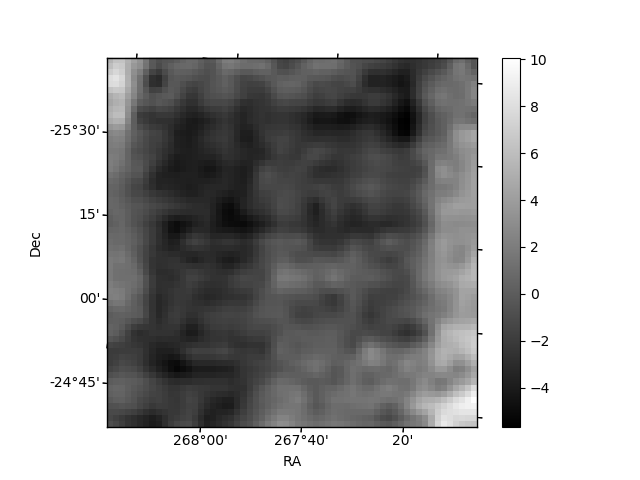
Histogram calculated using DETX and DETY for each event in the final _common_clean file
| Quadrant A | 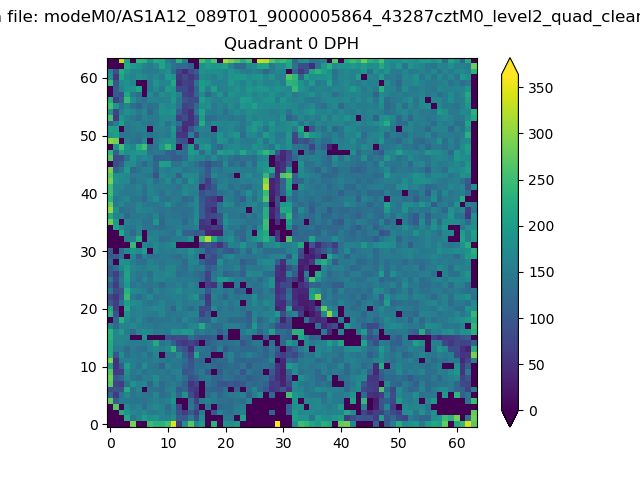 |
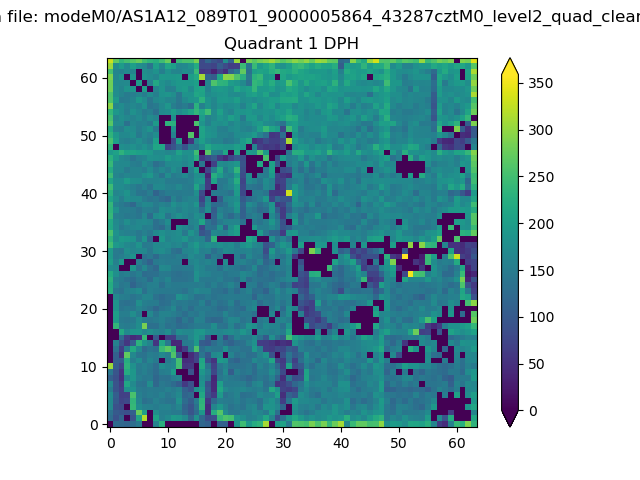 |
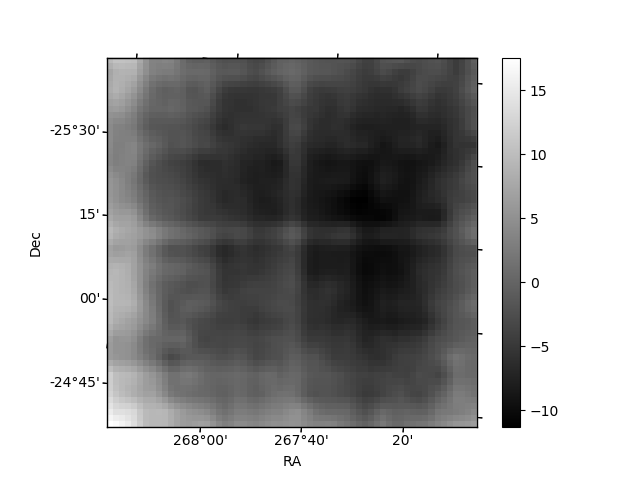
Quadrant B |
|---|---|---|---|
| Quadrant D | 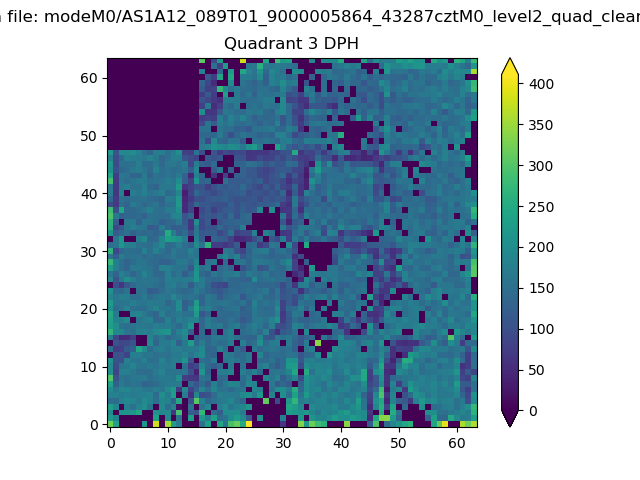 |
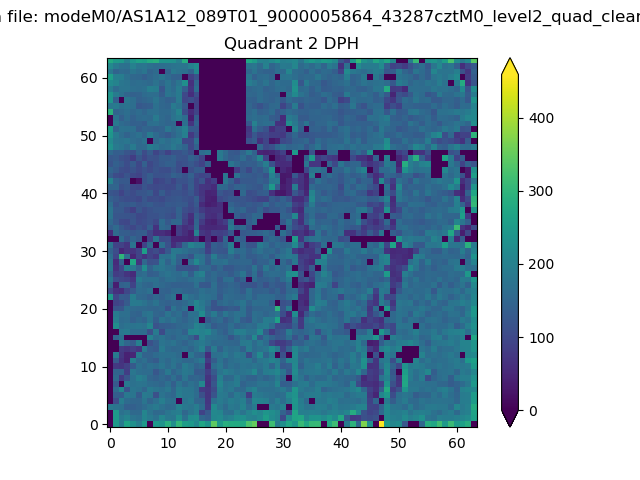 |
Quadrant C |
| Plot type | Count rate plots | Images |
|---|---|---|
| Comparison with Poisson distribution Blue bars denote a histogram of data divided into 1 sec bins. Red curve is a Poisson curve with rate = median count rate of data. |
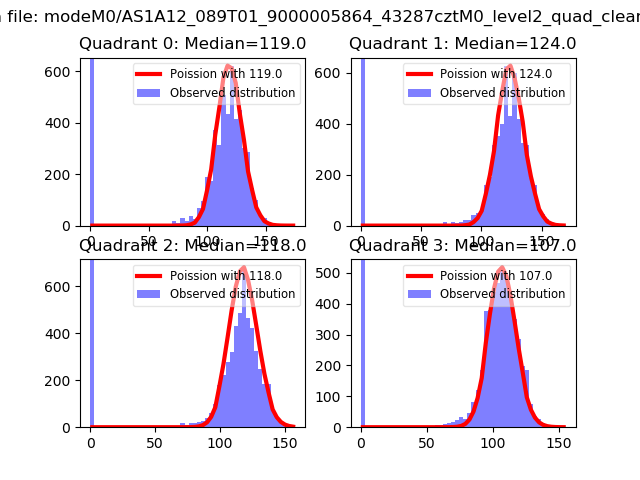 |
 |
| Quadrant-wise count rates Data is divided into 100 sec bins |
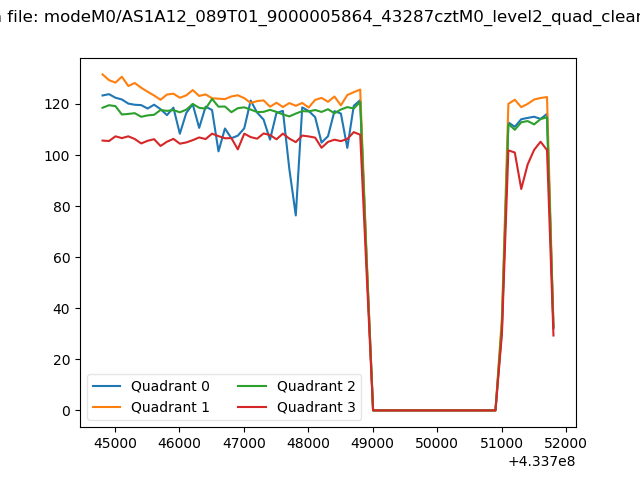 |
|
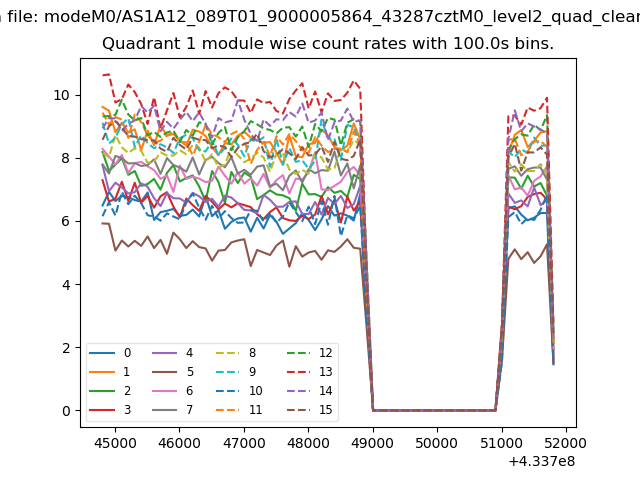
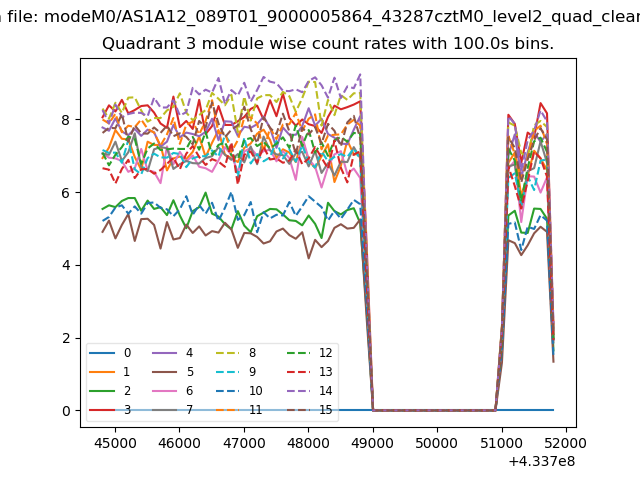
| Module-wise count rates for Quadrant A Data is divided into 100 sec bins |
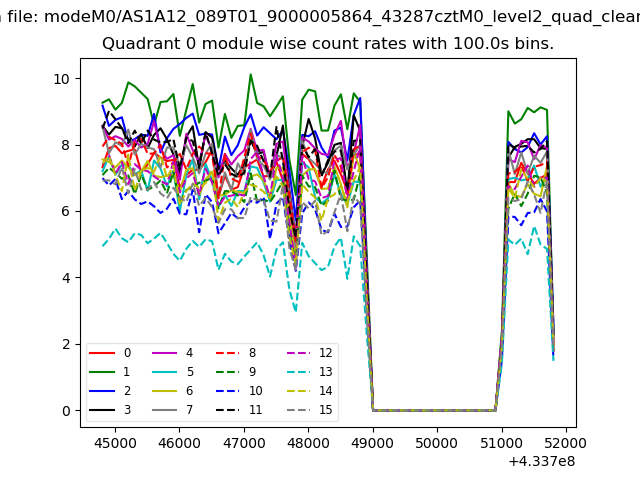 |
 |
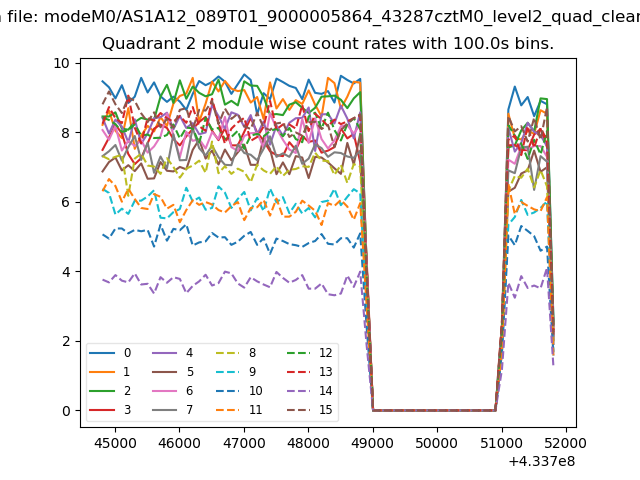
| Module-wise count rates for Quadrant B Data is divided into 100 sec bins |
 |
 |
| Module-wise count rates for Quadrant C Data is divided into 100 sec bins |
 |
 |
| Module-wise count rates for Quadrant D Data is divided into 100 sec bins |
 |
 |
| Parameter | Plot |
|---|---|
| CZT HV Monitor | 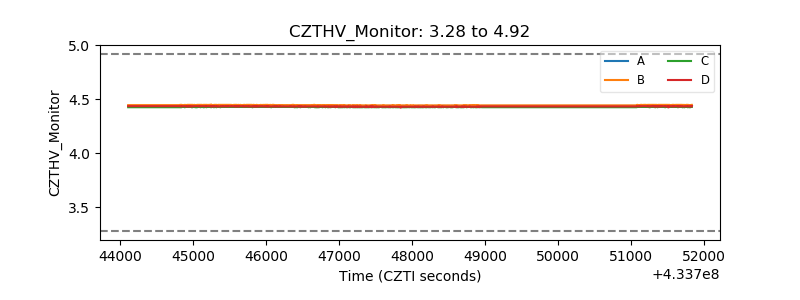 |
| D_VDD | 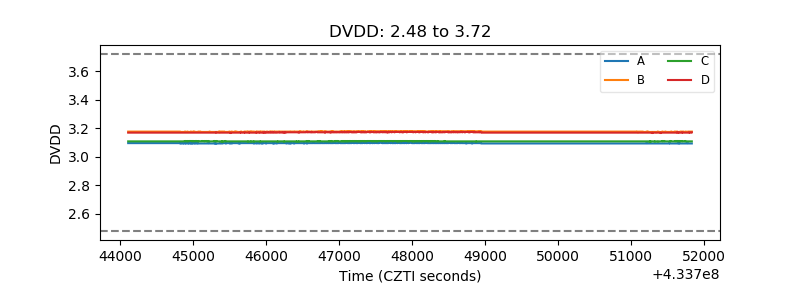 |
| Temperature 1 | 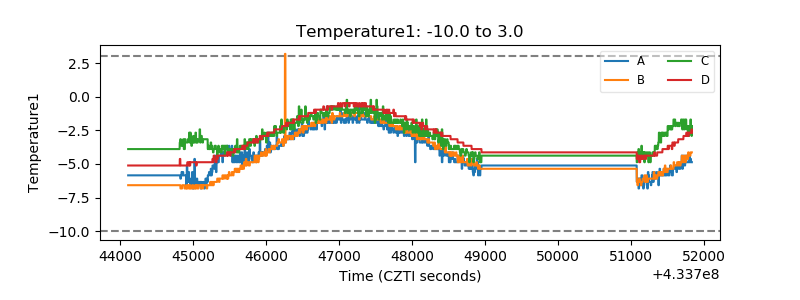 |
| Veto HV Monitor | 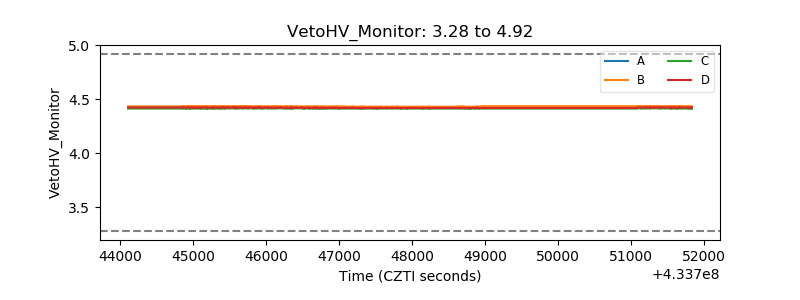 |
| Veto LLD | 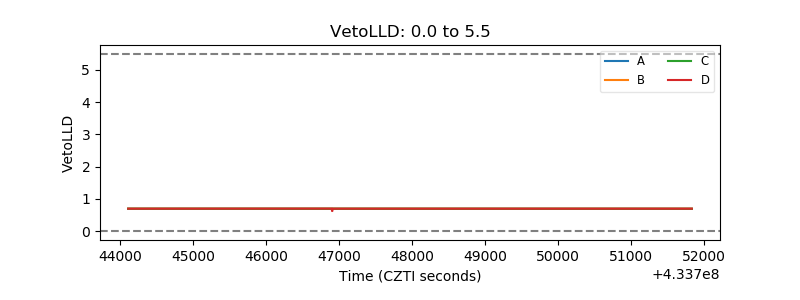 |
| Alpha Counter | 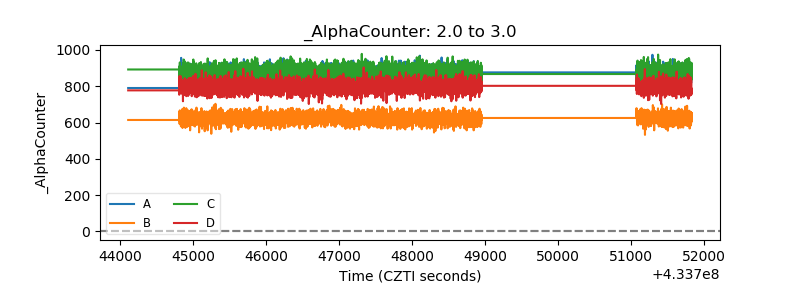 |
| _CPM_Rate | 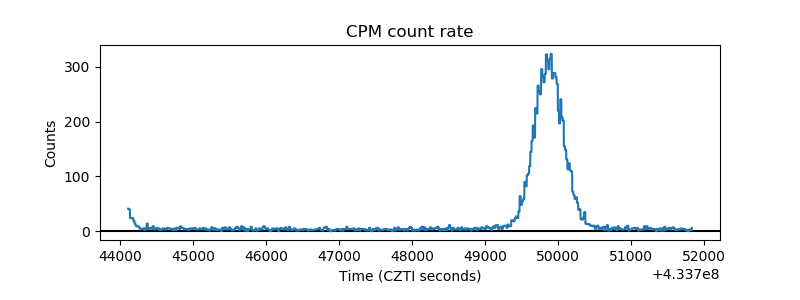 |
| CZT Counter | 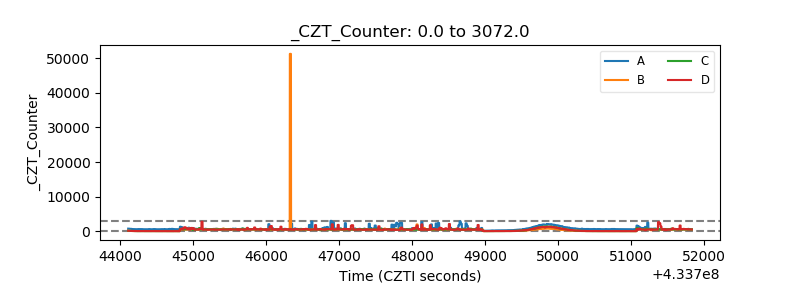 |
| +2.5 Volts monitor | 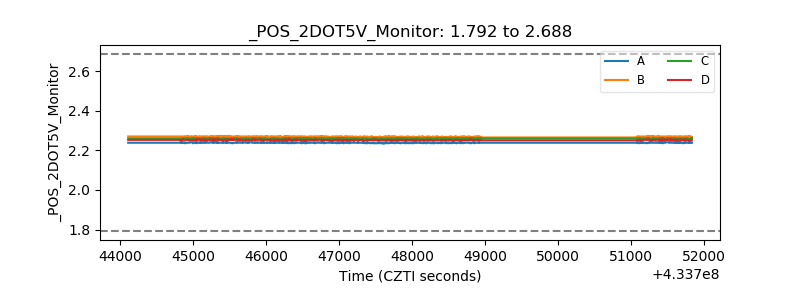 |
| +5 Volts monitor | 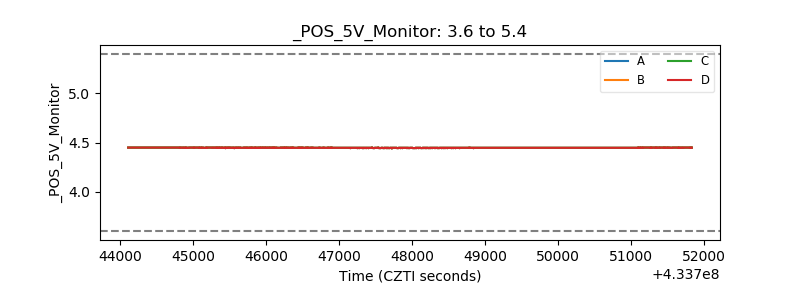 |
| _ROLL_ROT | 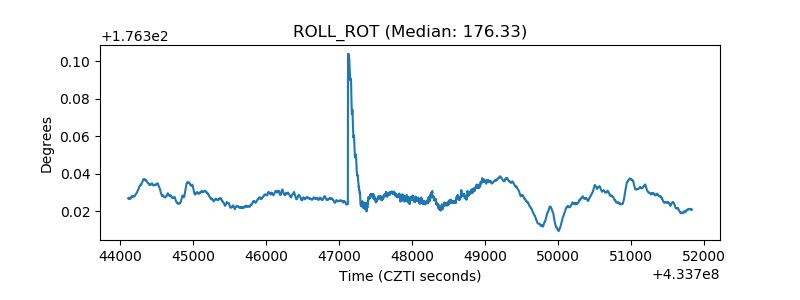 |
| _Roll_DEC | 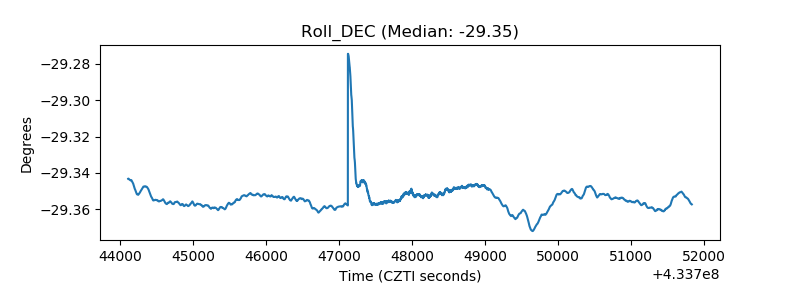 |
| _Roll_RA | 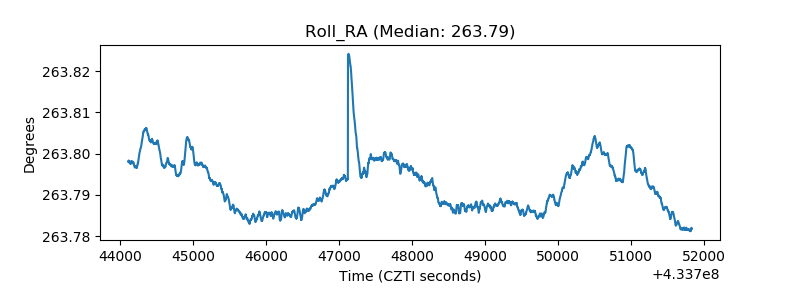 |
| Veto Counter | 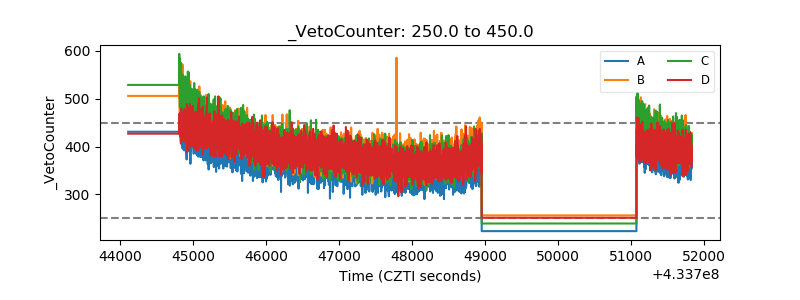 |