| Param | Original file | Final file |
|---|---|---|
| Filename | modeM0/AS1A12_089T01_9000005864_43288cztM0_level2.fits | modeM0/AS1A12_089T01_9000005864_43288cztM0_level2_quad_clean.evt |
| Size (bytes) | 324,074,880 | 85,570,560 |
| Size | 309.1 MB | 81.6 MB |
| Events in quadrant A | 3,316,212 | 560,336 |
| Events in quadrant B | 2,430,853 | 593,054 |
| Events in quadrant C | 2,479,867 | 570,693 |
| Events in quadrant D | 3,377,925 | 514,548 |
| Mode M9 | |||
|---|---|---|---|
| Quadrant | BADHDUFLAG | Total packets | Discarded packets |
| A | 0 | 36 | 0 |
| B | 0 | 37 | 0 |
| C | 0 | 37 | 0 |
| D | 0 | 37 | 0 |
| Mode SS | |||
|---|---|---|---|
| Quadrant | BADHDUFLAG | Total packets | Discarded packets |
| A | 0 | 104 | 0 |
| B | 0 | 104 | 0 |
| C | 0 | 104 | 0 |
| D | 0 | 104 | 0 |
| Mode M0 | |||
|---|---|---|---|
| Quadrant | BADHDUFLAG | Total packets | Discarded packets |
| A | 0 | 12876 | 2 |
| B | 0 | 10519 | 2 |
| C | 0 | 10363 | 2 |
| D | 0 | 13369 | 2 |
| Quadrant | Total seconds | Saturated seconds | Saturation percentage |
|---|---|---|---|
| A | 5023 | 154 | 3.065897% |
| B | 5023 | 19 | 0.378260% |
| C | 5023 | 6 | 0.119451% |
| D | 5023 | 126 | 2.508461% |
Noise dominated data is calculated using 1-second bins in cleaned event files. If a bin has >2000 counts, and if more than 50% of those come from <1% of pixels, then it is considered to be noise-dominated and hence unusable.
| Quadrant | # 1 sec bins | Bins with >0 counts | Bins with >2000 counts | High rate bins dominated by noise | Noise dominated (total time) | Noise dominated (detector-on time) | Marked lightcurve |
|---|---|---|---|---|---|---|---|
| A | 7055 | 5024 | 120 | 120 | 1.70% | 2.39% | 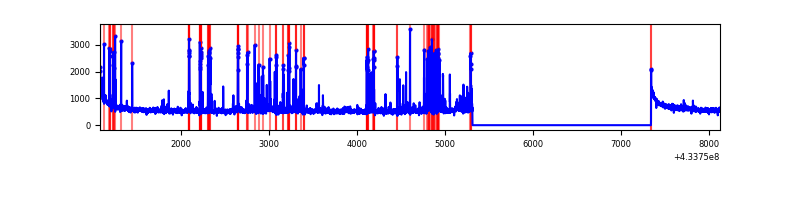 |
| B | 7055 | 5024 | 13 | 13 | 0.18% | 0.26% | 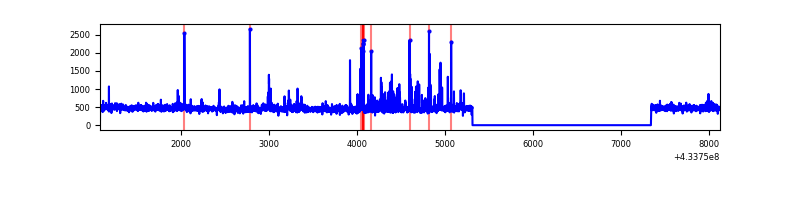 |
| C | 7055 | 5024 | 2 | 2 | 0.03% | 0.04% | 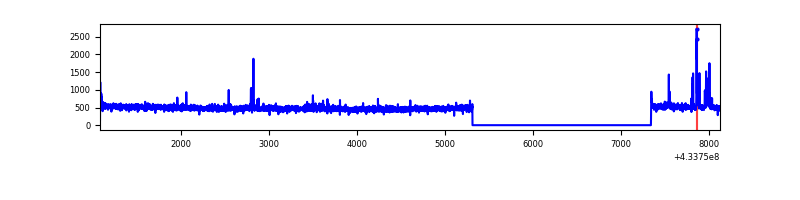 |
| D | 7055 | 5024 | 134 | 134 | 1.90% | 2.67% | 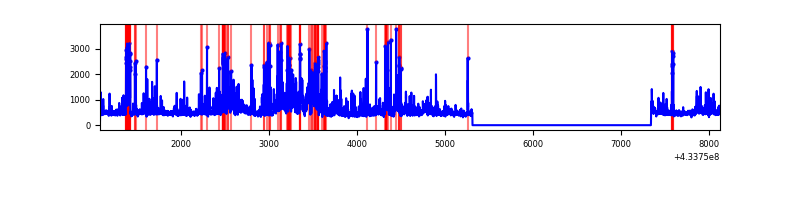 |
Top three noisy pixels from each quadrant. If the there are fewer than three noisy pixels in the level2.evt file, extra rows are filled as -1
| Pixel properties | Quadrant properties | ||||||
|---|---|---|---|---|---|---|---|
| Quadrant | DetID | PixID | Counts | Sigma | Mean | Median | Sigma |
| A | 10 | 83 | 562765 | 4889.04 | 558 | 548 | 115.0 |
| A | 15 | 237 | 502924 | 4368.66 | 558 | 548 | 115.0 |
| A | 12 | 189 | 68092 | 587.36 | 558 | 548 | 115.0 |
| B | 5 | 63 | 61308 | 545.95 | 563 | 547 | 111.3 |
| B | 5 | 255 | 38863 | 344.28 | 563 | 547 | 111.3 |
| B | 15 | 85 | 38541 | 341.38 | 563 | 547 | 111.3 |
| C | 15 | 214 | 216108 | 1667.81 | 550 | 554 | 129.2 |
| C | 14 | 254 | 58444 | 447.91 | 550 | 554 | 129.2 |
| C | 3 | 233 | 53253 | 407.75 | 550 | 554 | 129.2 |
| D | 1 | 52 | 792739 | 5897.24 | 546 | 531 | 134.3 |
| D | 12 | 6 | 128023 | 949.05 | 546 | 531 | 134.3 |
| D | 2 | 249 | 95215 | 704.83 | 546 | 531 | 134.3 |
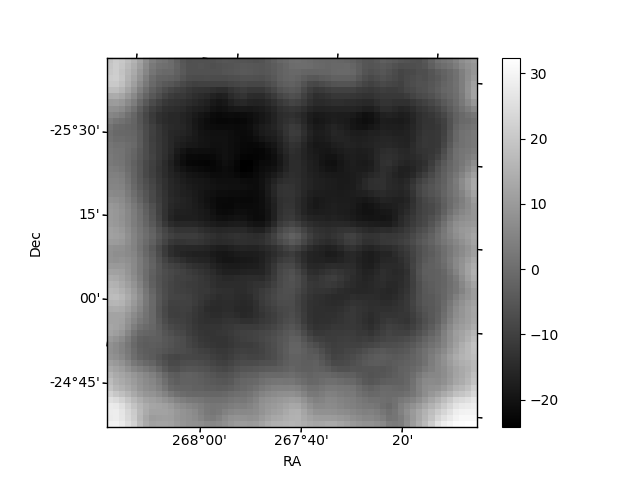
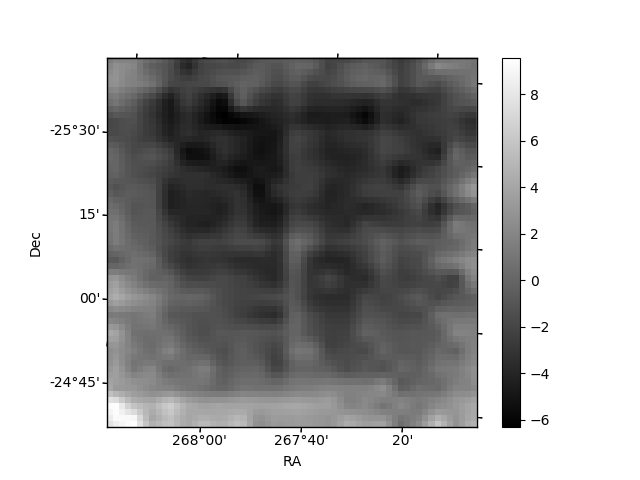
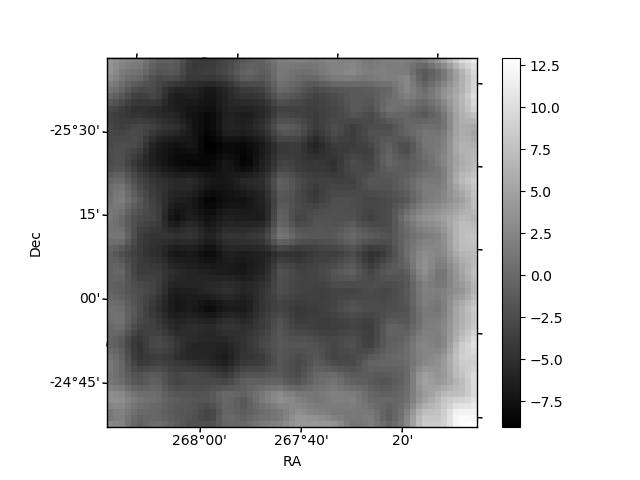
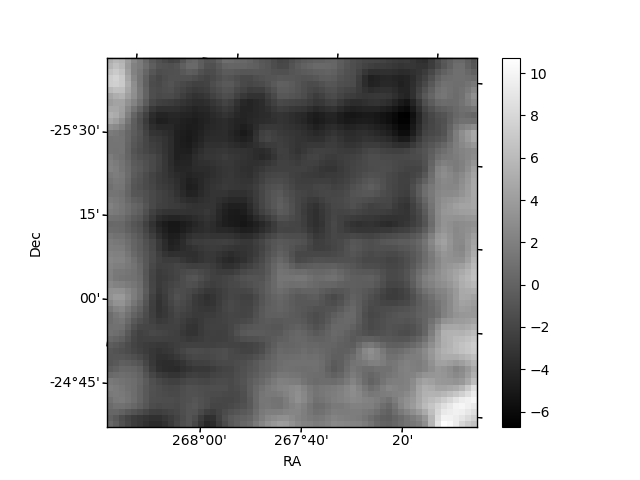
Histogram calculated using DETX and DETY for each event in the final _common_clean file
| Quadrant A | 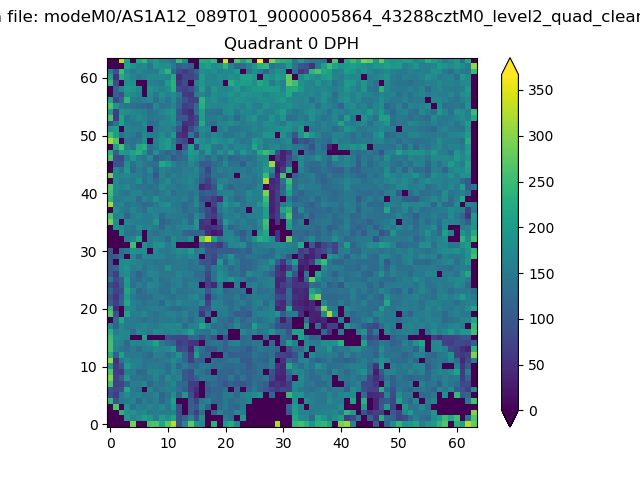 |
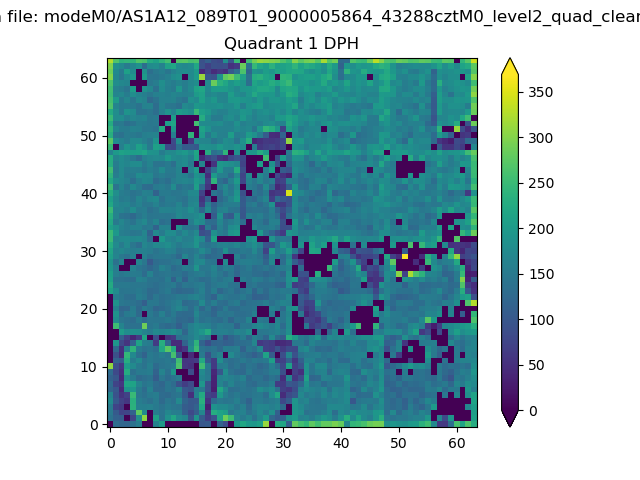 |
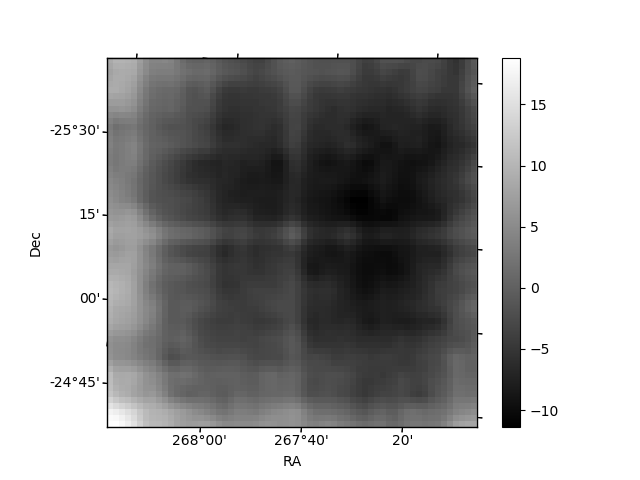
Quadrant B |
|---|---|---|---|
| Quadrant D | 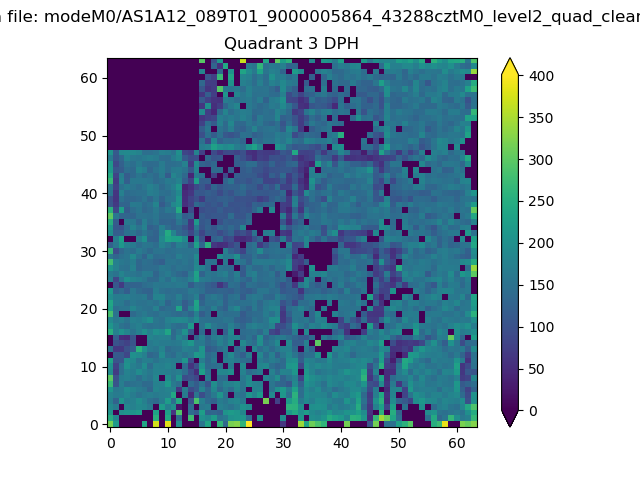 |
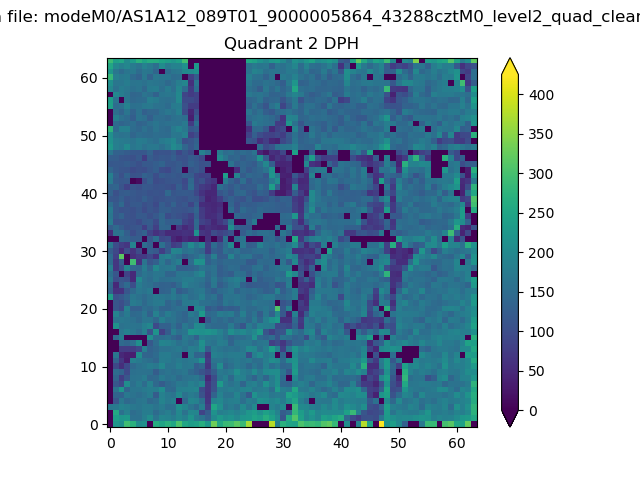 |
Quadrant C |
| Plot type | Count rate plots | Images |
|---|---|---|
| Comparison with Poisson distribution Blue bars denote a histogram of data divided into 1 sec bins. Red curve is a Poisson curve with rate = median count rate of data. |
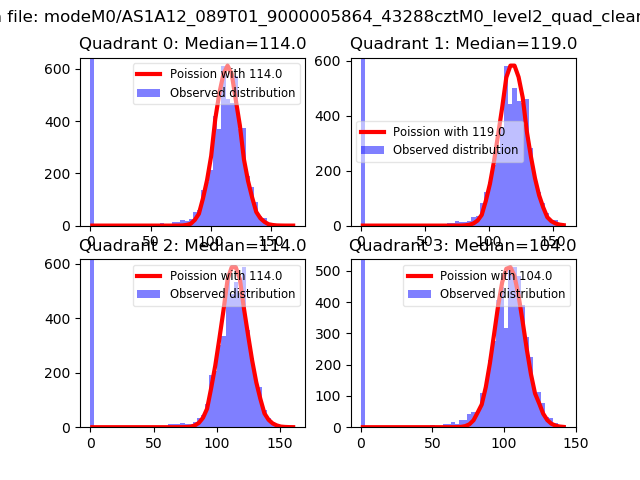 |
 |
| Quadrant-wise count rates Data is divided into 100 sec bins |
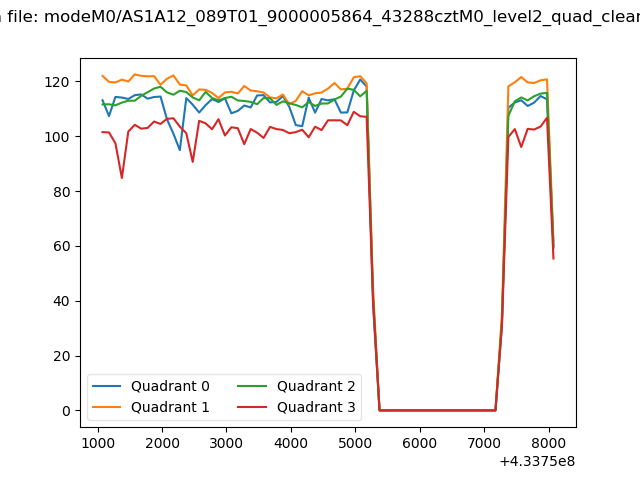 |
|
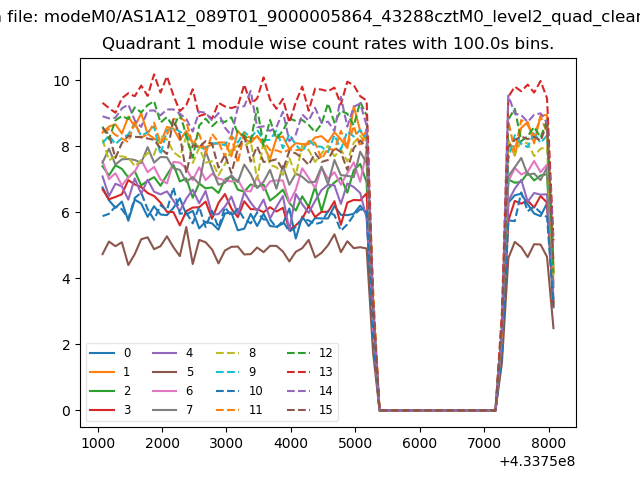
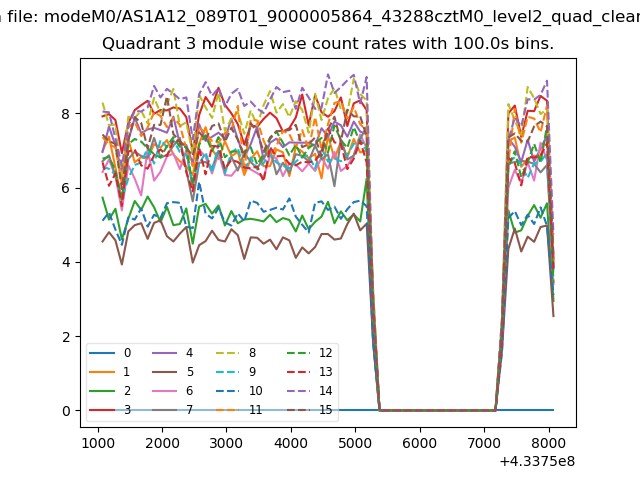
| Module-wise count rates for Quadrant A Data is divided into 100 sec bins |
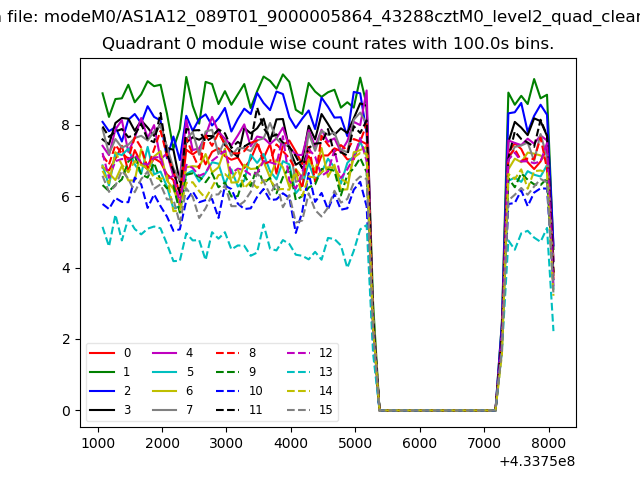 |
 |
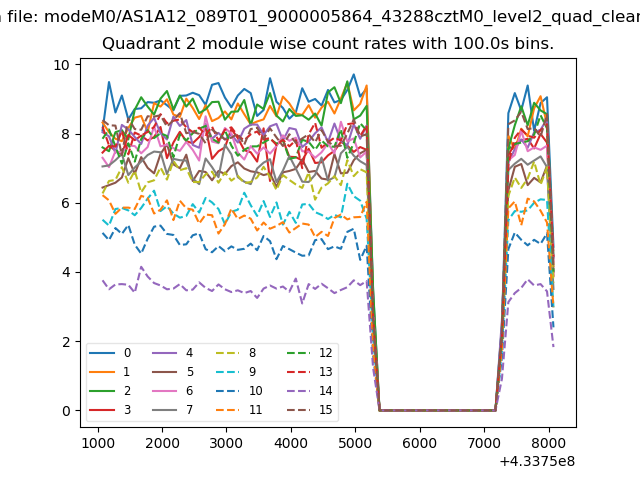
| Module-wise count rates for Quadrant B Data is divided into 100 sec bins |
 |
 |
| Module-wise count rates for Quadrant C Data is divided into 100 sec bins |
 |
 |
| Module-wise count rates for Quadrant D Data is divided into 100 sec bins |
 |
 |
| Parameter | Plot |
|---|---|
| CZT HV Monitor | 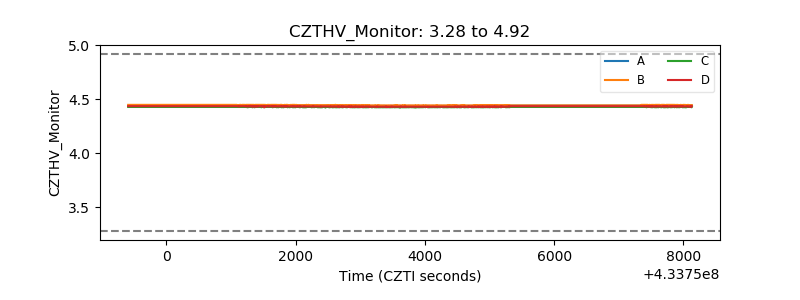 |
| D_VDD | 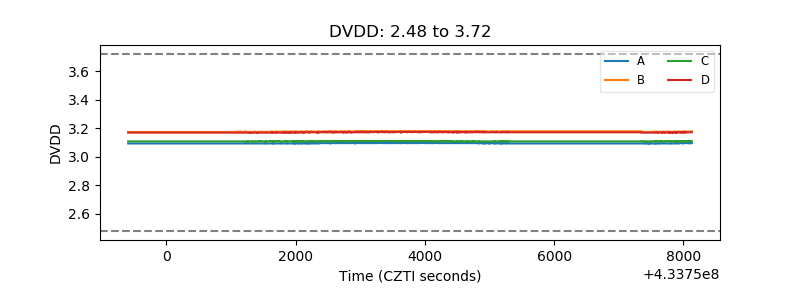 |
| Temperature 1 | 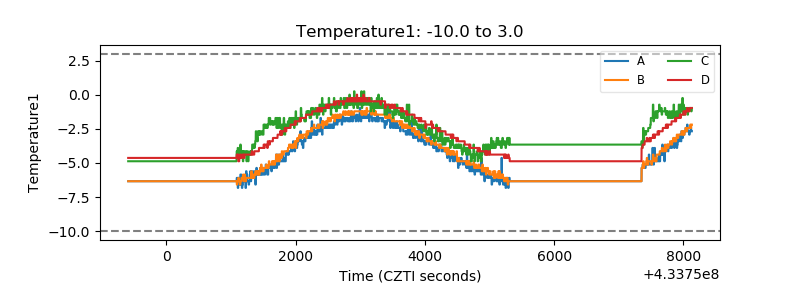 |
| Veto HV Monitor | 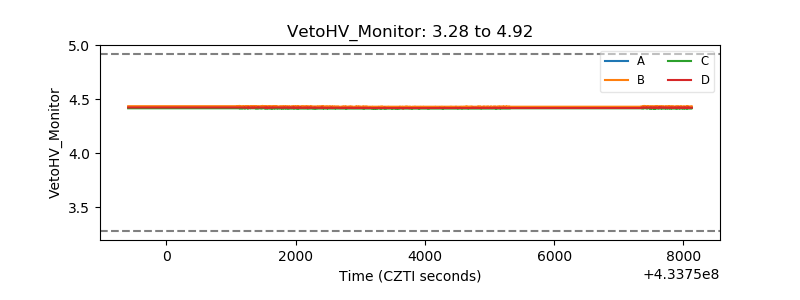 |
| Veto LLD | 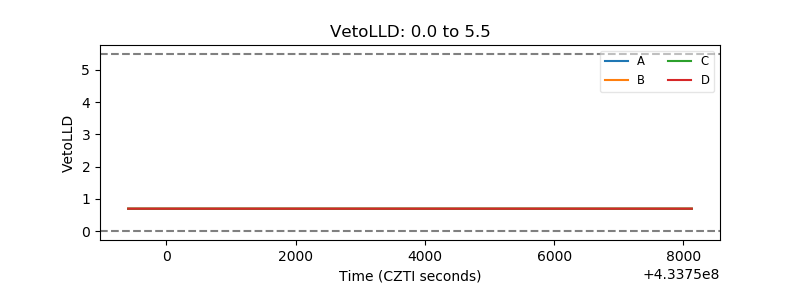 |
| Alpha Counter | 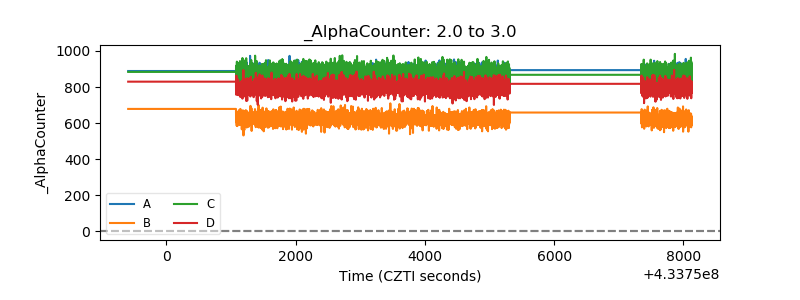 |
| _CPM_Rate | 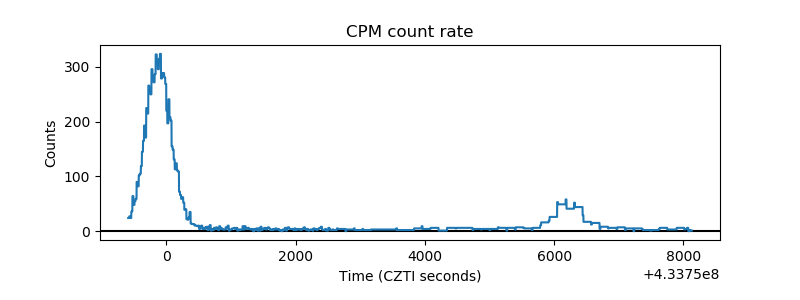 |
| CZT Counter | 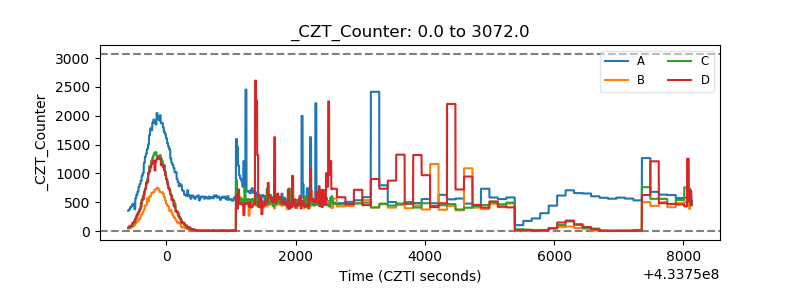 |
| +2.5 Volts monitor | 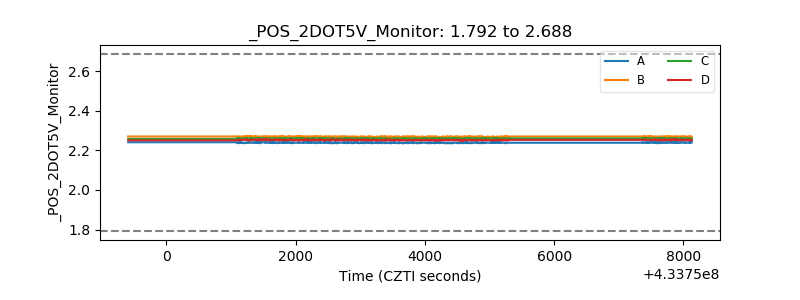 |
| +5 Volts monitor | 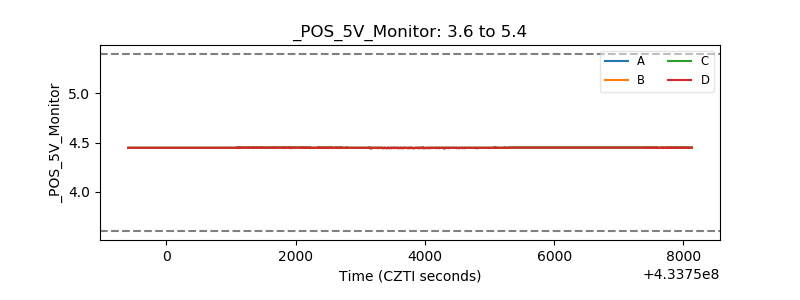 |
| _ROLL_ROT |  |
| _Roll_DEC | 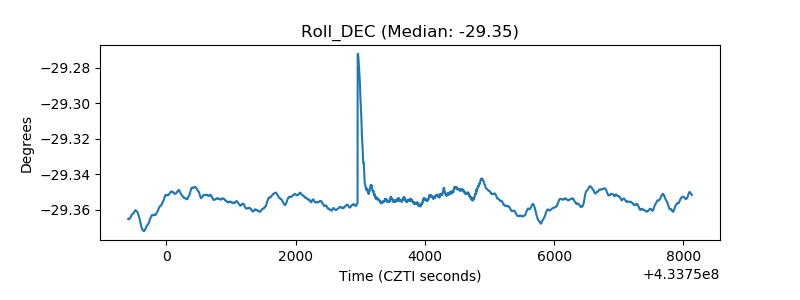 |
| _Roll_RA | 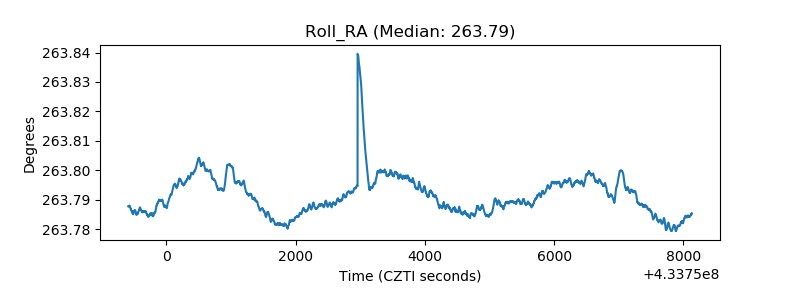 |
| Veto Counter | 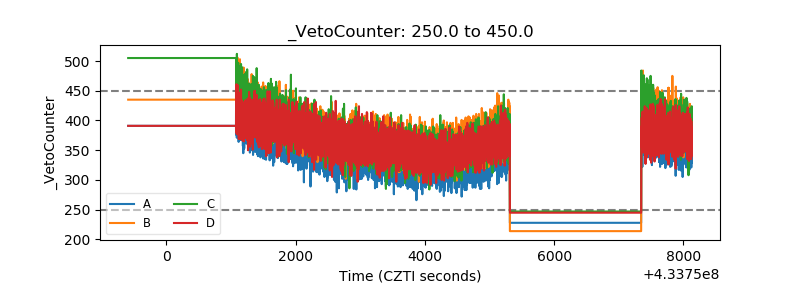 |