| Param | Original file | Final file |
|---|---|---|
| Filename | modeM0/AS1A12_089T01_9000005864_43289cztM0_level2.fits | modeM0/AS1A12_089T01_9000005864_43289cztM0_level2_quad_clean.evt |
| Size (bytes) | 357,929,280 | 87,543,360 |
| Size | 341.3 MB | 83.5 MB |
| Events in quadrant A | 3,995,076 | 579,348 |
| Events in quadrant B | 3,114,571 | 579,831 |
| Events in quadrant C | 2,562,468 | 588,756 |
| Events in quadrant D | 3,163,785 | 531,482 |
| Mode M9 | |||
|---|---|---|---|
| Quadrant | BADHDUFLAG | Total packets | Discarded packets |
| A | 0 | 31 | 0 |
| B | 0 | 32 | 0 |
| C | 0 | 32 | 0 |
| D | 0 | 32 | 0 |
| Mode SS | |||
|---|---|---|---|
| Quadrant | BADHDUFLAG | Total packets | Discarded packets |
| A | 0 | 106 | 0 |
| B | 0 | 106 | 0 |
| C | 0 | 106 | 0 |
| D | 0 | 106 | 0 |
| Mode M0 | |||
|---|---|---|---|
| Quadrant | BADHDUFLAG | Total packets | Discarded packets |
| A | 0 | 15361 | 2 |
| B | 0 | 12824 | 2 |
| C | 0 | 10917 | 2 |
| D | 0 | 13033 | 2 |
| Quadrant | Total seconds | Saturated seconds | Saturation percentage |
|---|---|---|---|
| A | 5310 | 206 | 3.879473% |
| B | 5310 | 286 | 5.386064% |
| C | 5310 | 12 | 0.225989% |
| D | 5310 | 117 | 2.203390% |
Noise dominated data is calculated using 1-second bins in cleaned event files. If a bin has >2000 counts, and if more than 50% of those come from <1% of pixels, then it is considered to be noise-dominated and hence unusable.
| Quadrant | # 1 sec bins | Bins with >0 counts | Bins with >2000 counts | High rate bins dominated by noise | Noise dominated (total time) | Noise dominated (detector-on time) | Marked lightcurve |
|---|---|---|---|---|---|---|---|
| A | 7042 | 5311 | 185 | 185 | 2.63% | 3.48% | 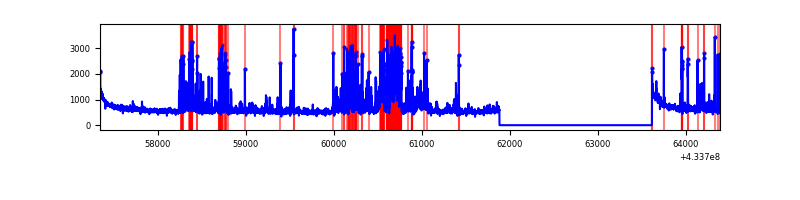 |
| B | 7042 | 5311 | 252 | 252 | 3.58% | 4.74% | 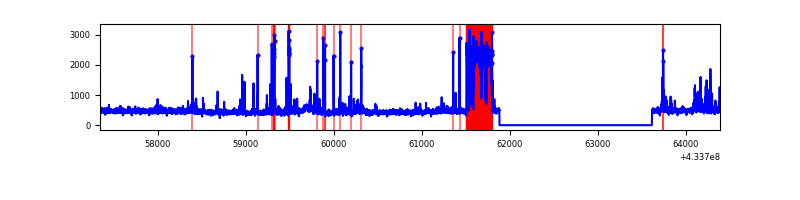 |
| C | 7042 | 5311 | 6 | 6 | 0.09% | 0.11% | 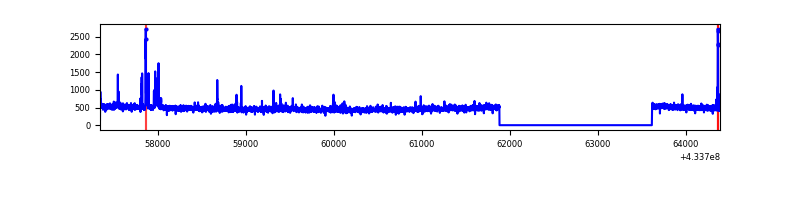 |
| D | 7042 | 5311 | 120 | 120 | 1.70% | 2.26% | 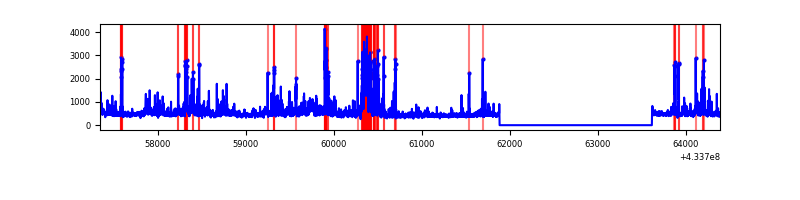 |
Top three noisy pixels from each quadrant. If the there are fewer than three noisy pixels in the level2.evt file, extra rows are filled as -1
| Pixel properties | Quadrant properties | ||||||
|---|---|---|---|---|---|---|---|
| Quadrant | DetID | PixID | Counts | Sigma | Mean | Median | Sigma |
| A | 10 | 83 | 608128 | 5070.63 | 581 | 570 | 119.8 |
| A | 15 | 237 | 530669 | 4424.16 | 581 | 570 | 119.8 |
| A | 7 | 3 | 382778 | 3189.88 | 581 | 570 | 119.8 |
| B | 5 | 172 | 692061 | 6221.22 | 567 | 551 | 111.2 |
| B | 0 | 186 | 71900 | 641.89 | 567 | 551 | 111.2 |
| B | 0 | 189 | 50944 | 453.36 | 567 | 551 | 111.2 |
| C | 15 | 214 | 228488 | 1674.78 | 573 | 576 | 136.1 |
| C | 14 | 254 | 72879 | 531.31 | 573 | 576 | 136.1 |
| C | 3 | 233 | 26393 | 189.71 | 573 | 576 | 136.1 |
| D | 1 | 52 | 371719 | 2636.97 | 571 | 556 | 140.8 |
| D | 12 | 233 | 259425 | 1839.17 | 571 | 556 | 140.8 |
| D | 13 | 249 | 83673 | 590.52 | 571 | 556 | 140.8 |
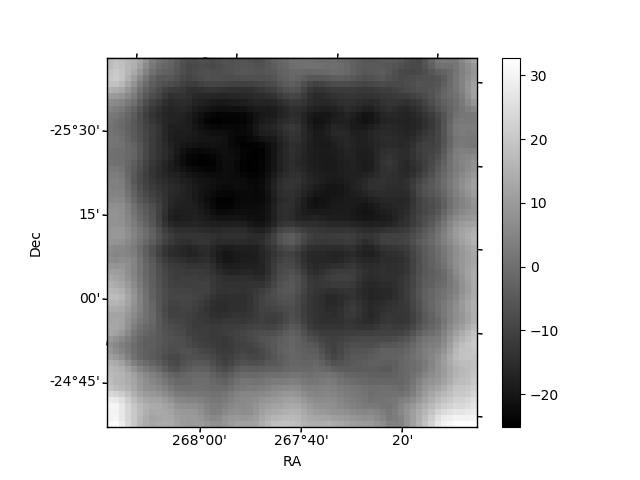
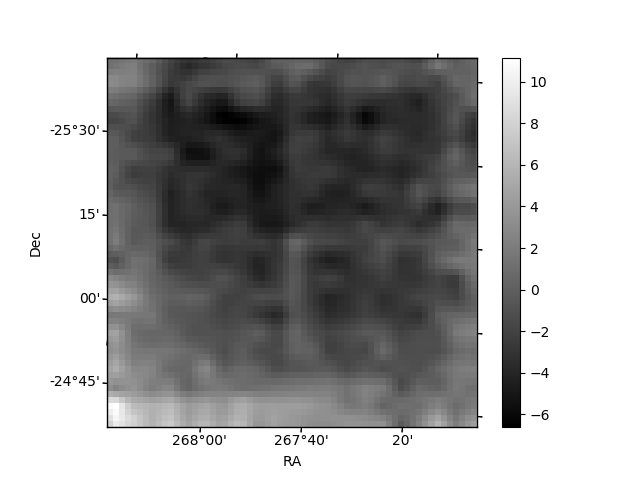
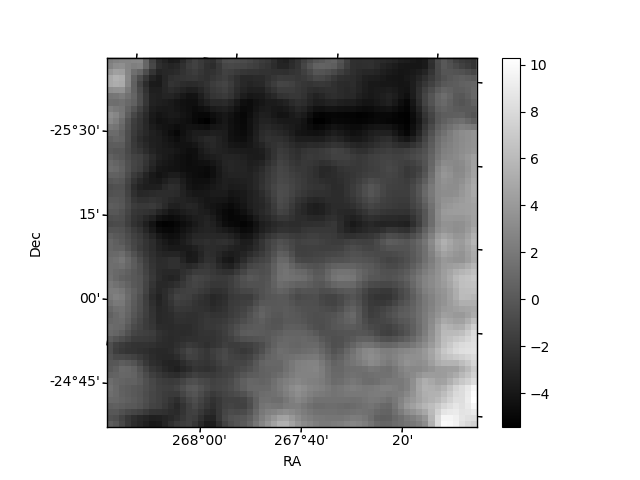
Histogram calculated using DETX and DETY for each event in the final _common_clean file
| Quadrant A | 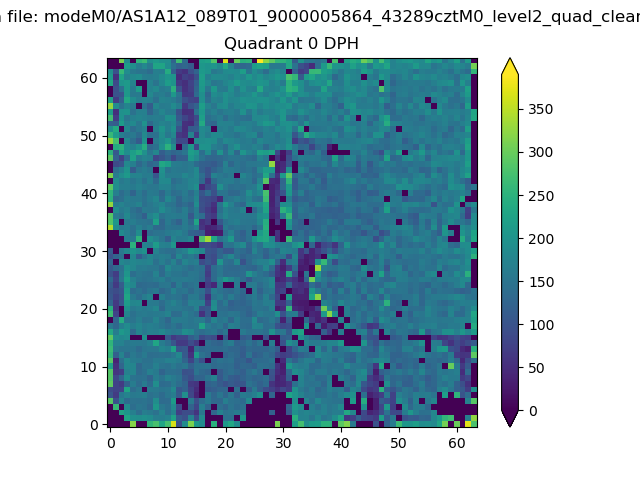 |
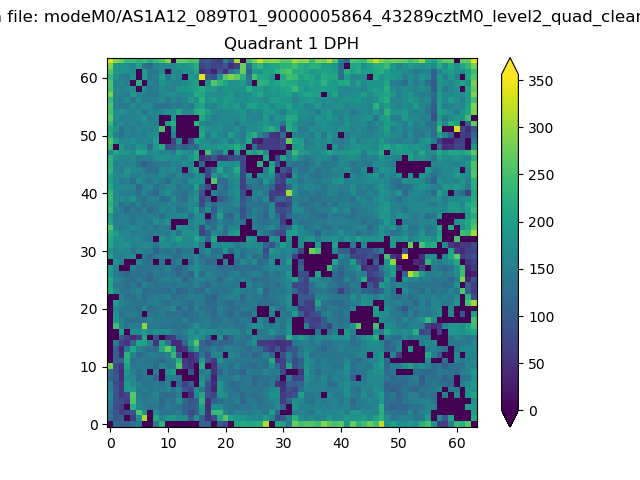 |
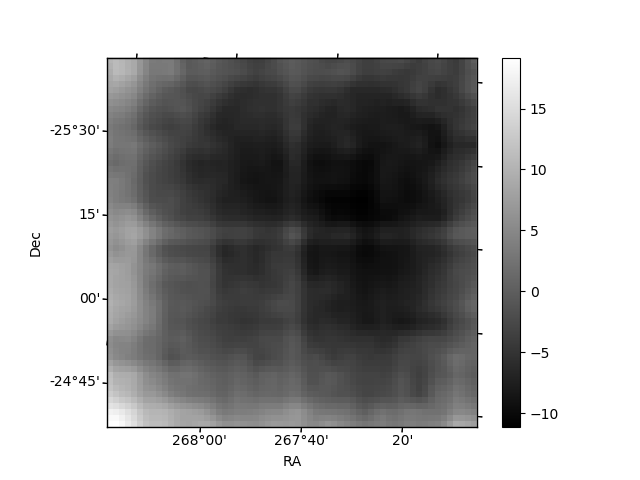
Quadrant B |
|---|---|---|---|
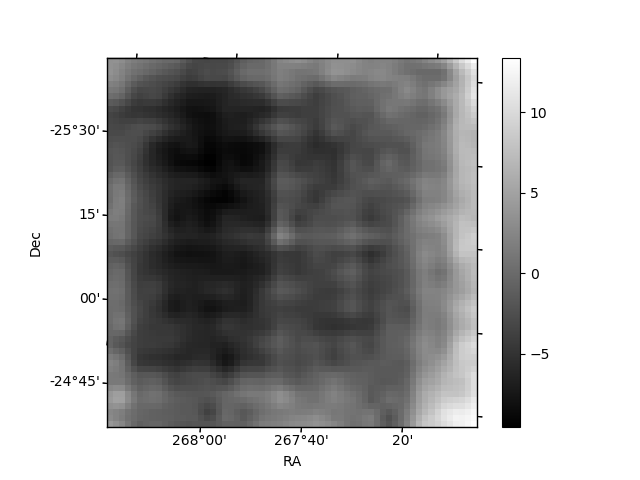
| Quadrant D | 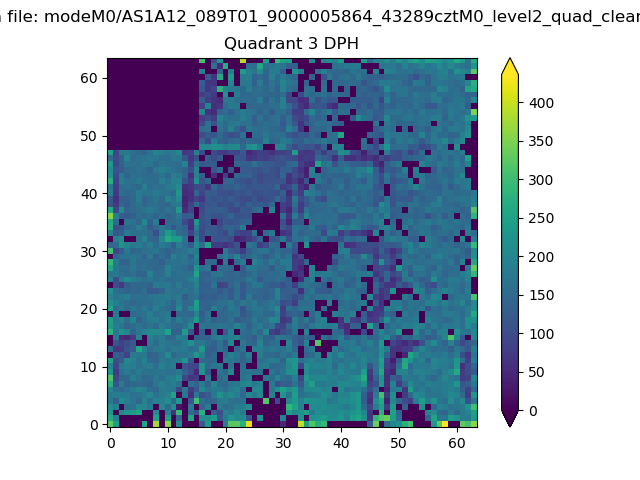 |
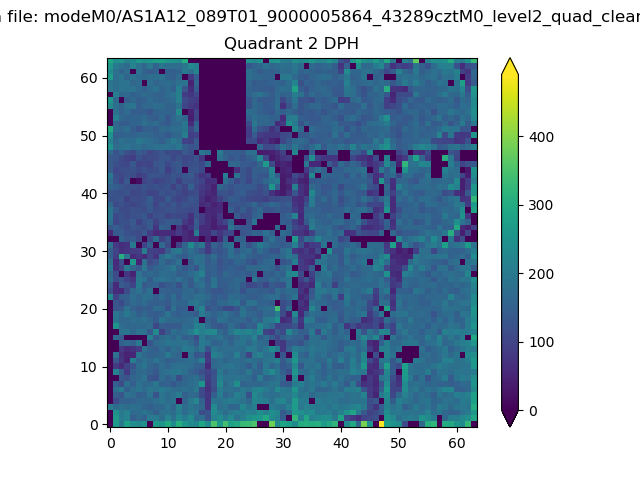 |
Quadrant C |
| Plot type | Count rate plots | Images |
|---|---|---|
| Comparison with Poisson distribution Blue bars denote a histogram of data divided into 1 sec bins. Red curve is a Poisson curve with rate = median count rate of data. |
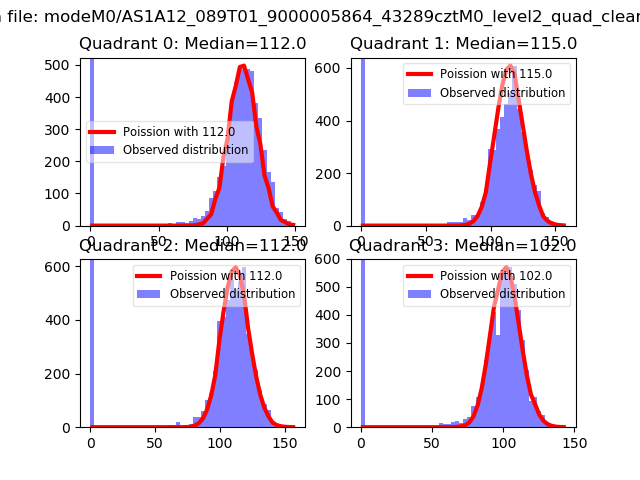 |
 |
| Quadrant-wise count rates Data is divided into 100 sec bins |
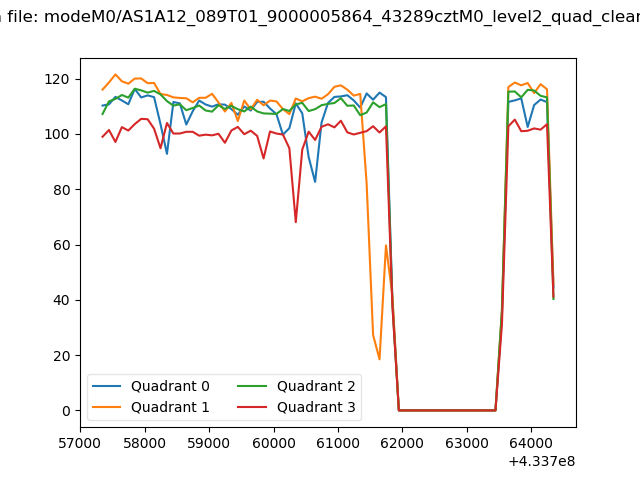 |
|
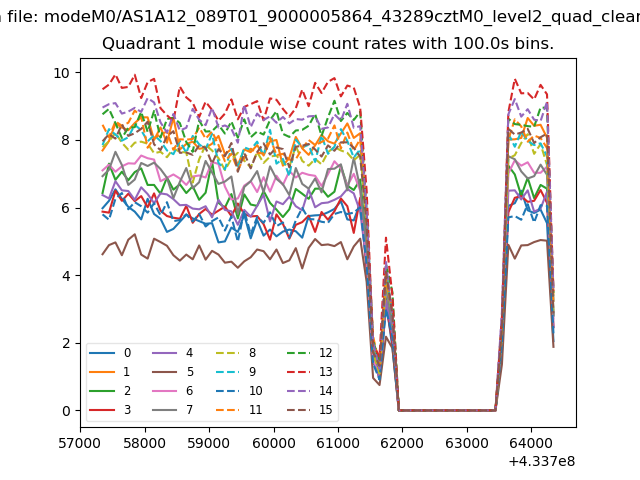
| Module-wise count rates for Quadrant A Data is divided into 100 sec bins |
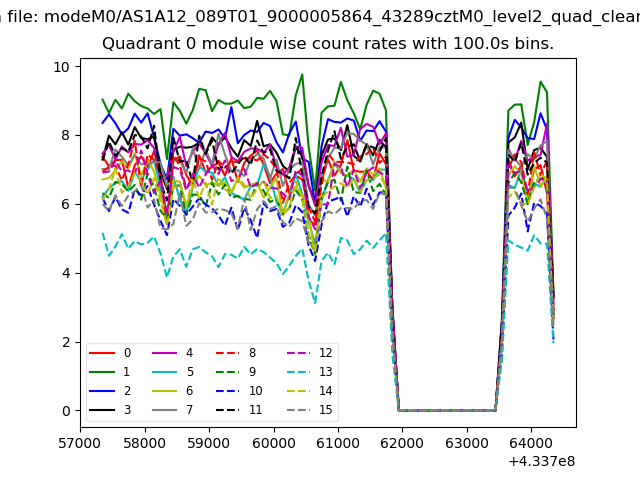 |
 |
| Module-wise count rates for Quadrant B Data is divided into 100 sec bins |
 |
 |
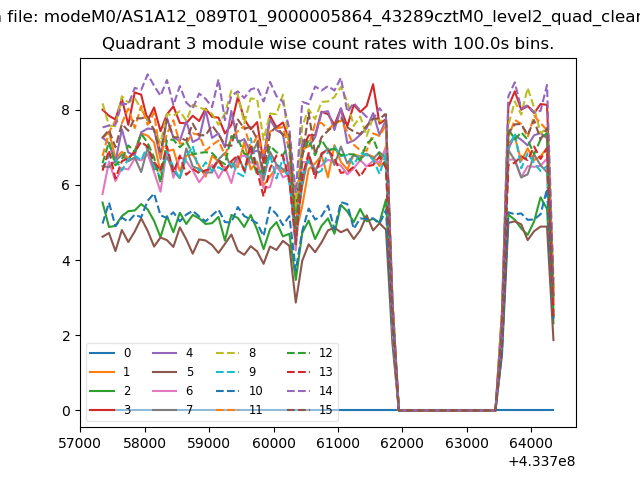
| Module-wise count rates for Quadrant C Data is divided into 100 sec bins |
 |
 |
| Module-wise count rates for Quadrant D Data is divided into 100 sec bins |
 |
 |
| Parameter | Plot |
|---|---|
| CZT HV Monitor |  |
| D_VDD | 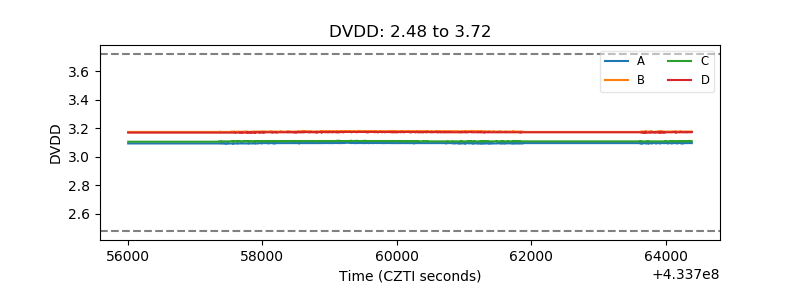 |
| Temperature 1 | 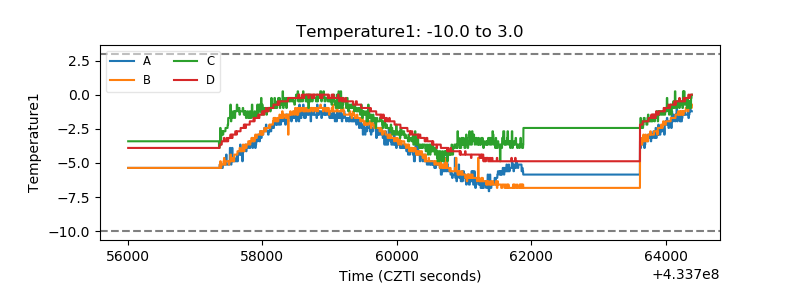 |
| Veto HV Monitor | 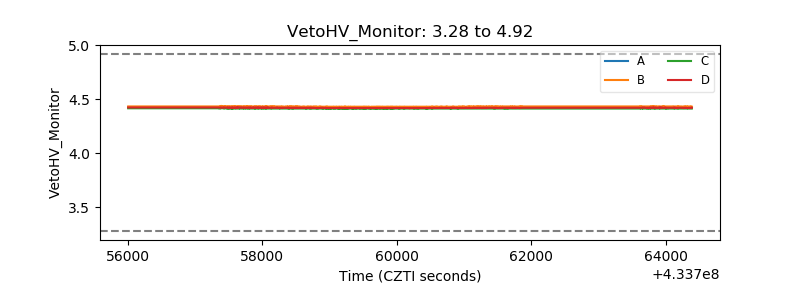 |
| Veto LLD | 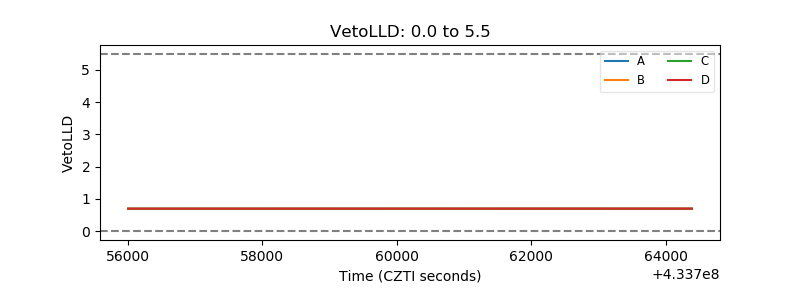 |
| Alpha Counter | 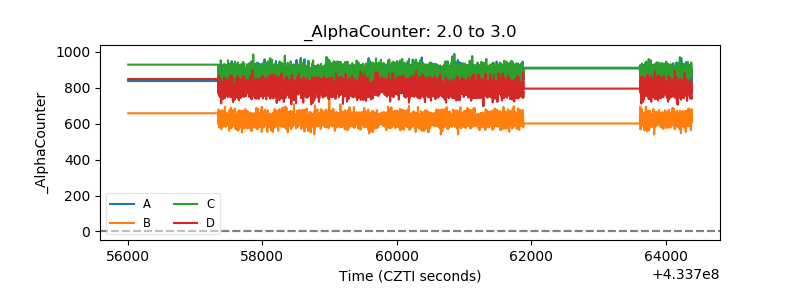 |
| _CPM_Rate | 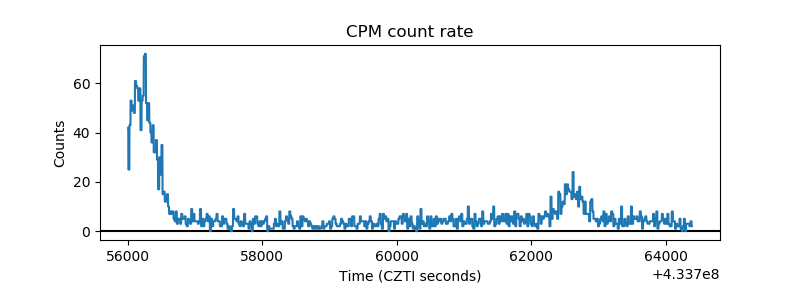 |
| CZT Counter | 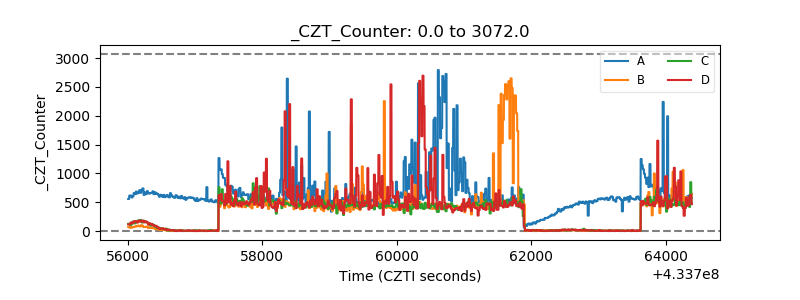 |
| +2.5 Volts monitor | 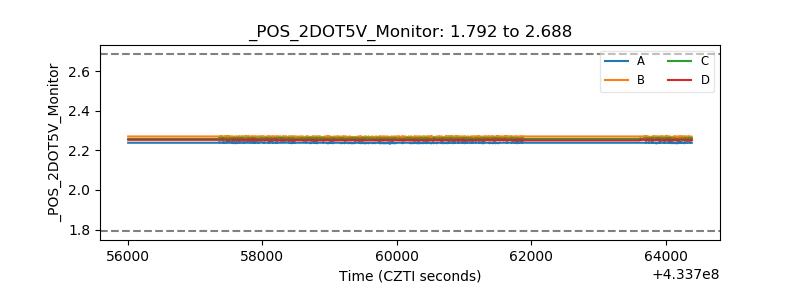 |
| +5 Volts monitor | 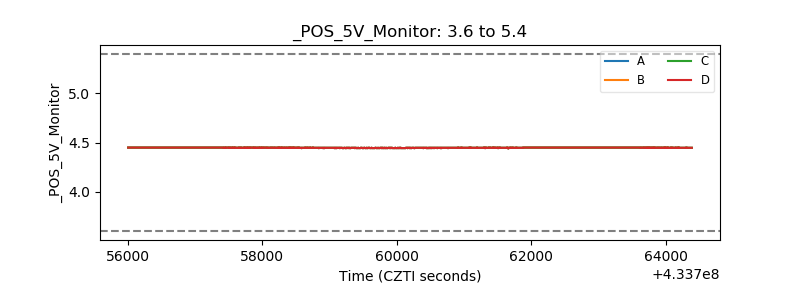 |
| _ROLL_ROT | 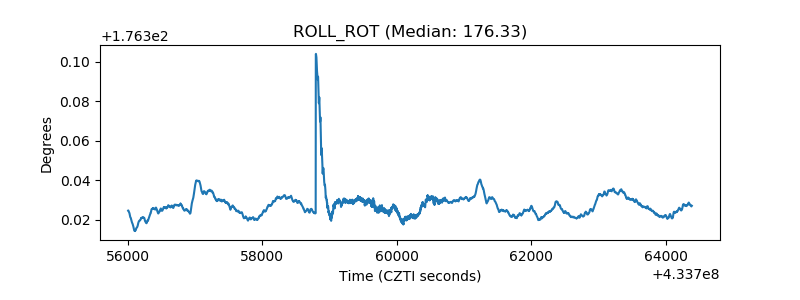 |
| _Roll_DEC | 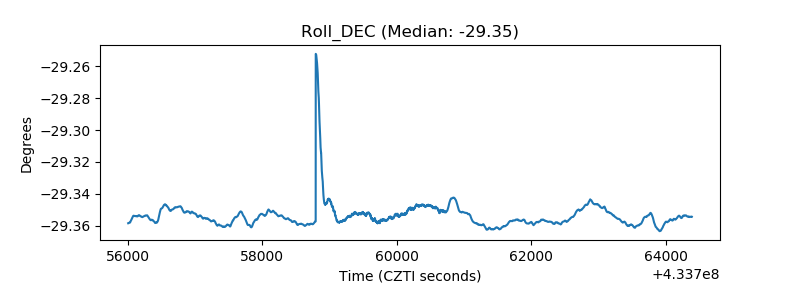 |
| _Roll_RA | 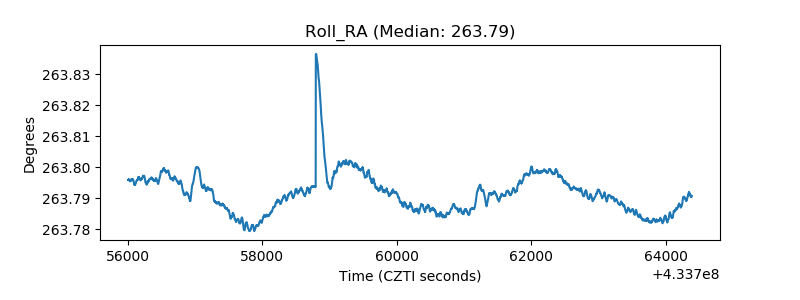 |
| Veto Counter | 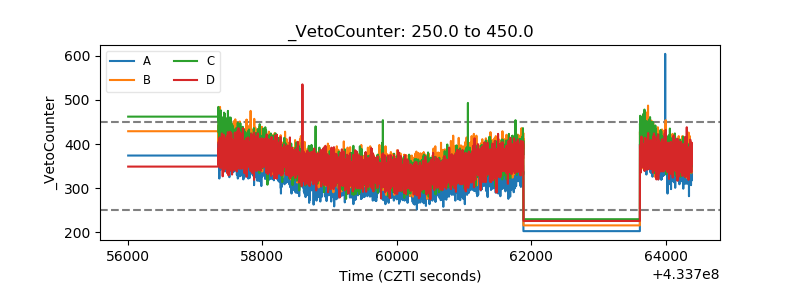 |