| Param | Original file | Final file |
|---|---|---|
| Filename | modeM0/AS1A12_089T01_9000005864_43290cztM0_level2.fits | modeM0/AS1A12_089T01_9000005864_43290cztM0_level2_quad_clean.evt |
| Size (bytes) | 393,318,720 | 91,946,880 |
| Size | 375.1 MB | 87.7 MB |
| Events in quadrant A | 4,755,526 | 575,203 |
| Events in quadrant B | 2,950,417 | 636,582 |
| Events in quadrant C | 2,749,682 | 620,837 |
| Events in quadrant D | 3,661,341 | 554,216 |
| Mode M9 | |||
|---|---|---|---|
| Quadrant | BADHDUFLAG | Total packets | Discarded packets |
| A | 0 | 27 | 0 |
| B | 0 | 28 | 0 |
| C | 0 | 28 | 0 |
| D | 0 | 28 | 0 |
| Mode SS | |||
|---|---|---|---|
| Quadrant | BADHDUFLAG | Total packets | Discarded packets |
| A | 0 | 114 | 0 |
| B | 0 | 114 | 0 |
| C | 0 | 114 | 0 |
| D | 0 | 114 | 0 |
| Mode M0 | |||
|---|---|---|---|
| Quadrant | BADHDUFLAG | Total packets | Discarded packets |
| A | 0 | 17841 | 2 |
| B | 0 | 12624 | 2 |
| C | 0 | 11767 | 3 |
| D | 0 | 14719 | 2 |
| Quadrant | Total seconds | Saturated seconds | Saturation percentage |
|---|---|---|---|
| A | 5684 | 560 | 9.852217% |
| B | 5684 | 111 | 1.952850% |
| C | 5683 | 17 | 0.299138% |
| D | 5683 | 237 | 4.170333% |
Noise dominated data is calculated using 1-second bins in cleaned event files. If a bin has >2000 counts, and if more than 50% of those come from <1% of pixels, then it is considered to be noise-dominated and hence unusable.
| Quadrant | # 1 sec bins | Bins with >0 counts | Bins with >2000 counts | High rate bins dominated by noise | Noise dominated (total time) | Noise dominated (detector-on time) | Marked lightcurve |
|---|---|---|---|---|---|---|---|
| A | 7085 | 5685 | 478 | 478 | 6.75% | 8.41% | 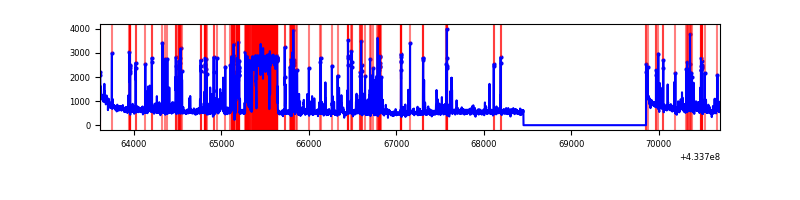 |
| B | 7085 | 5685 | 89 | 89 | 1.26% | 1.57% | 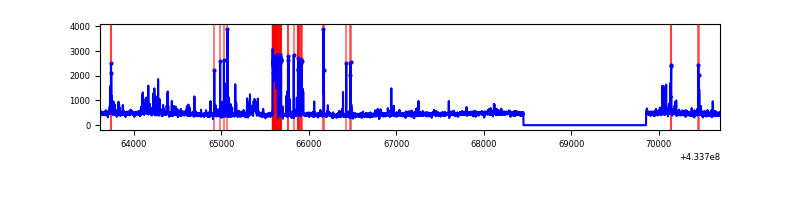 |
| C | 7084 | 5684 | 17 | 17 | 0.24% | 0.30% | 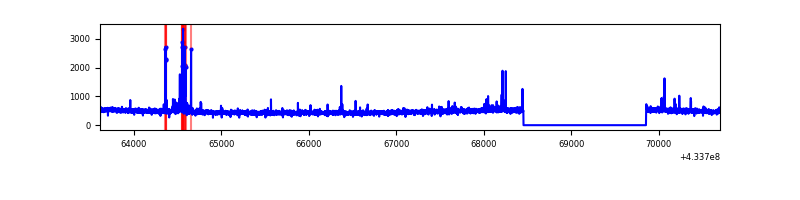 |
| D | 7084 | 5684 | 215 | 215 | 3.04% | 3.78% | 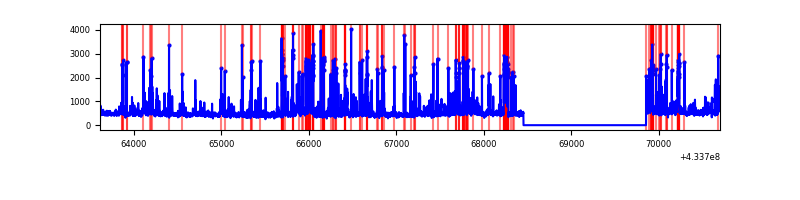 |
Top three noisy pixels from each quadrant. If the there are fewer than three noisy pixels in the level2.evt file, extra rows are filled as -1
| Pixel properties | Quadrant properties | ||||||
|---|---|---|---|---|---|---|---|
| Quadrant | DetID | PixID | Counts | Sigma | Mean | Median | Sigma |
| A | 15 | 237 | 1597270 | 13028.76 | 592 | 579 | 122.6 |
| A | 10 | 83 | 632281 | 5154.59 | 592 | 579 | 122.6 |
| A | 12 | 189 | 117202 | 951.63 | 592 | 579 | 122.6 |
| B | 5 | 172 | 257337 | 2097.27 | 622 | 605 | 122.4 |
| B | 0 | 186 | 125266 | 1018.37 | 622 | 605 | 122.4 |
| B | 5 | 255 | 71180 | 576.54 | 622 | 605 | 122.4 |
| C | 15 | 214 | 240988 | 1667.14 | 610 | 614 | 144.2 |
| C | 14 | 254 | 99277 | 684.29 | 610 | 614 | 144.2 |
| C | 15 | 159 | 15680 | 104.49 | 610 | 614 | 144.2 |
| D | 1 | 52 | 459883 | 3084.88 | 603 | 587 | 148.9 |
| D | 13 | 249 | 279377 | 1872.5 | 603 | 587 | 148.9 |
| D | 12 | 233 | 256749 | 1720.52 | 603 | 587 | 148.9 |
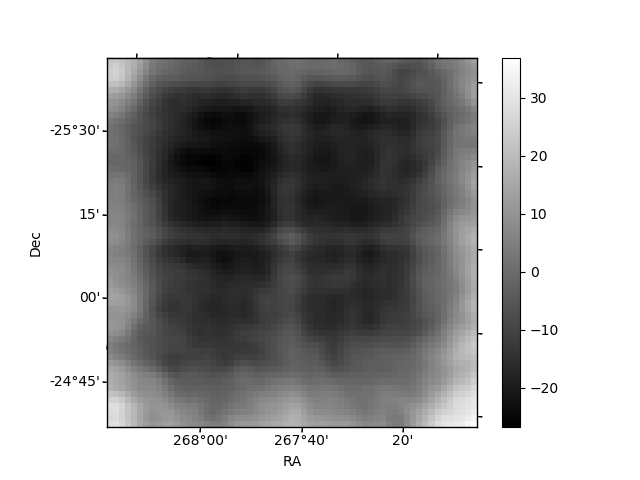
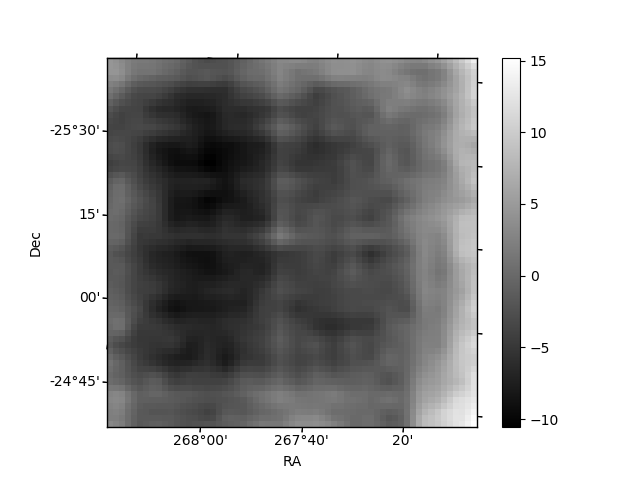
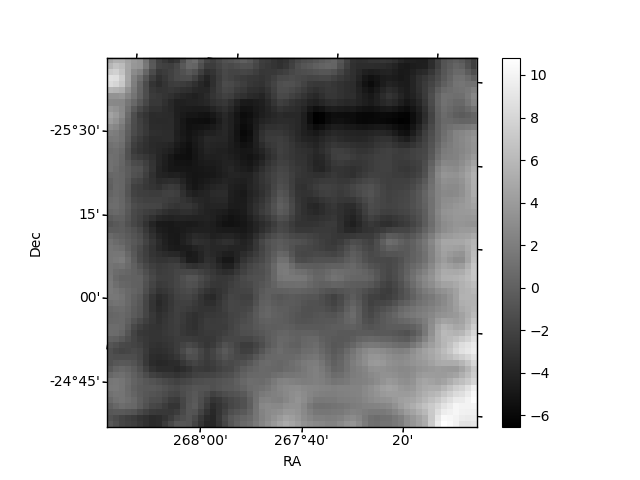
Histogram calculated using DETX and DETY for each event in the final _common_clean file
| Quadrant A | 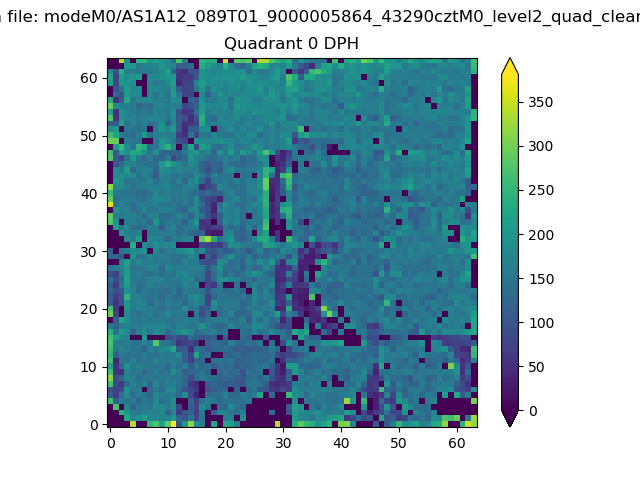 |
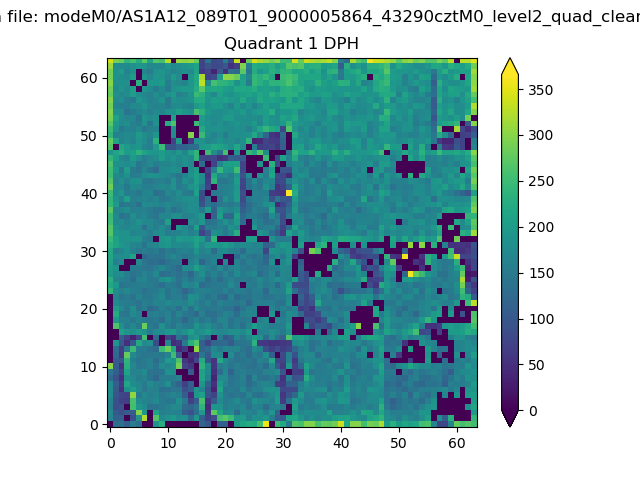 |
Quadrant B |
|---|---|---|---|
| Quadrant D | 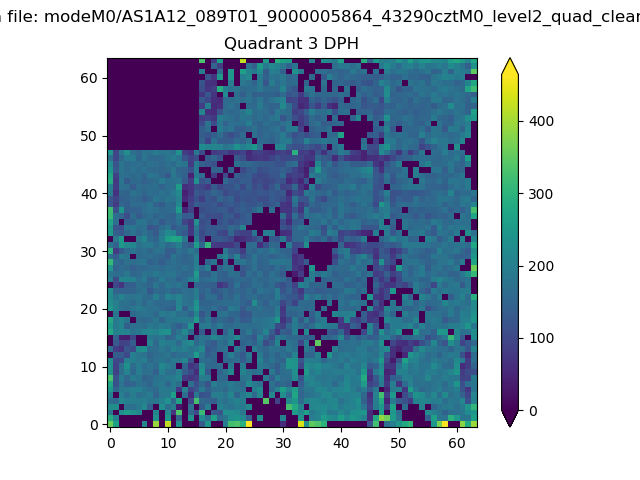 |
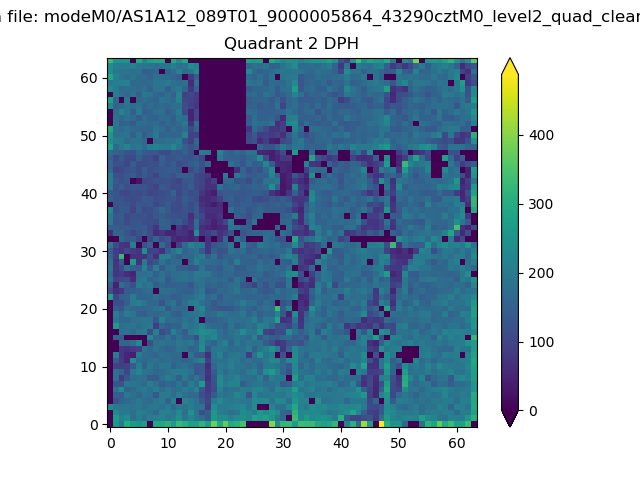 |
Quadrant C |
| Plot type | Count rate plots | Images |
|---|---|---|
| Comparison with Poisson distribution Blue bars denote a histogram of data divided into 1 sec bins. Red curve is a Poisson curve with rate = median count rate of data. |
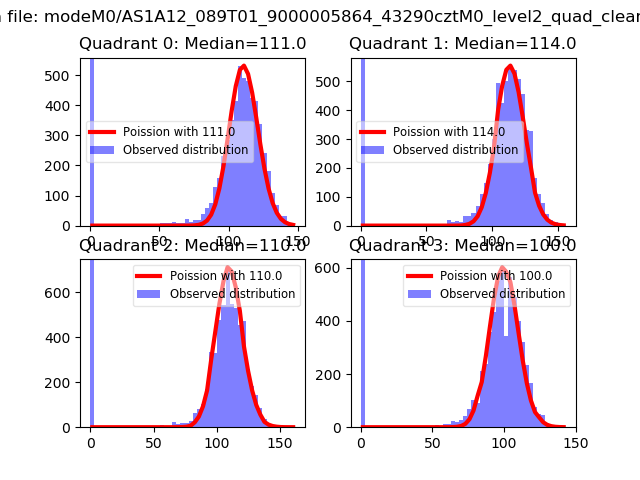 |
 |
| Quadrant-wise count rates Data is divided into 100 sec bins |
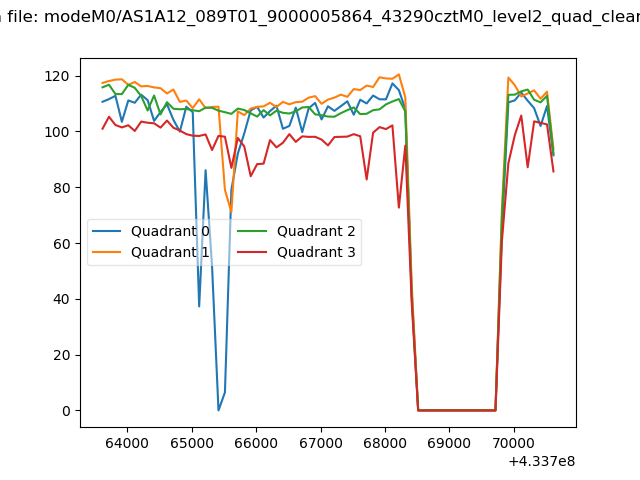 |
|
| Module-wise count rates for Quadrant A Data is divided into 100 sec bins |
 |
 |
| Module-wise count rates for Quadrant B Data is divided into 100 sec bins |
 |
 |
| Module-wise count rates for Quadrant C Data is divided into 100 sec bins |
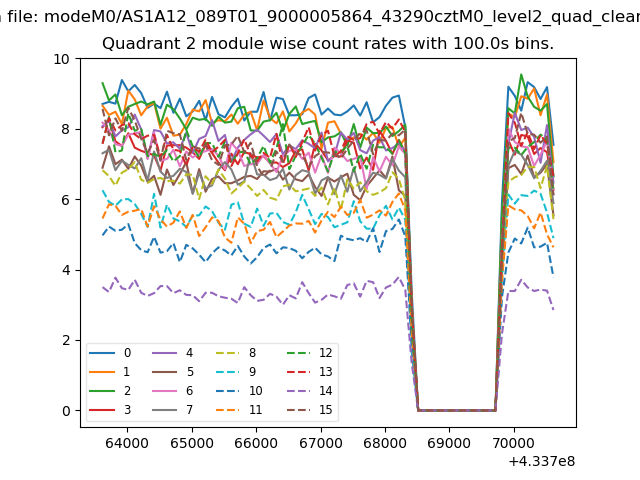 |
 |
| Module-wise count rates for Quadrant D Data is divided into 100 sec bins |
 |
 |
| Parameter | Plot |
|---|---|
| CZT HV Monitor | 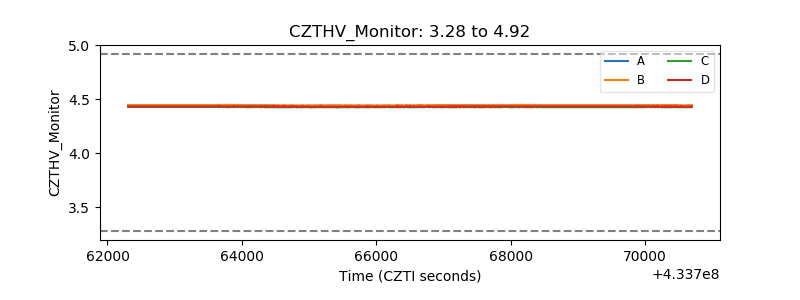 |
| D_VDD | 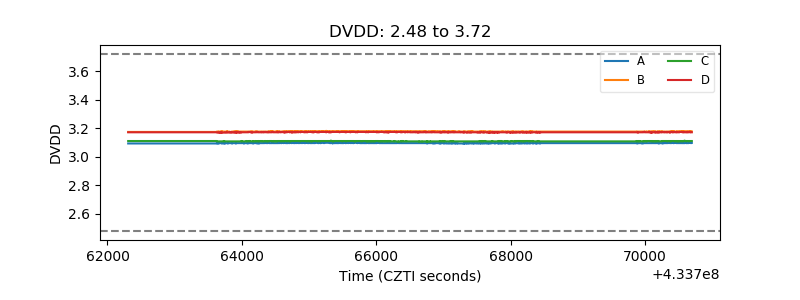 |
| Temperature 1 | 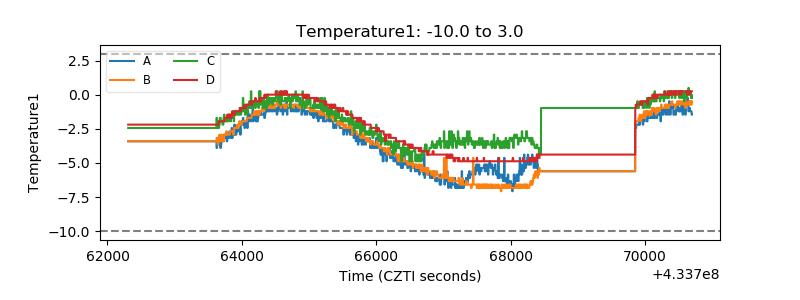 |
| Veto HV Monitor | 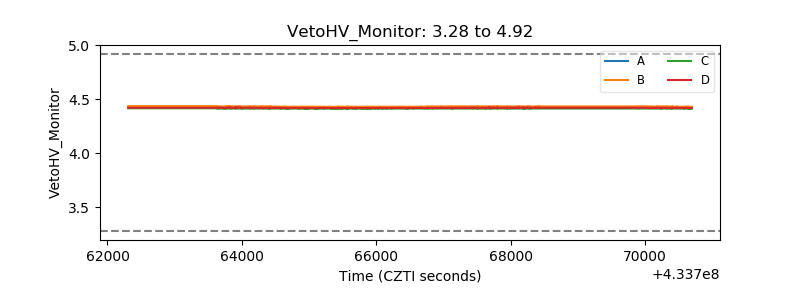 |
| Veto LLD | 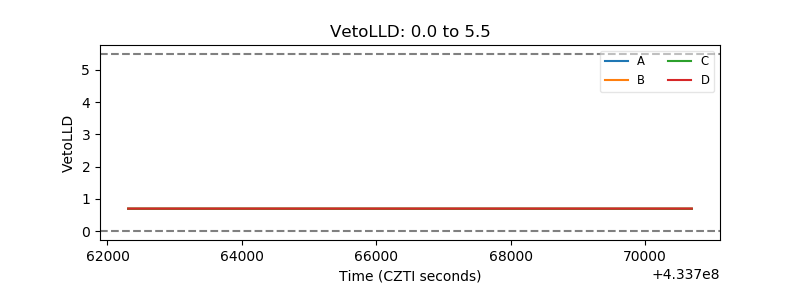 |
| Alpha Counter | 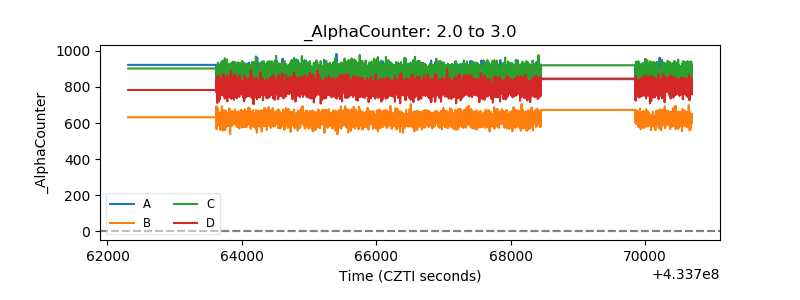 |
| _CPM_Rate | 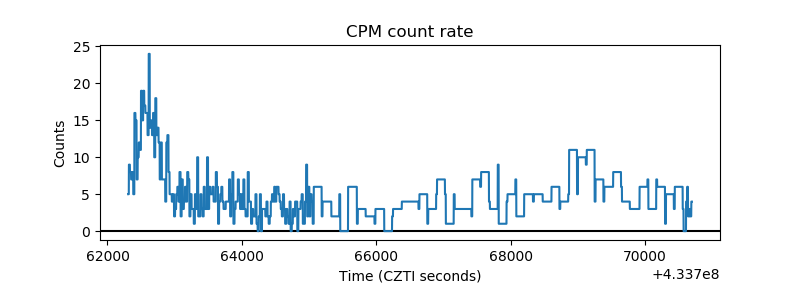 |
| CZT Counter | 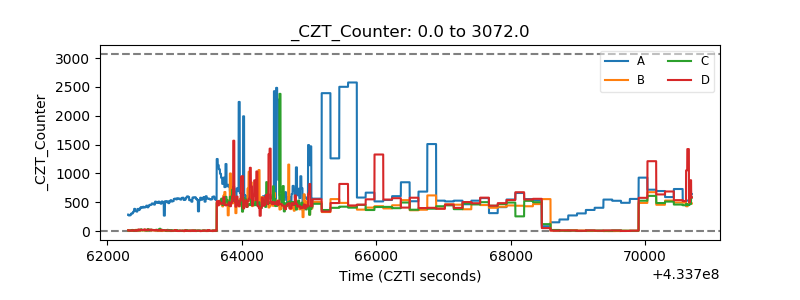 |
| +2.5 Volts monitor | 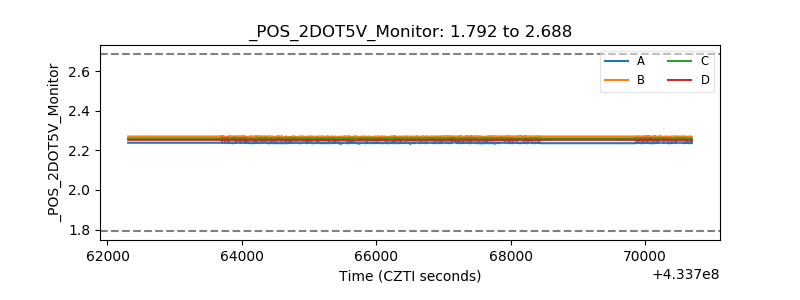 |
| +5 Volts monitor | 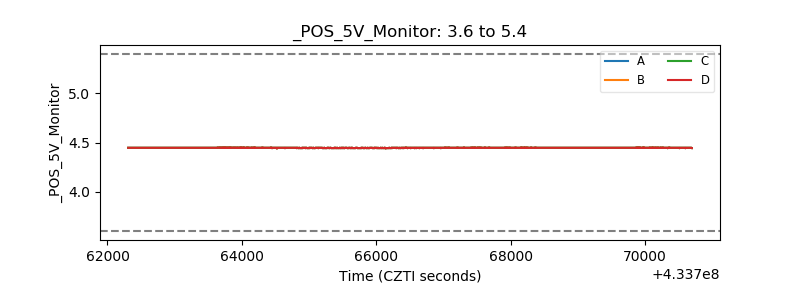 |
| _ROLL_ROT | 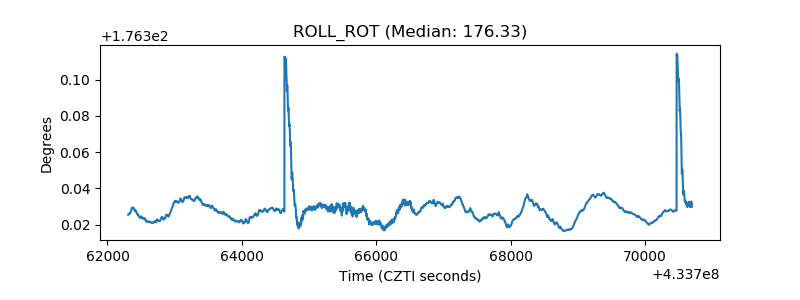 |
| _Roll_DEC | 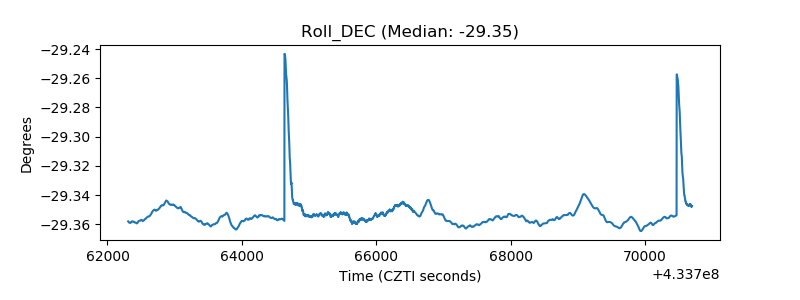 |
| _Roll_RA | 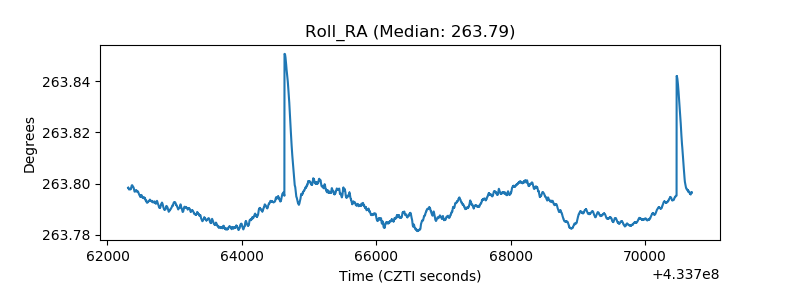 |
| Veto Counter | 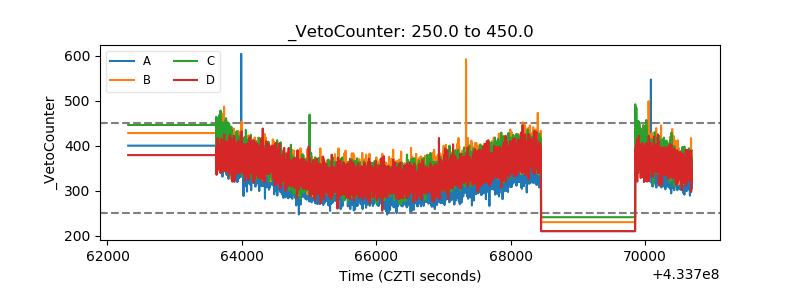 |