| Param | Original file | Final file |
|---|---|---|
| Filename | modeM0/AS1A12_089T01_9000005864_43291cztM0_level2.fits | modeM0/AS1A12_089T01_9000005864_43291cztM0_level2_quad_clean.evt |
| Size (bytes) | 419,279,040 | 96,168,960 |
| Size | 399.9 MB | 91.7 MB |
| Events in quadrant A | 4,765,588 | 612,516 |
| Events in quadrant B | 2,933,104 | 666,315 |
| Events in quadrant C | 2,800,706 | 644,179 |
| Events in quadrant D | 4,555,995 | 570,805 |
| Mode M9 | |||
|---|---|---|---|
| Quadrant | BADHDUFLAG | Total packets | Discarded packets |
| A | 0 | 21 | 0 |
| B | 0 | 22 | 0 |
| C | 0 | 22 | 0 |
| D | 0 | 22 | 0 |
| Mode SS | |||
|---|---|---|---|
| Quadrant | BADHDUFLAG | Total packets | Discarded packets |
| A | 0 | 122 | 0 |
| B | 0 | 122 | 0 |
| C | 0 | 122 | 0 |
| D | 0 | 122 | 0 |
| Mode M0 | |||
|---|---|---|---|
| Quadrant | BADHDUFLAG | Total packets | Discarded packets |
| A | 0 | 17992 | 2 |
| B | 0 | 12760 | 2 |
| C | 0 | 12134 | 2 |
| D | 0 | 17546 | 2 |
| Quadrant | Total seconds | Saturated seconds | Saturation percentage |
|---|---|---|---|
| A | 5980 | 482 | 8.060201% |
| B | 5979 | 49 | 0.819535% |
| C | 5979 | 3 | 0.050176% |
| D | 5979 | 317 | 5.301890% |
Noise dominated data is calculated using 1-second bins in cleaned event files. If a bin has >2000 counts, and if more than 50% of those come from <1% of pixels, then it is considered to be noise-dominated and hence unusable.
| Quadrant | # 1 sec bins | Bins with >0 counts | Bins with >2000 counts | High rate bins dominated by noise | Noise dominated (total time) | Noise dominated (detector-on time) | Marked lightcurve |
|---|---|---|---|---|---|---|---|
| A | 7292 | 5981 | 416 | 416 | 5.70% | 6.96% | 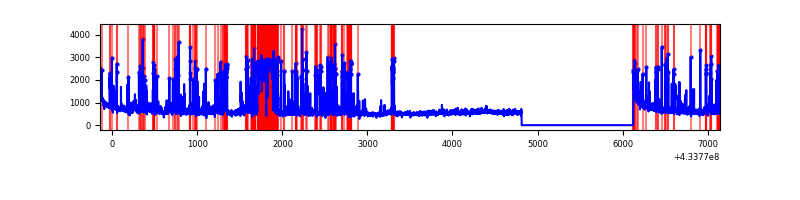 |
| B | 7291 | 5980 | 27 | 27 | 0.37% | 0.45% | 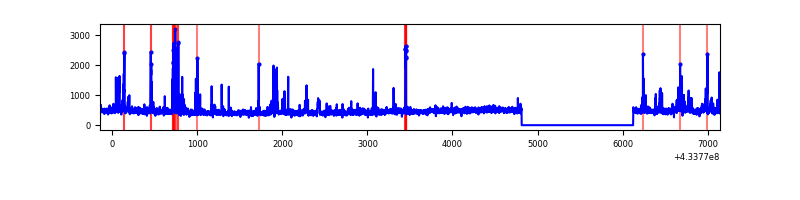 |
| C | 7291 | 5980 | 1 | 1 | 0.01% | 0.02% | 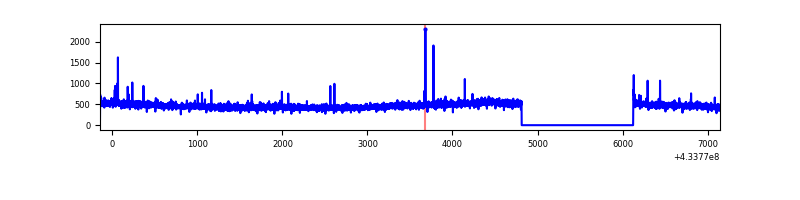 |
| D | 7291 | 5980 | 293 | 293 | 4.02% | 4.90% | 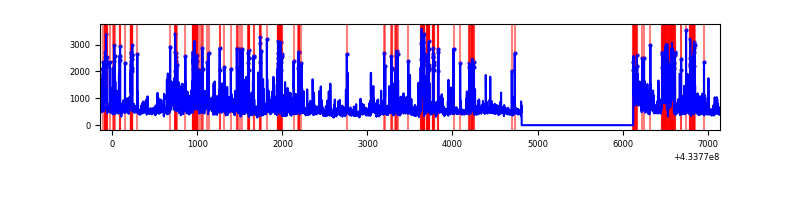 |
Top three noisy pixels from each quadrant. If the there are fewer than three noisy pixels in the level2.evt file, extra rows are filled as -1
| Pixel properties | Quadrant properties | ||||||
|---|---|---|---|---|---|---|---|
| Quadrant | DetID | PixID | Counts | Sigma | Mean | Median | Sigma |
| A | 15 | 237 | 1437088 | 10973.24 | 630 | 618 | 130.9 |
| A | 10 | 83 | 677750 | 5172.63 | 630 | 618 | 130.9 |
| A | 12 | 189 | 120594 | 916.5 | 630 | 618 | 130.9 |
| B | 0 | 186 | 158045 | 1244.48 | 652 | 634 | 126.5 |
| B | 5 | 172 | 57947 | 453.11 | 652 | 634 | 126.5 |
| B | 0 | 190 | 47473 | 370.31 | 652 | 634 | 126.5 |
| C | 15 | 214 | 255492 | 1693.62 | 639 | 642 | 150.5 |
| C | 3 | 233 | 14126 | 89.61 | 639 | 642 | 150.5 |
| C | 14 | 254 | 12282 | 77.35 | 639 | 642 | 150.5 |
| D | 1 | 52 | 939198 | 6060.18 | 625 | 607 | 154.9 |
| D | 2 | 249 | 326458 | 2103.91 | 625 | 607 | 154.9 |
| D | 12 | 233 | 285445 | 1839.11 | 625 | 607 | 154.9 |
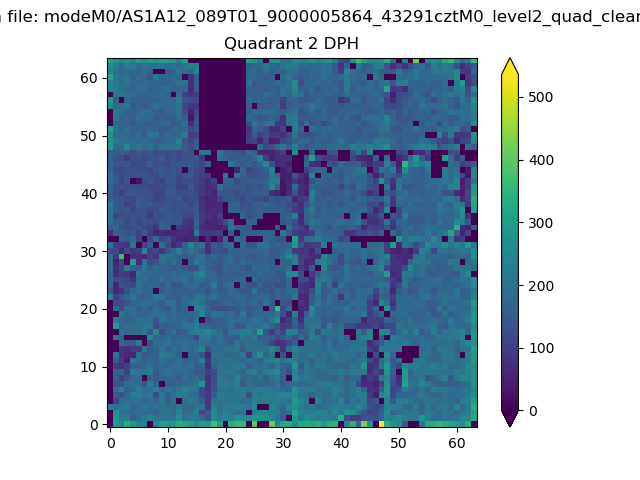
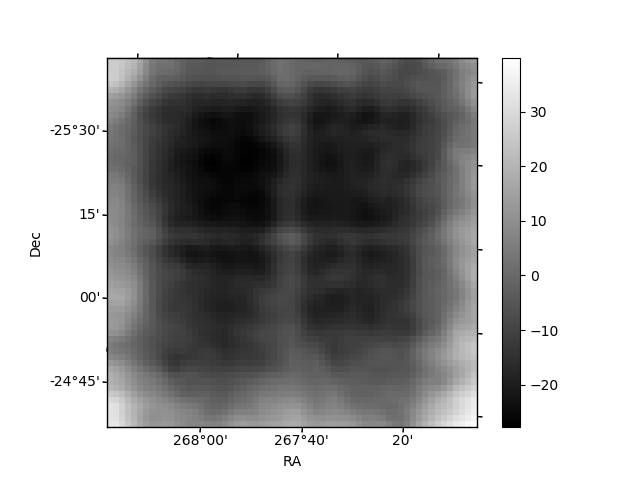
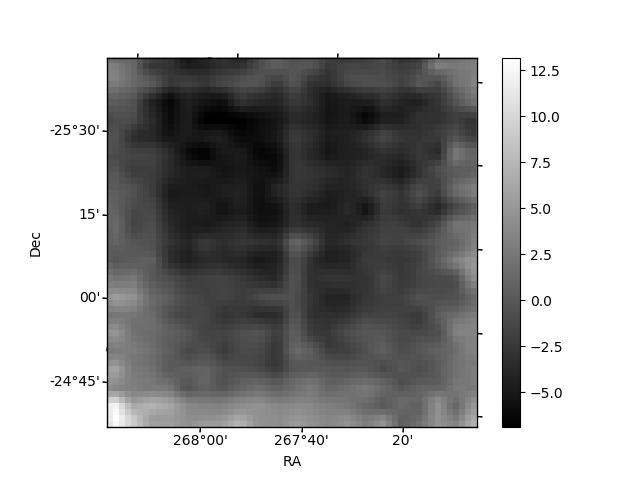
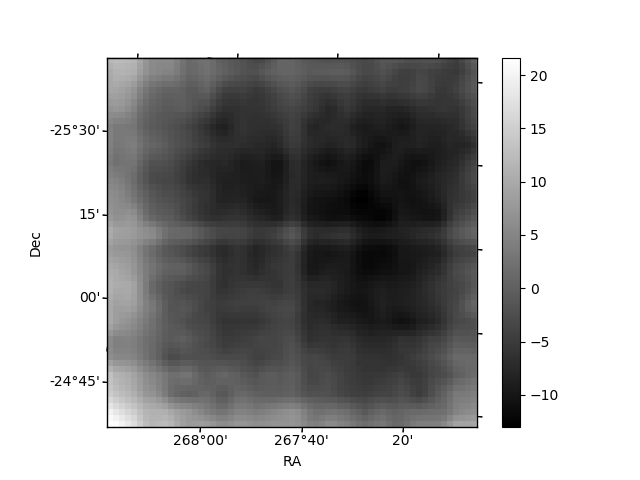
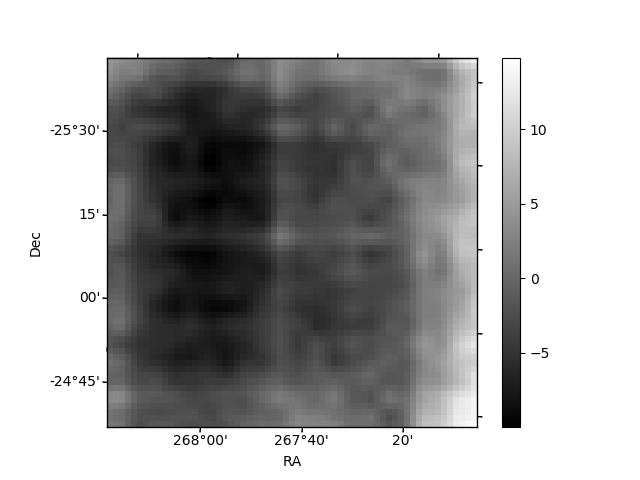
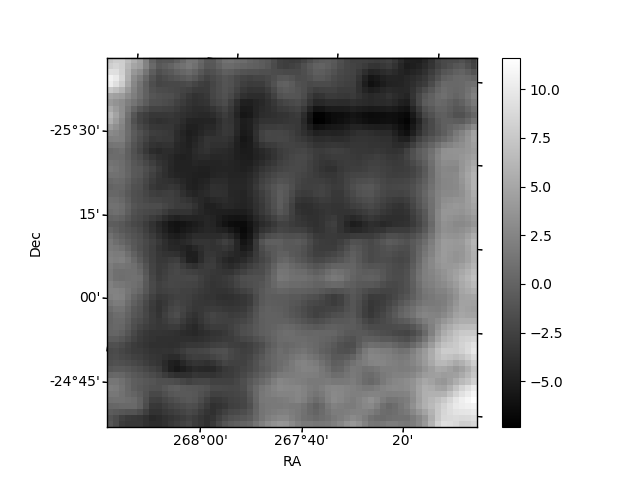
Histogram calculated using DETX and DETY for each event in the final _common_clean file
| Quadrant A | 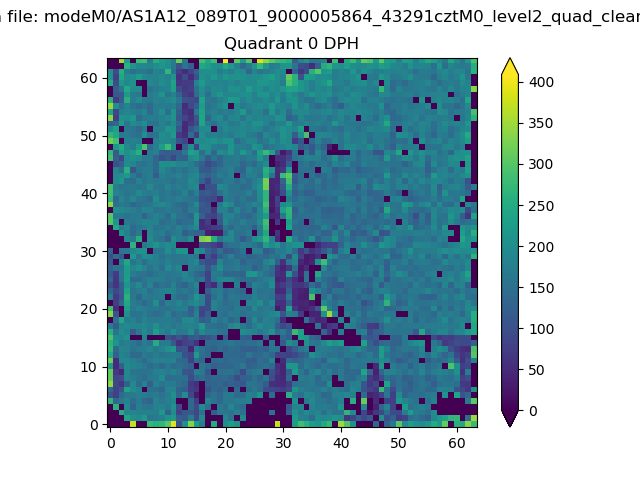 |
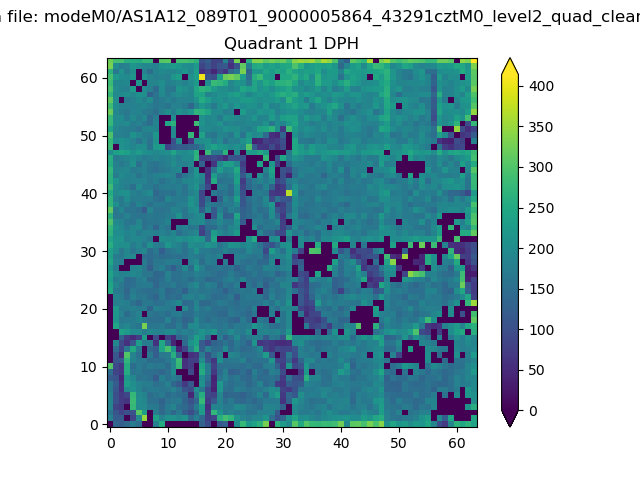 |
Quadrant B |
|---|---|---|---|
| Quadrant D | 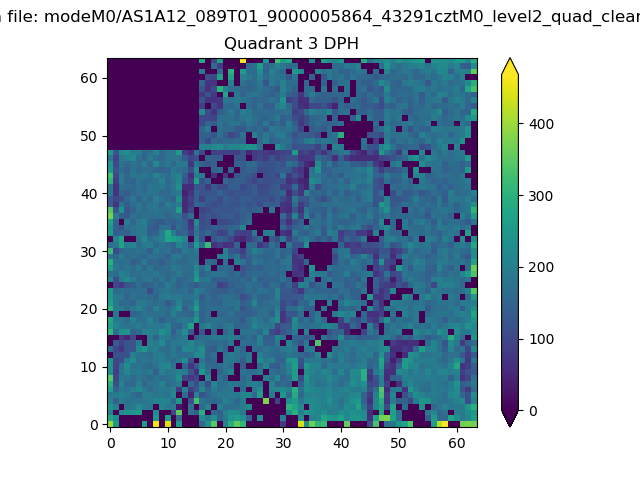 |
 |
Quadrant C |
| Plot type | Count rate plots | Images |
|---|---|---|
| Comparison with Poisson distribution Blue bars denote a histogram of data divided into 1 sec bins. Red curve is a Poisson curve with rate = median count rate of data. |
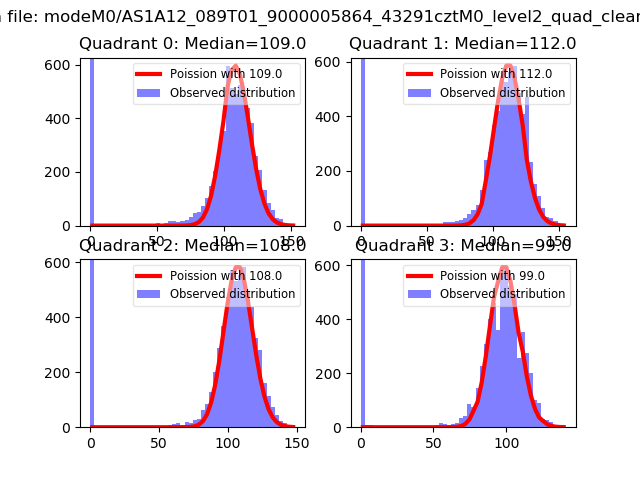 |
 |
| Quadrant-wise count rates Data is divided into 100 sec bins |
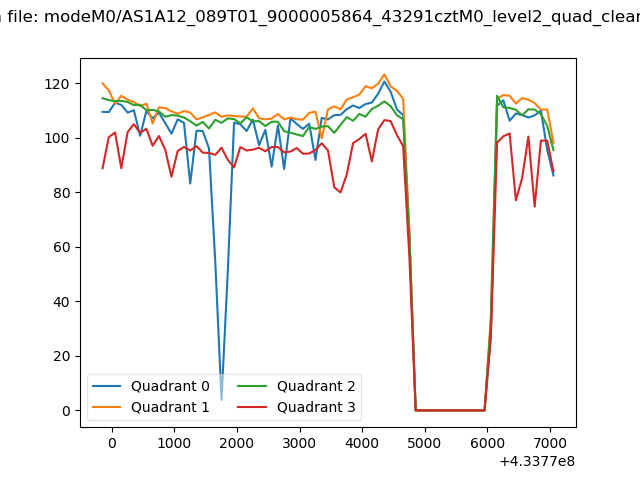 |
|
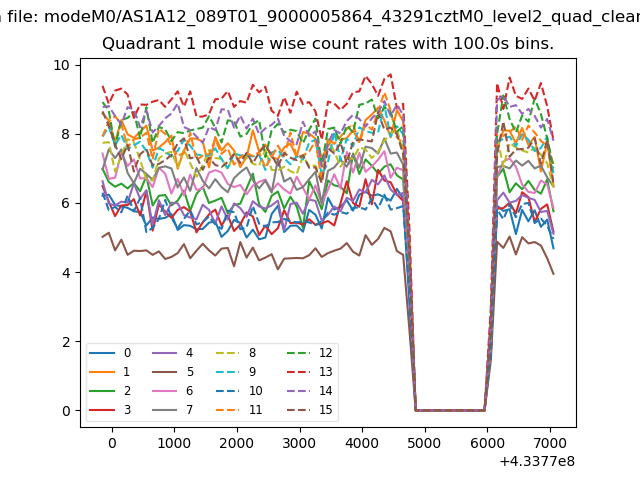
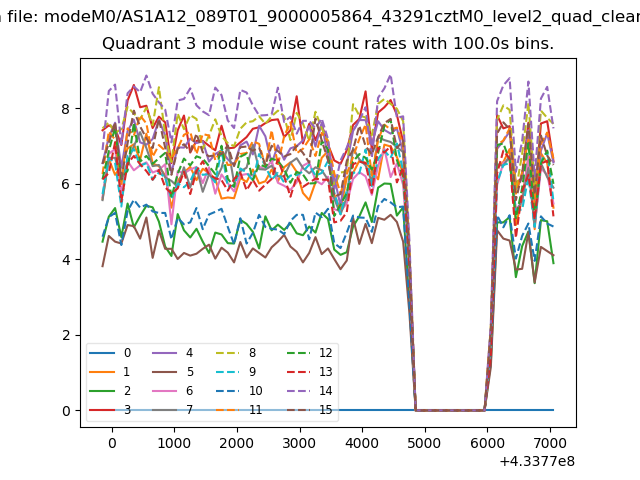
| Module-wise count rates for Quadrant A Data is divided into 100 sec bins |
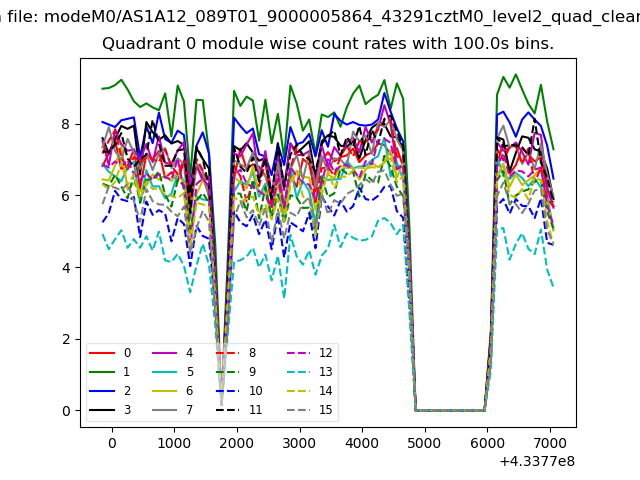 |
 |
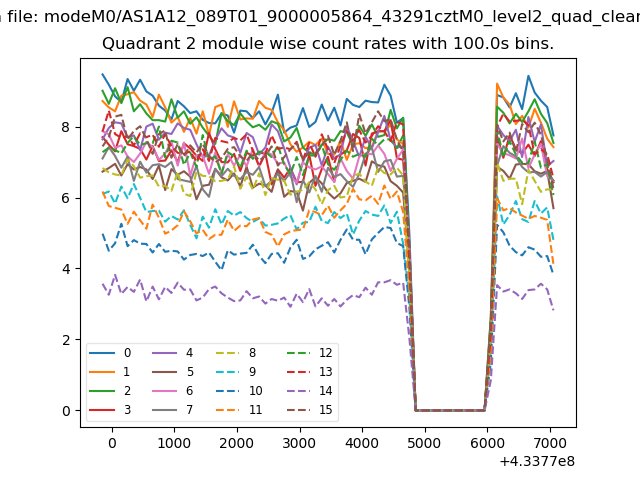
| Module-wise count rates for Quadrant B Data is divided into 100 sec bins |
 |
 |
| Module-wise count rates for Quadrant C Data is divided into 100 sec bins |
 |
 |
| Module-wise count rates for Quadrant D Data is divided into 100 sec bins |
 |
 |
| Parameter | Plot |
|---|---|
| CZT HV Monitor | 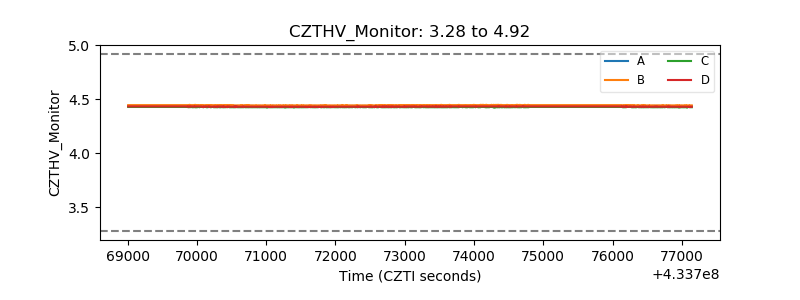 |
| D_VDD | 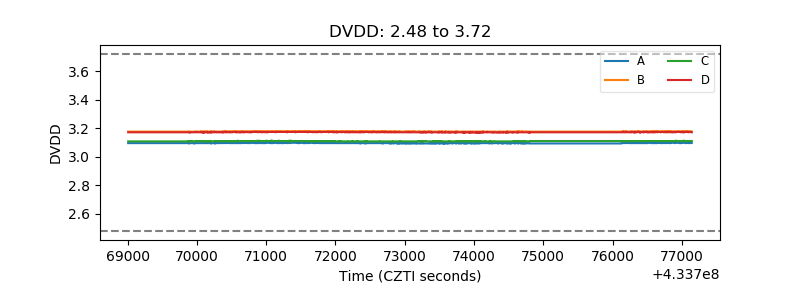 |
| Temperature 1 | 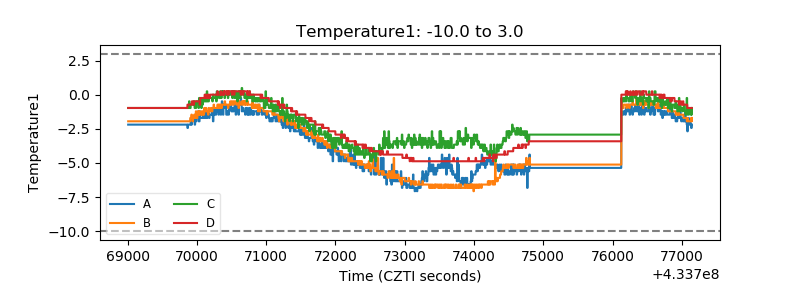 |
| Veto HV Monitor | 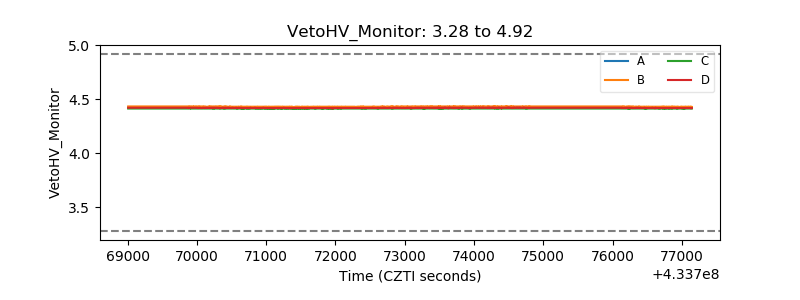 |
| Veto LLD | 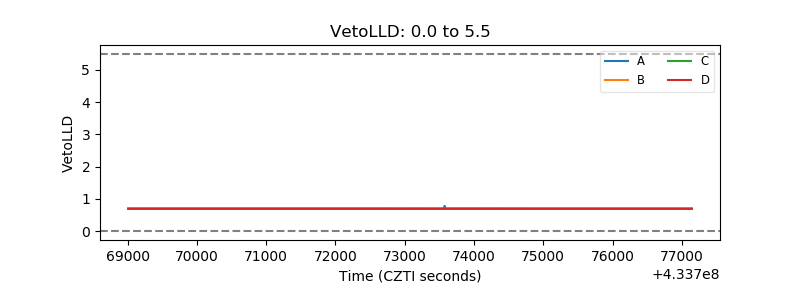 |
| Alpha Counter | 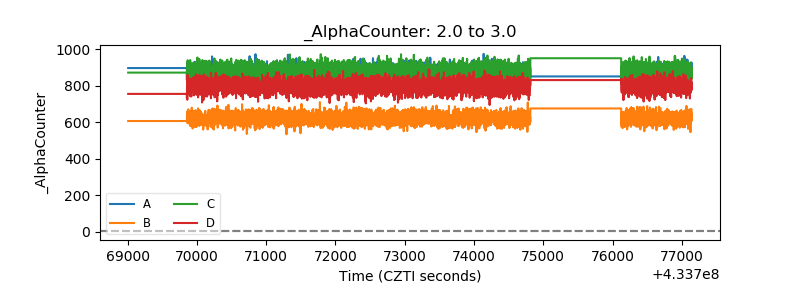 |
| _CPM_Rate | 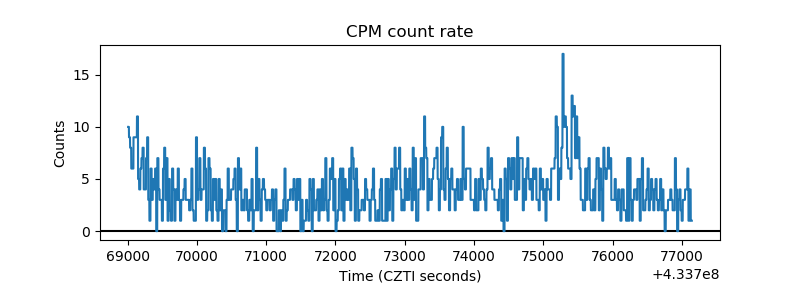 |
| CZT Counter | 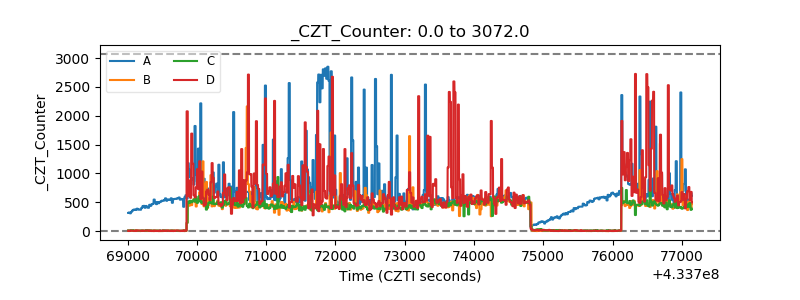 |
| +2.5 Volts monitor | 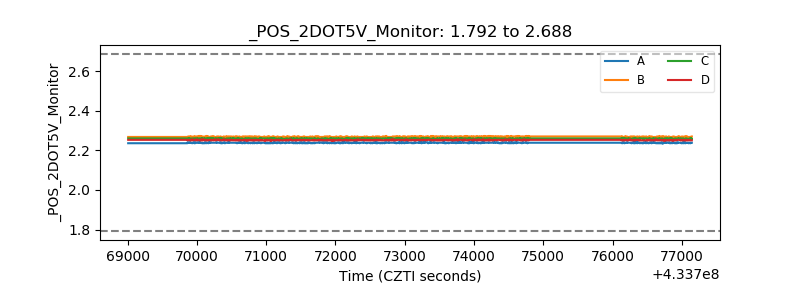 |
| +5 Volts monitor | 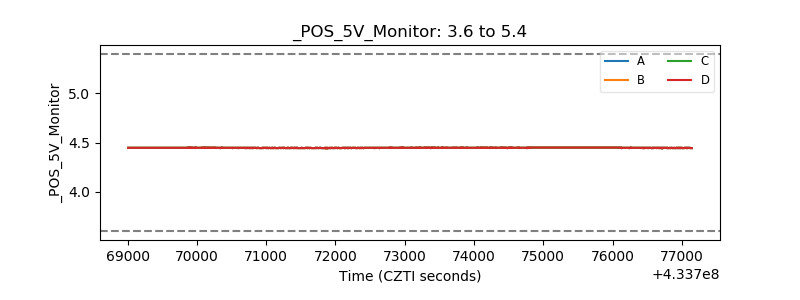 |
| _ROLL_ROT | 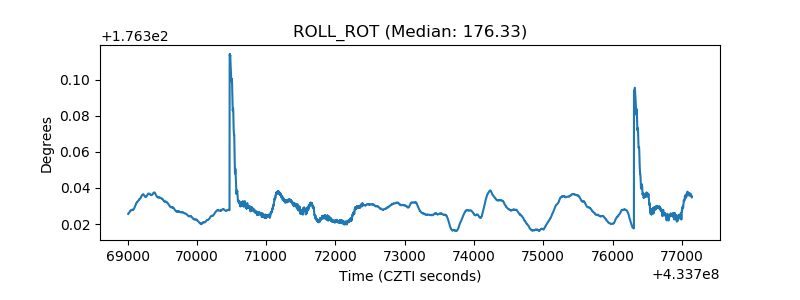 |
| _Roll_DEC | 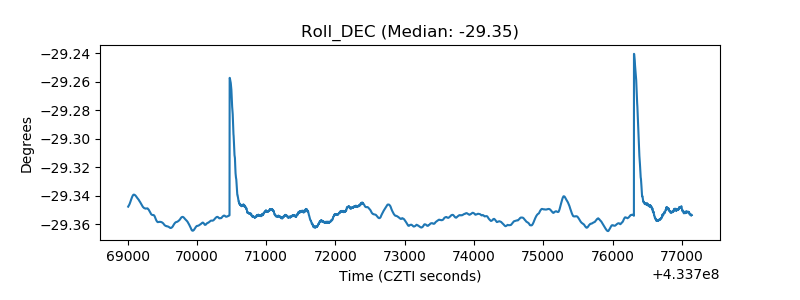 |
| _Roll_RA | 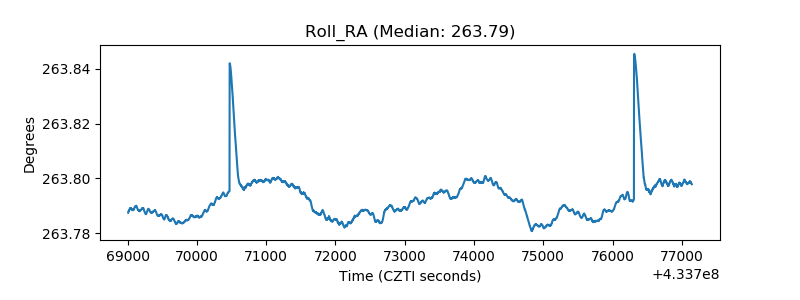 |
| Veto Counter | 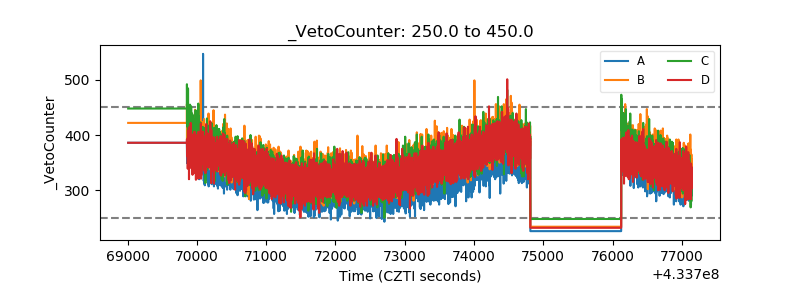 |