| Param | Original file | Final file |
|---|---|---|
| Filename | modeM0/AS1A12_089T01_9000005864_43294cztM0_level2.fits | modeM0/AS1A12_089T01_9000005864_43294cztM0_level2_quad_clean.evt |
| Size (bytes) | 961,107,840 | 249,543,360 |
| Size | 916.6 MB | 238.0 MB |
| Events in quadrant A | 9,673,677 | 1,648,306 |
| Events in quadrant B | 8,135,949 | 1,692,256 |
| Events in quadrant C | 7,325,402 | 1,648,357 |
| Events in quadrant D | 9,234,157 | 1,490,193 |
| Mode M9 | |||
|---|---|---|---|
| Quadrant | BADHDUFLAG | Total packets | Discarded packets |
| A | 0 | 48 | 0 |
| B | 0 | 49 | 0 |
| C | 0 | 49 | 0 |
| D | 0 | 49 | 0 |
| Mode SS | |||
|---|---|---|---|
| Quadrant | BADHDUFLAG | Total packets | Discarded packets |
| A | 0 | 318 | 0 |
| B | 0 | 318 | 0 |
| C | 0 | 318 | 0 |
| D | 0 | 318 | 0 |
| Mode M0 | |||
|---|---|---|---|
| Quadrant | BADHDUFLAG | Total packets | Discarded packets |
| A | 0 | 38429 | 4 |
| B | 0 | 34712 | 5 |
| C | 0 | 31806 | 4 |
| D | 0 | 38328 | 4 |
| Quadrant | Total seconds | Saturated seconds | Saturation percentage |
|---|---|---|---|
| A | 15596 | 301 | 1.929982% |
| B | 15595 | 285 | 1.827509% |
| C | 15595 | 16 | 0.102597% |
| D | 15595 | 361 | 2.314845% |
Noise dominated data is calculated using 1-second bins in cleaned event files. If a bin has >2000 counts, and if more than 50% of those come from <1% of pixels, then it is considered to be noise-dominated and hence unusable.
| Quadrant | # 1 sec bins | Bins with >0 counts | Bins with >2000 counts | High rate bins dominated by noise | Noise dominated (total time) | Noise dominated (detector-on time) | Marked lightcurve |
|---|---|---|---|---|---|---|---|
| A | 19804 | 15599 | 213 | 213 | 1.08% | 1.37% | 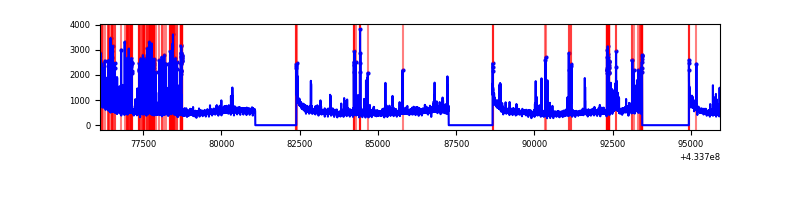 |
| B | 19803 | 15598 | 226 | 226 | 1.14% | 1.45% | 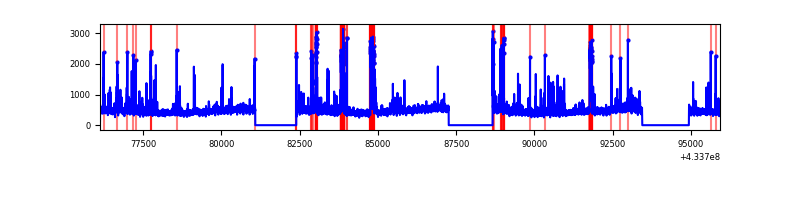 |
| C | 19803 | 15598 | 5 | 5 | 0.03% | 0.03% | 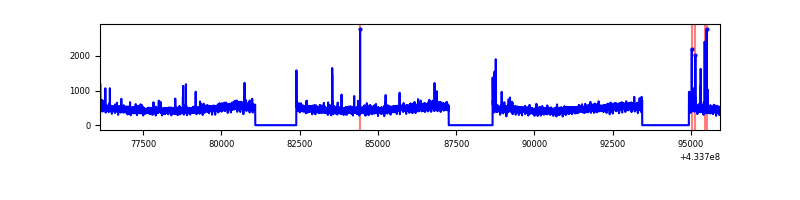 |
| D | 19803 | 15597 | 350 | 350 | 1.77% | 2.24% | 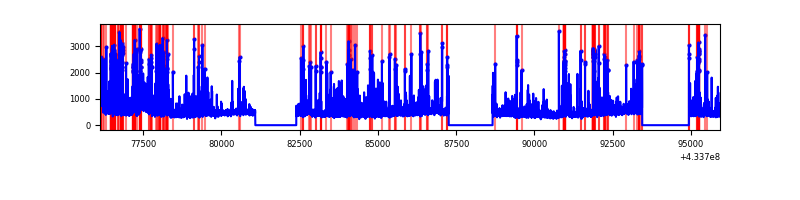 |
Top three noisy pixels from each quadrant. If the there are fewer than three noisy pixels in the level2.evt file, extra rows are filled as -1
| Pixel properties | Quadrant properties | ||||||
|---|---|---|---|---|---|---|---|
| Quadrant | DetID | PixID | Counts | Sigma | Mean | Median | Sigma |
| A | 10 | 83 | 1630946 | 4662.08 | 1698 | 1668 | 349.5 |
| A | 15 | 237 | 976001 | 2788.0 | 1698 | 1668 | 349.5 |
| A | 12 | 189 | 301356 | 857.54 | 1698 | 1668 | 349.5 |
| B | 5 | 172 | 511401 | 1558.95 | 1696 | 1648 | 327.0 |
| B | 0 | 190 | 338058 | 1028.82 | 1696 | 1648 | 327.0 |
| B | 0 | 189 | 207754 | 630.32 | 1696 | 1648 | 327.0 |
| C | 15 | 214 | 649899 | 1658.31 | 1668 | 1679 | 390.9 |
| C | 3 | 233 | 78071 | 195.43 | 1668 | 1679 | 390.9 |
| C | 15 | 159 | 28772 | 69.31 | 1668 | 1679 | 390.9 |
| D | 1 | 52 | 1361960 | 3342.77 | 1647 | 1601 | 407.0 |
| D | 13 | 249 | 301451 | 736.81 | 1647 | 1601 | 407.0 |
| D | 2 | 249 | 287614 | 702.81 | 1647 | 1601 | 407.0 |
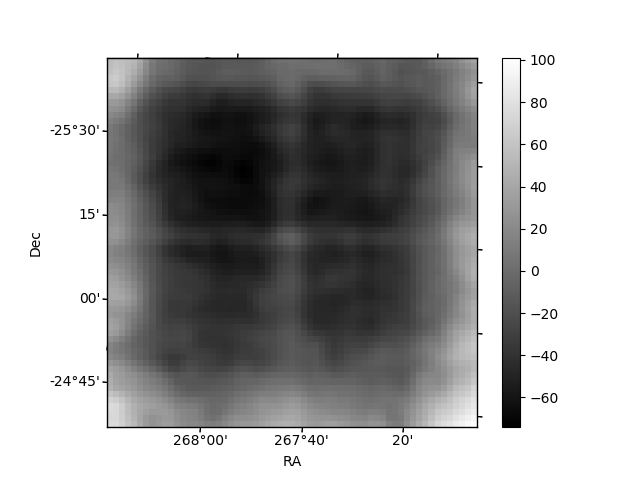
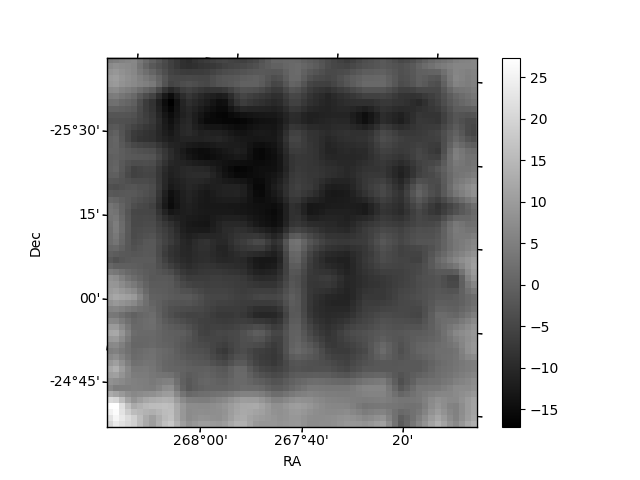
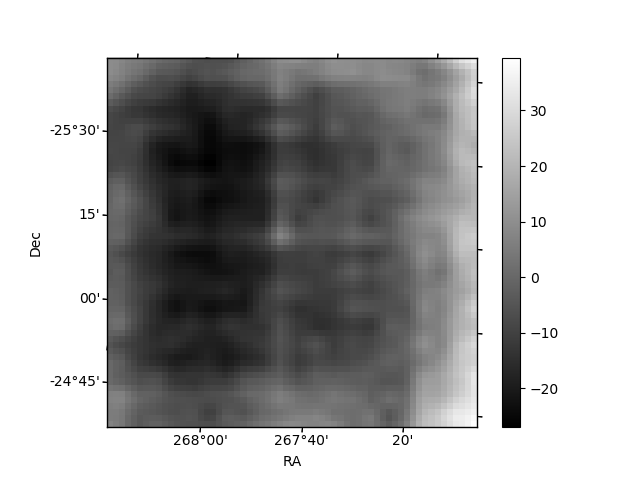
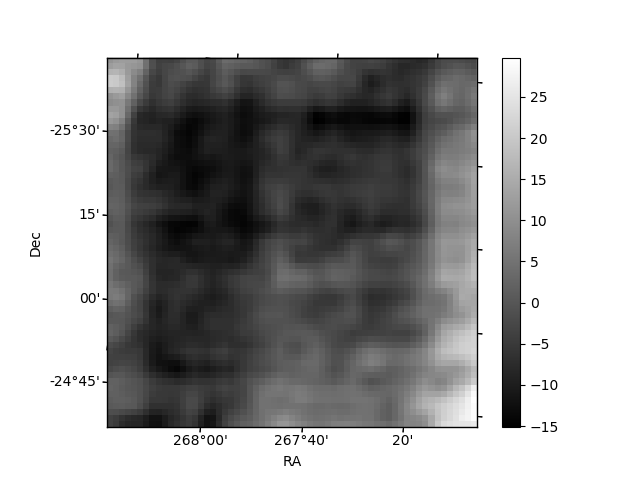
Histogram calculated using DETX and DETY for each event in the final _common_clean file
| Quadrant A | 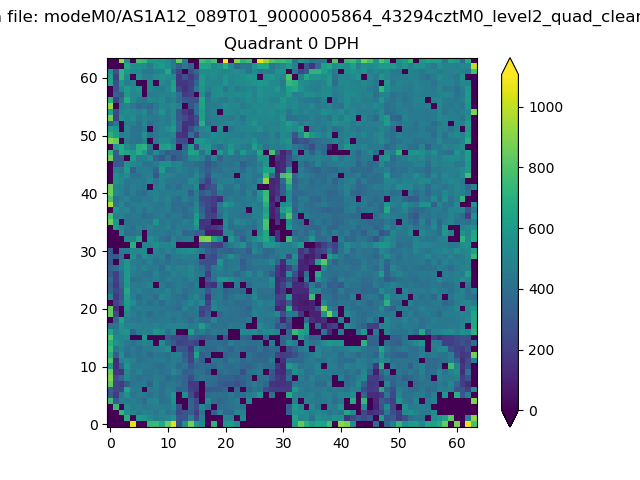 |
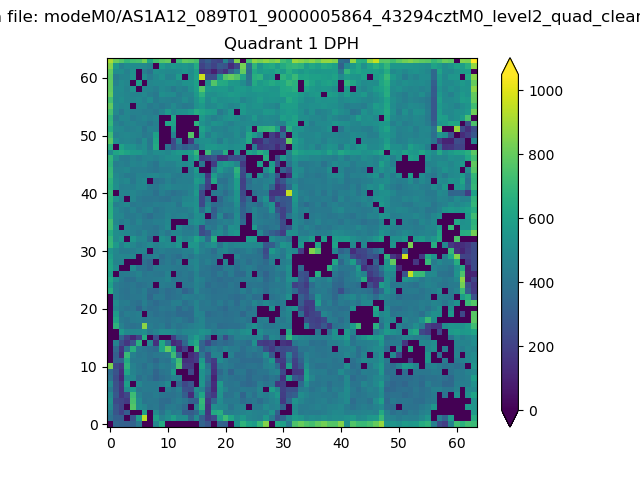 |
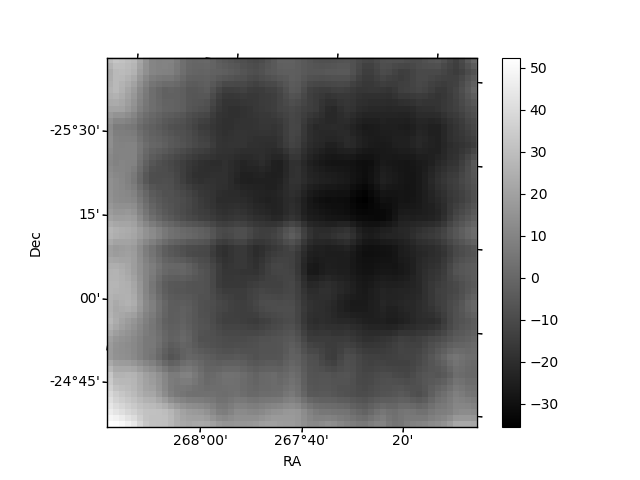
Quadrant B |
|---|---|---|---|
| Quadrant D | 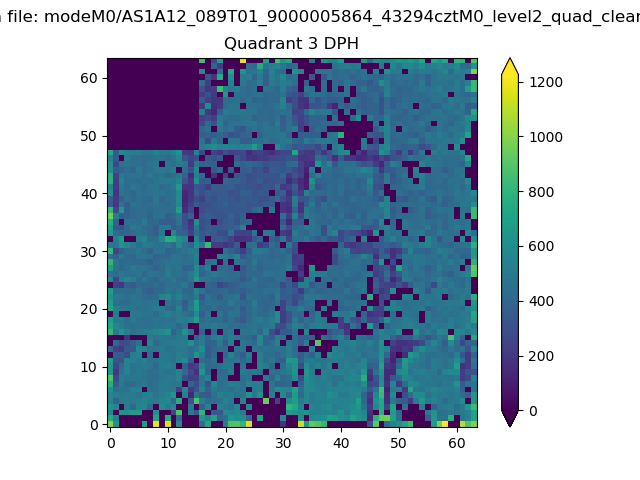 |
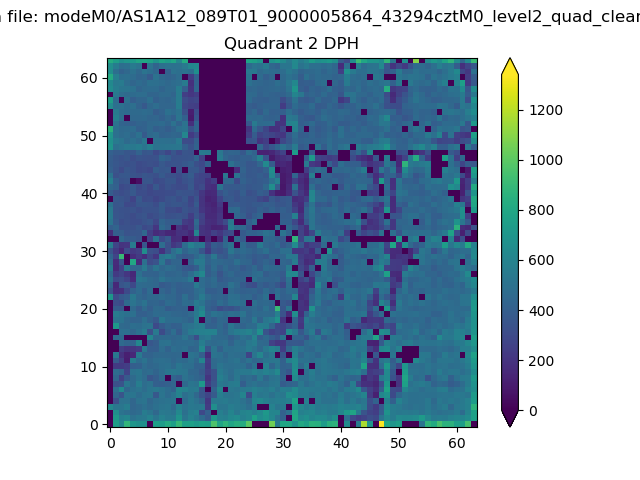 |
Quadrant C |
| Plot type | Count rate plots | Images |
|---|---|---|
| Comparison with Poisson distribution Blue bars denote a histogram of data divided into 1 sec bins. Red curve is a Poisson curve with rate = median count rate of data. |
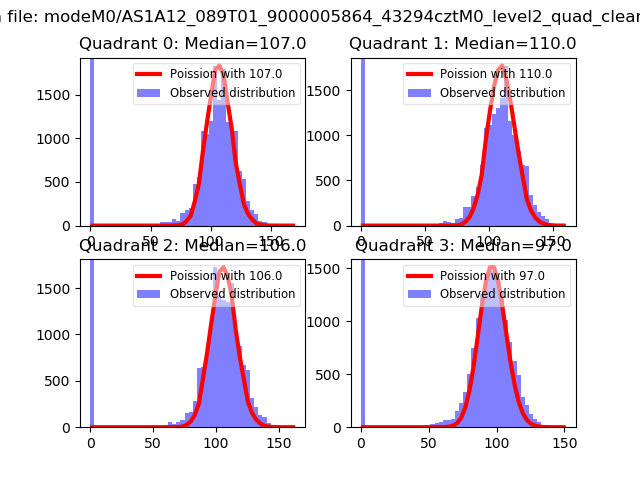 |
 |
| Quadrant-wise count rates Data is divided into 100 sec bins |
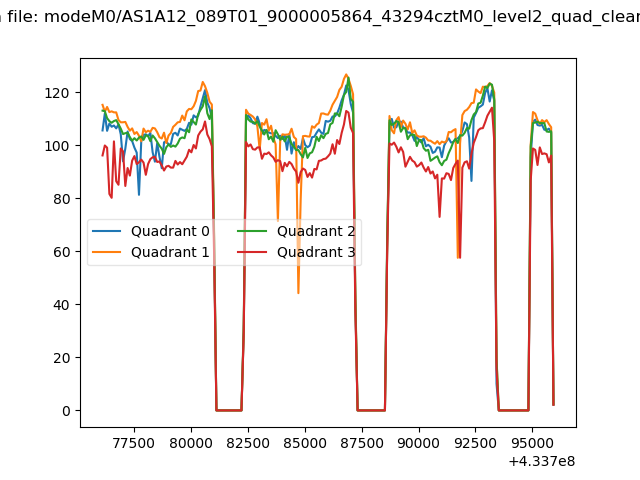 |
|
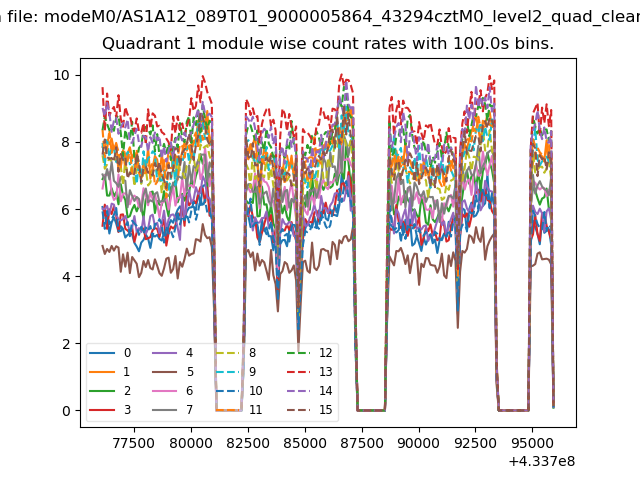
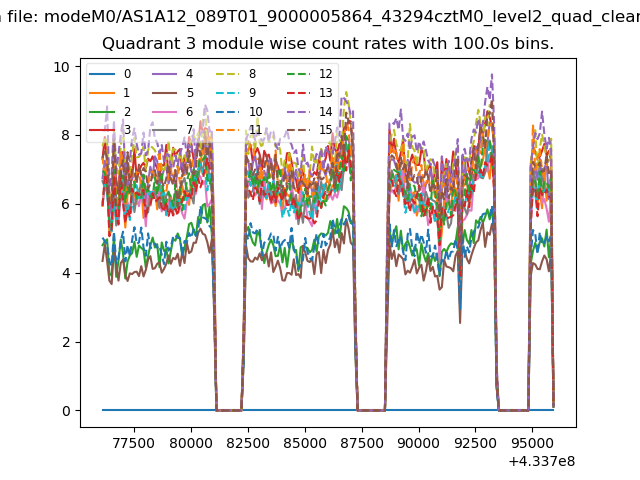
| Module-wise count rates for Quadrant A Data is divided into 100 sec bins |
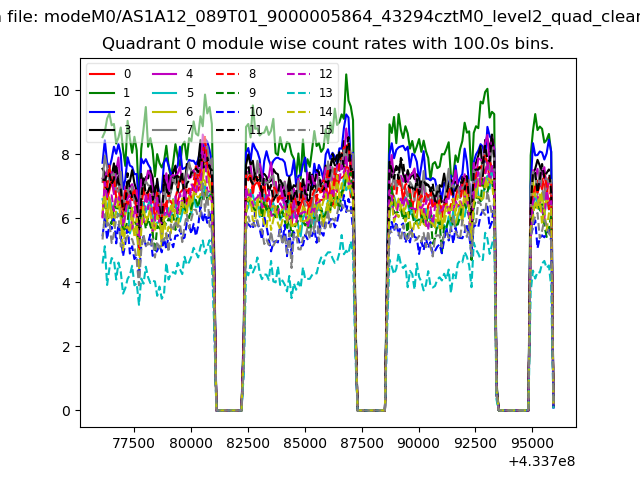 |
 |
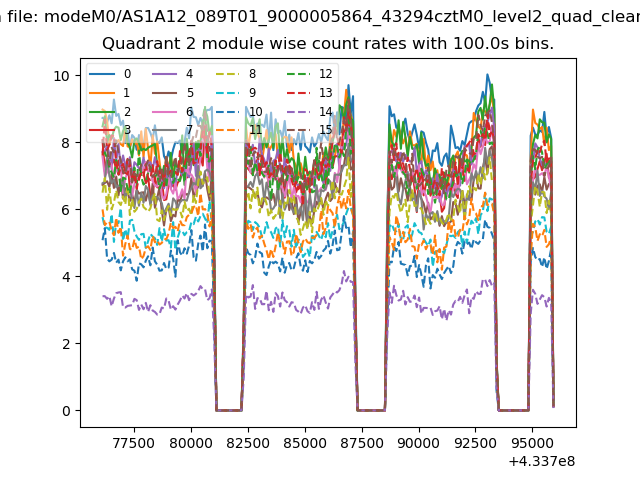
| Module-wise count rates for Quadrant B Data is divided into 100 sec bins |
 |
 |
| Module-wise count rates for Quadrant C Data is divided into 100 sec bins |
 |
 |
| Module-wise count rates for Quadrant D Data is divided into 100 sec bins |
 |
 |
| Parameter | Plot |
|---|---|
| CZT HV Monitor | 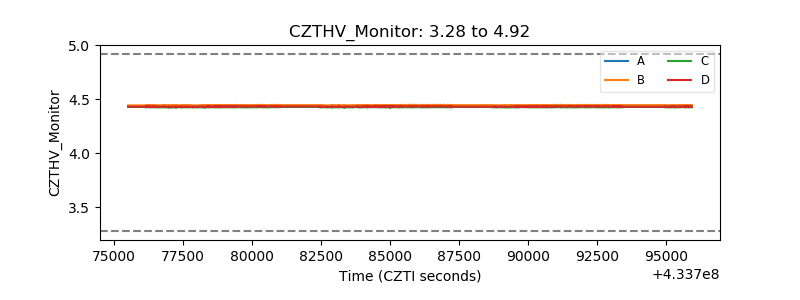 |
| D_VDD | 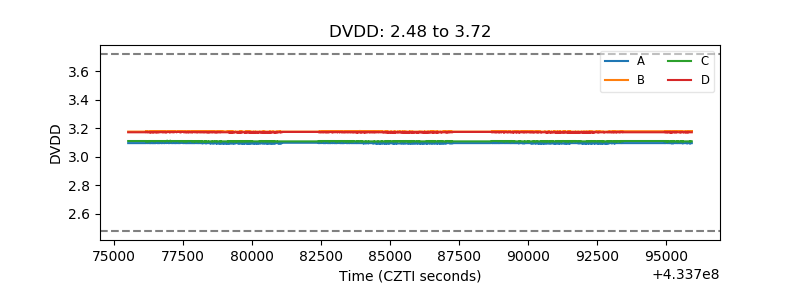 |
| Temperature 1 | 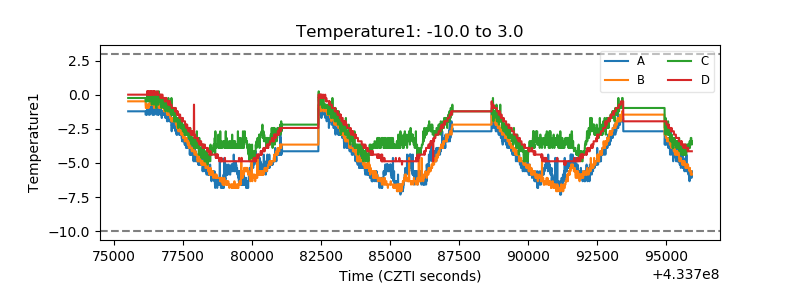 |
| Veto HV Monitor | 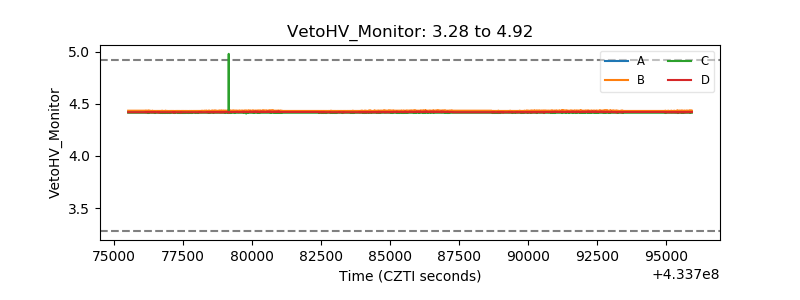 |
| Veto LLD | 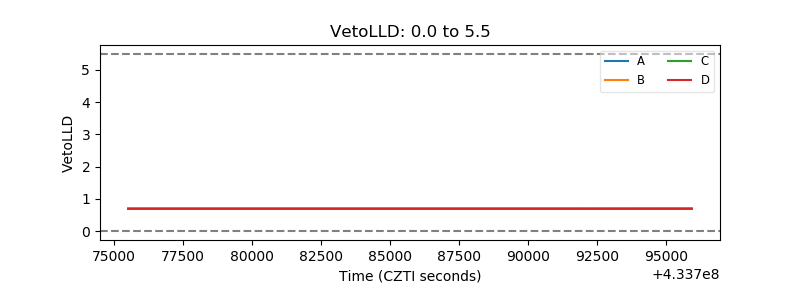 |
| Alpha Counter | 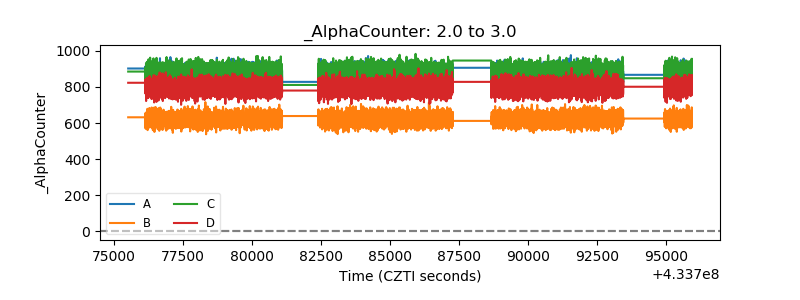 |
| _CPM_Rate | 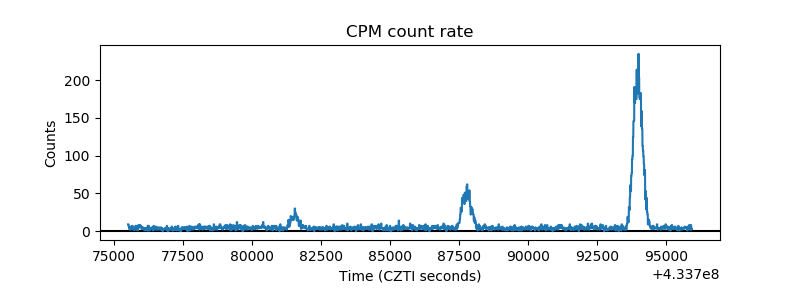 |
| CZT Counter | 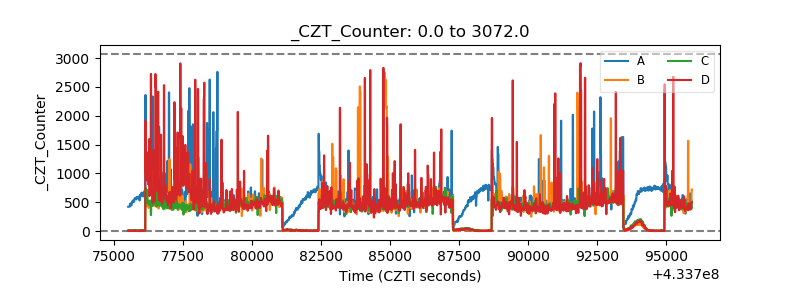 |
| +2.5 Volts monitor | 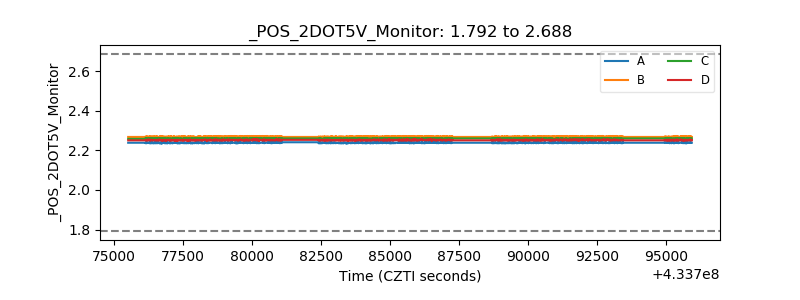 |
| +5 Volts monitor | 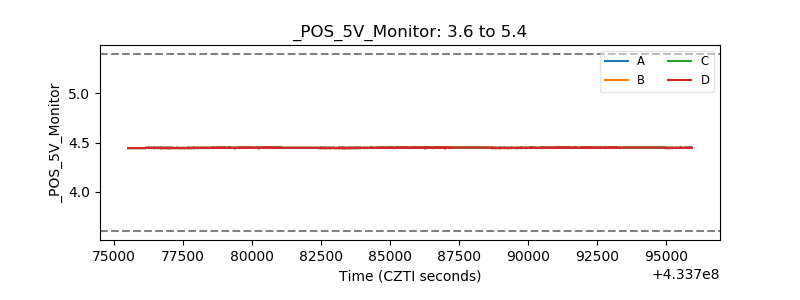 |
| _ROLL_ROT | 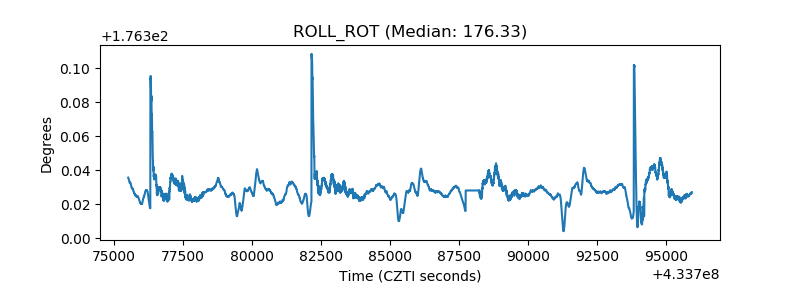 |
| _Roll_DEC | 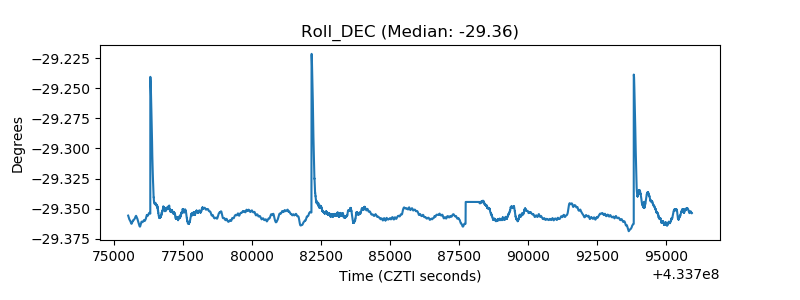 |
| _Roll_RA | 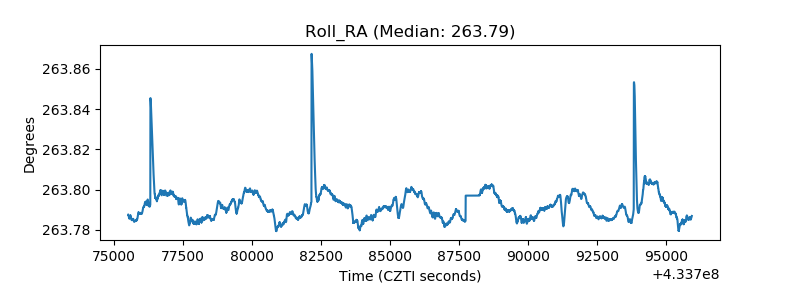 |
| Veto Counter | 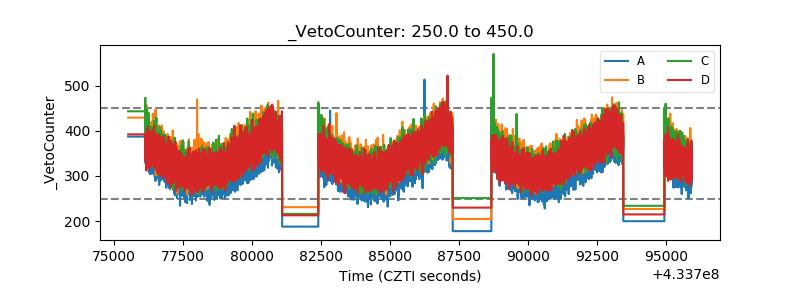 |