| Param | Original file | Final file |
|---|---|---|
| Filename | modeM0/AS1A12_089T01_9000005864_43295cztM0_level2.fits | modeM0/AS1A12_089T01_9000005864_43295cztM0_level2_quad_clean.evt |
| Size (bytes) | 351,244,800 | 89,265,600 |
| Size | 335.0 MB | 85.1 MB |
| Events in quadrant A | 3,620,953 | 585,257 |
| Events in quadrant B | 2,854,705 | 613,200 |
| Events in quadrant C | 2,895,215 | 579,577 |
| Events in quadrant D | 3,199,534 | 537,114 |
| Mode M9 | |||
|---|---|---|---|
| Quadrant | BADHDUFLAG | Total packets | Discarded packets |
| A | 0 | 28 | 0 |
| B | 0 | 29 | 0 |
| C | 0 | 29 | 0 |
| D | 0 | 29 | 0 |
| Mode SS | |||
|---|---|---|---|
| Quadrant | BADHDUFLAG | Total packets | Discarded packets |
| A | 0 | 112 | 0 |
| B | 0 | 112 | 0 |
| C | 0 | 112 | 0 |
| D | 0 | 112 | 0 |
| Mode M0 | |||
|---|---|---|---|
| Quadrant | BADHDUFLAG | Total packets | Discarded packets |
| A | 0 | 14268 | 2 |
| B | 0 | 12228 | 2 |
| C | 0 | 12116 | 2 |
| D | 0 | 13512 | 2 |
| Quadrant | Total seconds | Saturated seconds | Saturation percentage |
|---|---|---|---|
| A | 5541 | 179 | 3.230464% |
| B | 5541 | 110 | 1.985201% |
| C | 5541 | 130 | 2.346147% |
| D | 5541 | 69 | 1.245263% |
Noise dominated data is calculated using 1-second bins in cleaned event files. If a bin has >2000 counts, and if more than 50% of those come from <1% of pixels, then it is considered to be noise-dominated and hence unusable.
| Quadrant | # 1 sec bins | Bins with >0 counts | Bins with >2000 counts | High rate bins dominated by noise | Noise dominated (total time) | Noise dominated (detector-on time) | Marked lightcurve |
|---|---|---|---|---|---|---|---|
| A | 7154 | 5542 | 132 | 132 | 1.85% | 2.38% | 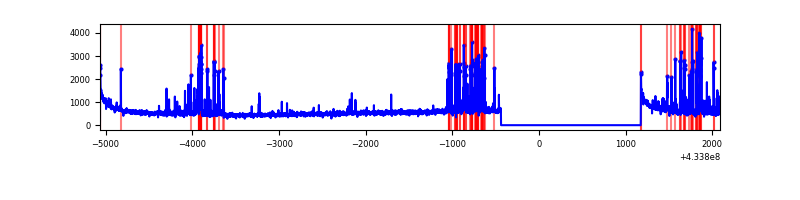 |
| B | 7154 | 5542 | 76 | 76 | 1.06% | 1.37% | 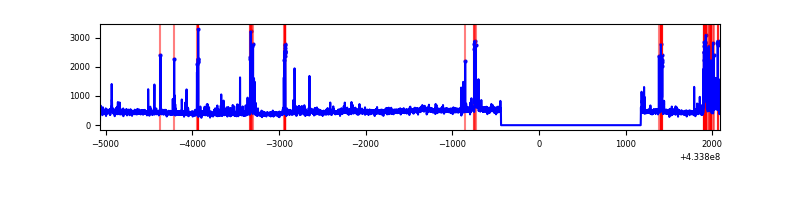 |
| C | 7154 | 5542 | 125 | 125 | 1.75% | 2.26% | 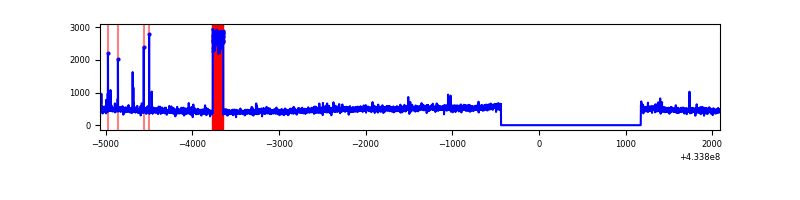 |
| D | 7154 | 5542 | 73 | 73 | 1.02% | 1.32% | 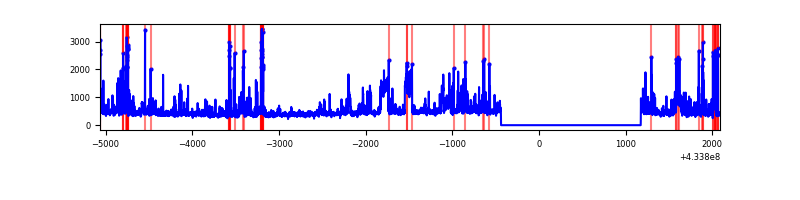 |
Top three noisy pixels from each quadrant. If the there are fewer than three noisy pixels in the level2.evt file, extra rows are filled as -1
| Pixel properties | Quadrant properties | ||||||
|---|---|---|---|---|---|---|---|
| Quadrant | DetID | PixID | Counts | Sigma | Mean | Median | Sigma |
| A | 10 | 83 | 606316 | 4896.86 | 598 | 585 | 123.7 |
| A | 15 | 237 | 550291 | 4443.94 | 598 | 585 | 123.7 |
| A | 12 | 189 | 100558 | 808.2 | 598 | 585 | 123.7 |
| B | 5 | 172 | 239512 | 2009.87 | 603 | 586 | 118.9 |
| B | 0 | 190 | 69858 | 582.72 | 603 | 586 | 118.9 |
| B | 5 | 255 | 61950 | 516.2 | 603 | 586 | 118.9 |
| C | 2 | 16 | 331687 | 2414.17 | 585 | 589 | 137.1 |
| C | 15 | 214 | 228562 | 1662.24 | 585 | 589 | 137.1 |
| C | 3 | 233 | 24508 | 174.4 | 585 | 589 | 137.1 |
| D | 1 | 52 | 328526 | 2248.17 | 588 | 573 | 145.9 |
| D | 1 | 20 | 299578 | 2049.73 | 588 | 573 | 145.9 |
| D | 12 | 6 | 59949 | 407.03 | 588 | 573 | 145.9 |
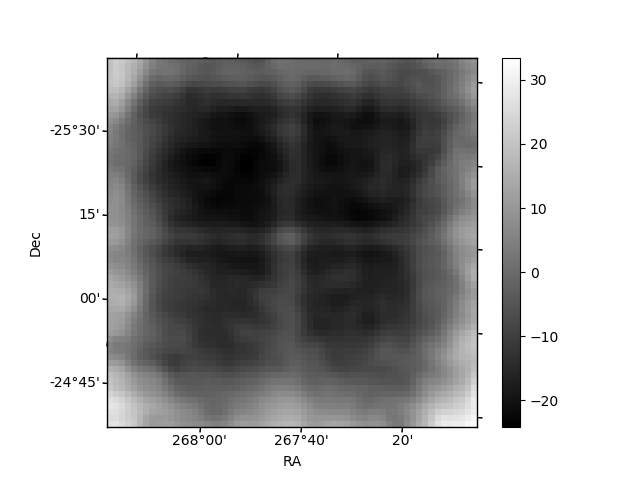
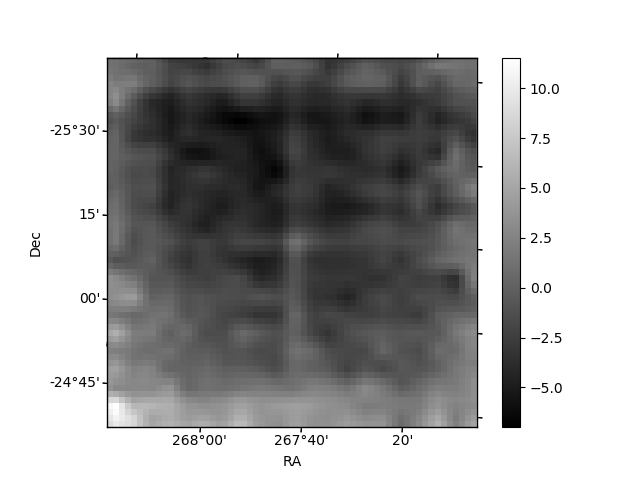
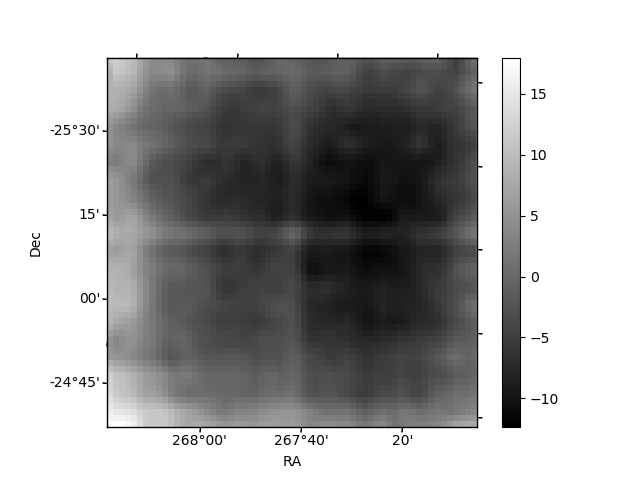
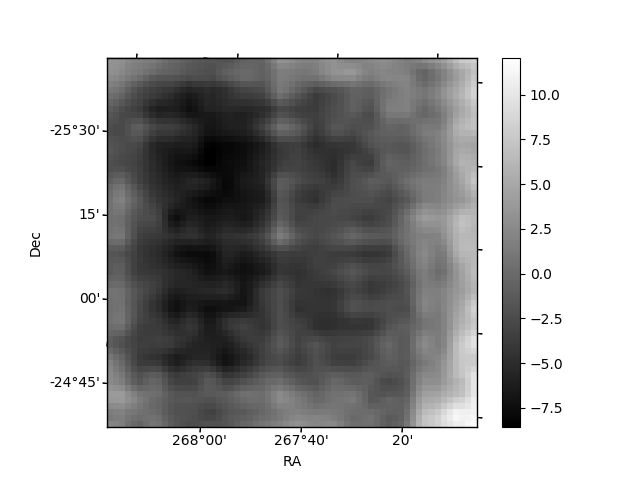
Histogram calculated using DETX and DETY for each event in the final _common_clean file
| Quadrant A | 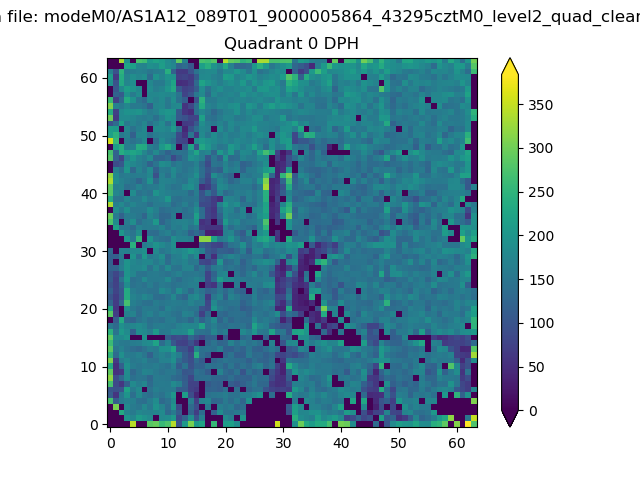 |
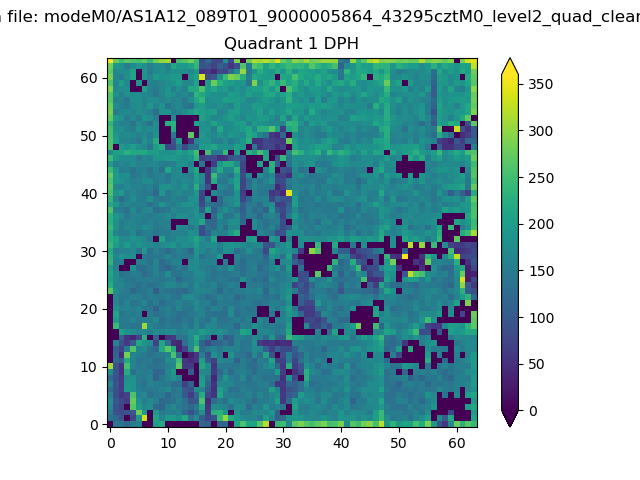 |
Quadrant B |
|---|---|---|---|
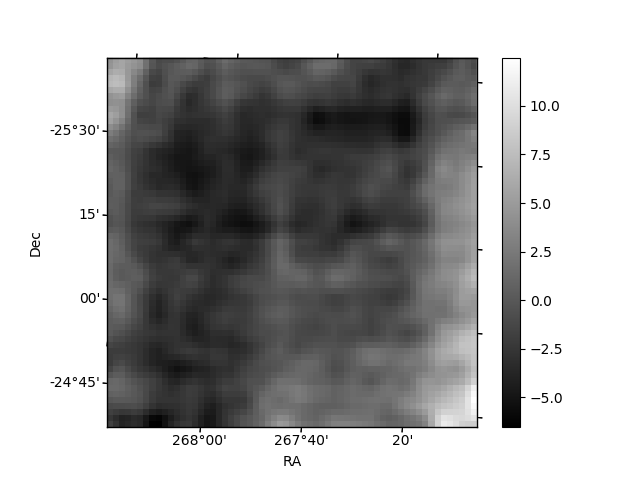
| Quadrant D | 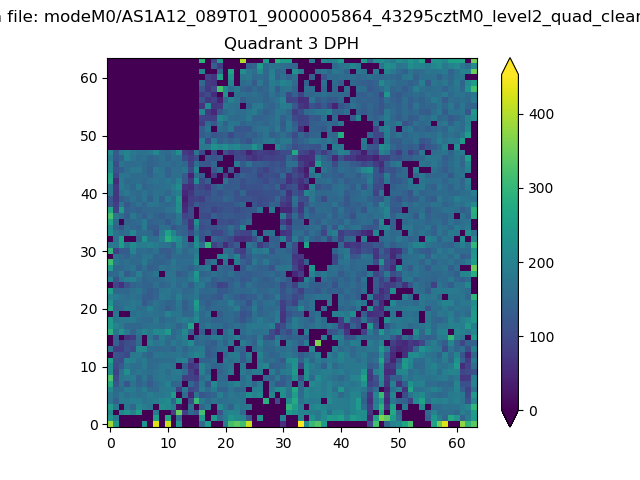 |
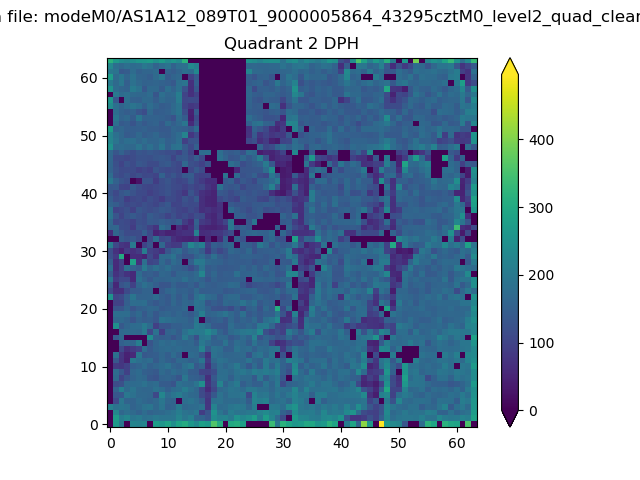 |
Quadrant C |
| Plot type | Count rate plots | Images |
|---|---|---|
| Comparison with Poisson distribution Blue bars denote a histogram of data divided into 1 sec bins. Red curve is a Poisson curve with rate = median count rate of data. |
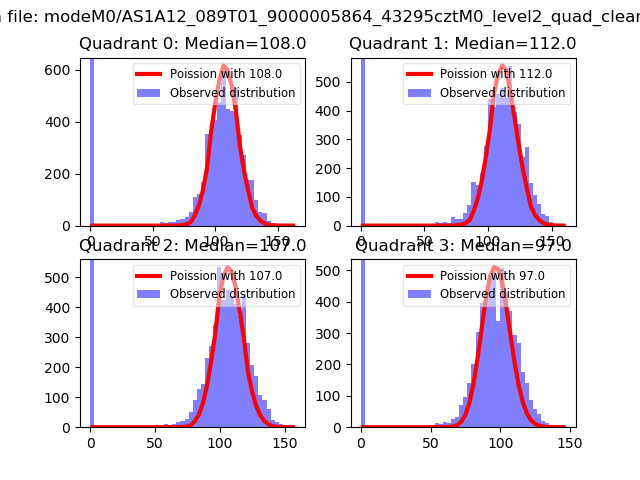 |
 |
| Quadrant-wise count rates Data is divided into 100 sec bins |
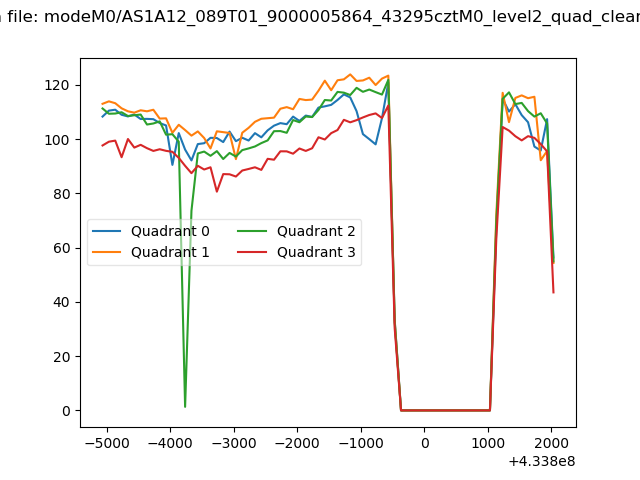 |
|
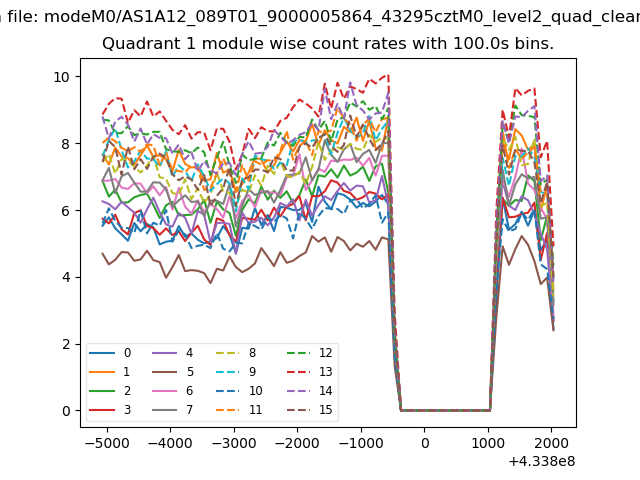
| Module-wise count rates for Quadrant A Data is divided into 100 sec bins |
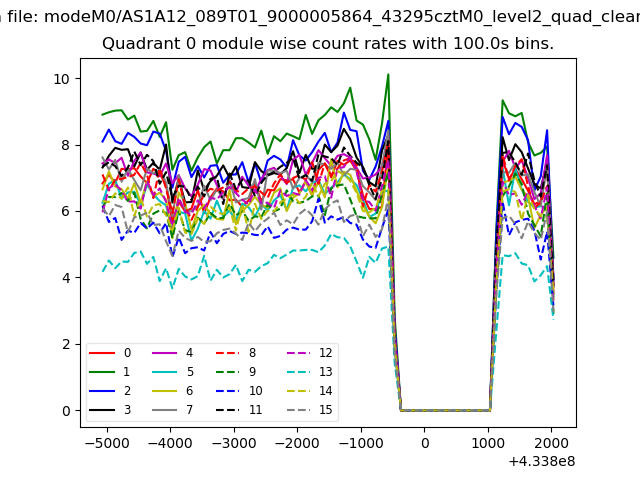 |
 |
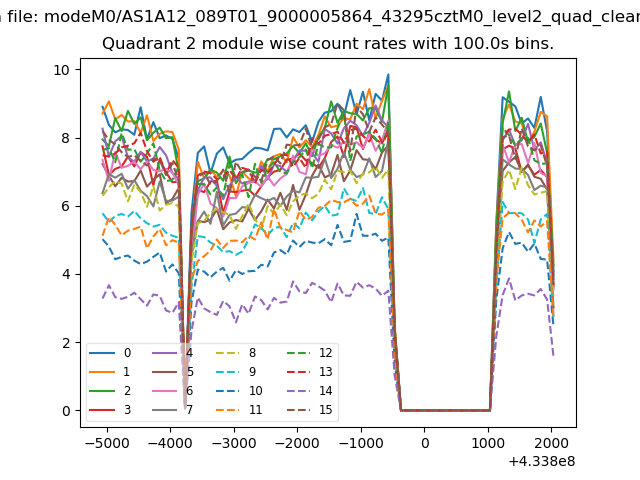
| Module-wise count rates for Quadrant B Data is divided into 100 sec bins |
 |
 |
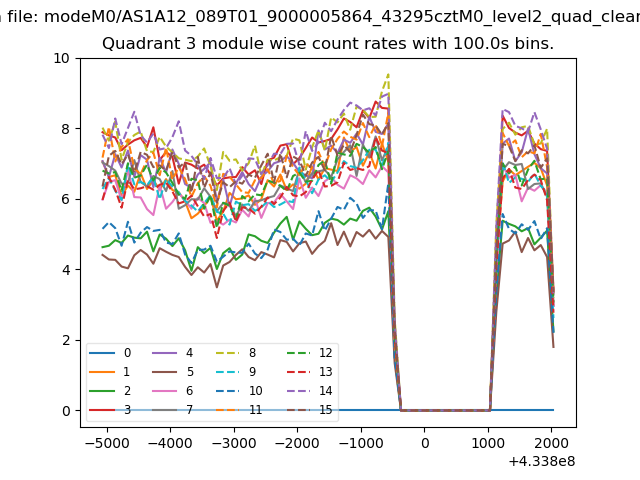
| Module-wise count rates for Quadrant C Data is divided into 100 sec bins |
 |
 |
| Module-wise count rates for Quadrant D Data is divided into 100 sec bins |
 |
 |
| Parameter | Plot |
|---|---|
| CZT HV Monitor | 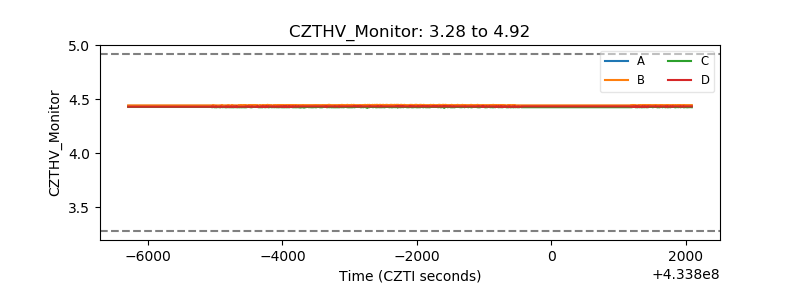 |
| D_VDD | 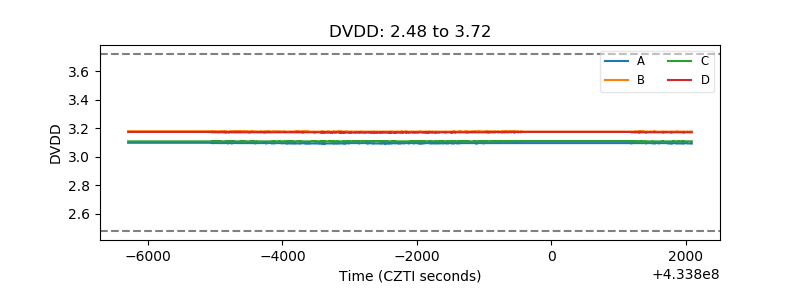 |
| Temperature 1 | 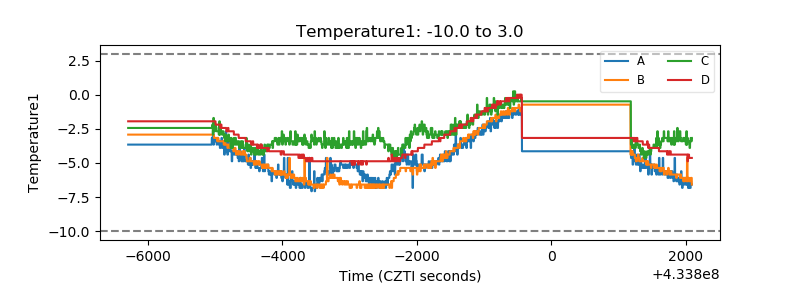 |
| Veto HV Monitor | 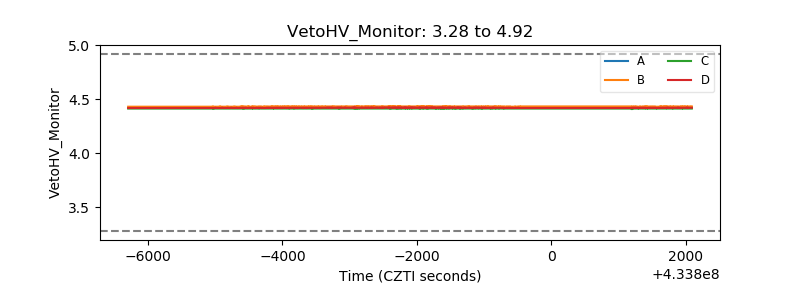 |
| Veto LLD | 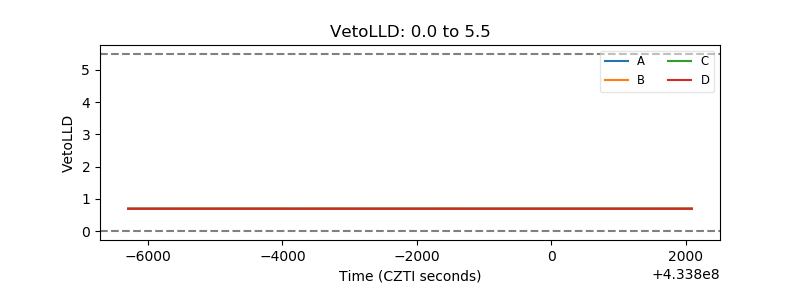 |
| Alpha Counter | 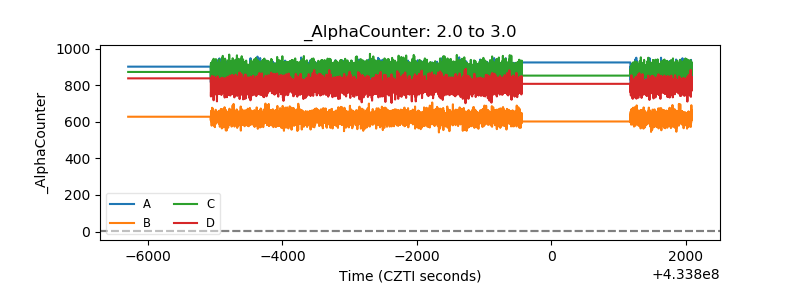 |
| _CPM_Rate | 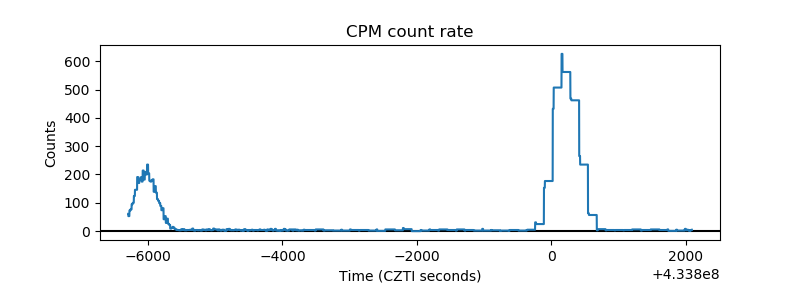 |
| CZT Counter | 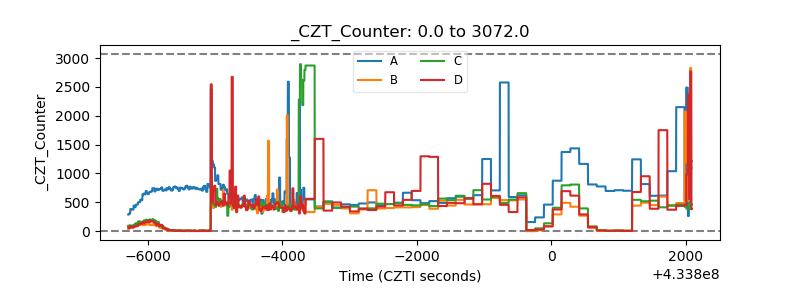 |
| +2.5 Volts monitor | 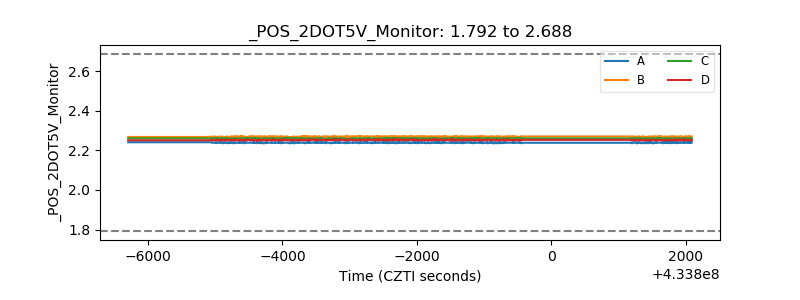 |
| +5 Volts monitor | 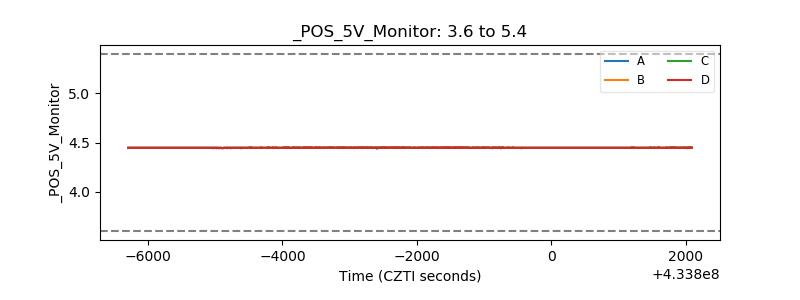 |
| _ROLL_ROT | 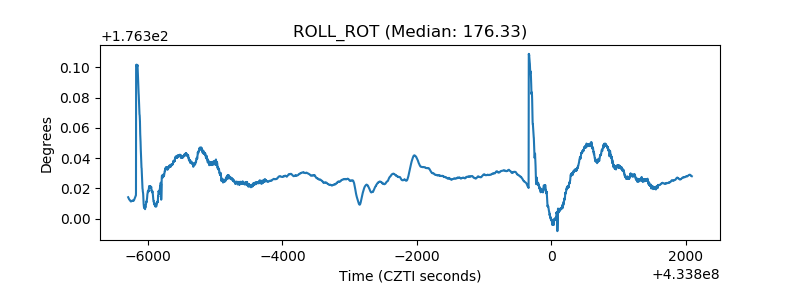 |
| _Roll_DEC | 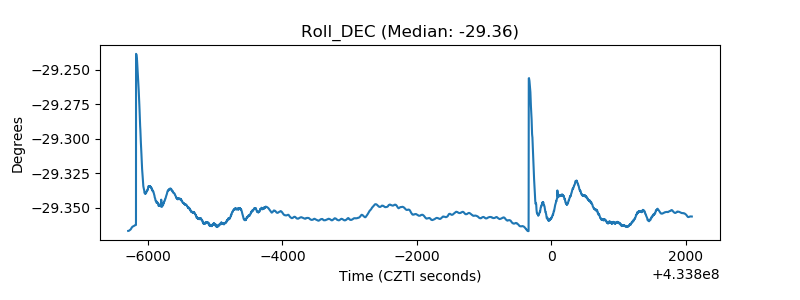 |
| _Roll_RA | 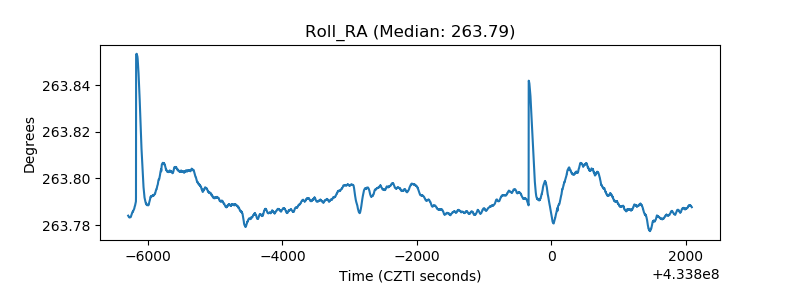 |
| Veto Counter | 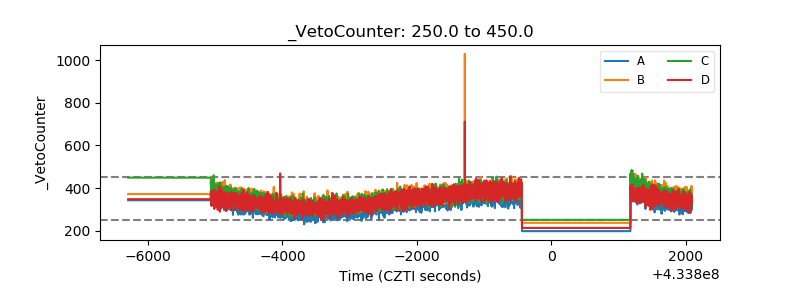 |