| Param | Original file | Final file |
|---|---|---|
| Filename | modeM0/AS1A12_089T01_9000005864_43297cztM0_level2.fits | modeM0/AS1A12_089T01_9000005864_43297cztM0_level2_quad_clean.evt |
| Size (bytes) | 341,150,400 | 87,370,560 |
| Size | 325.3 MB | 83.3 MB |
| Events in quadrant A | 3,597,712 | 577,060 |
| Events in quadrant B | 2,947,426 | 593,291 |
| Events in quadrant C | 2,543,603 | 579,759 |
| Events in quadrant D | 3,123,861 | 521,299 |
| Mode M9 | |||
|---|---|---|---|
| Quadrant | BADHDUFLAG | Total packets | Discarded packets |
| A | 0 | 27 | 0 |
| B | 0 | 28 | 0 |
| C | 0 | 28 | 0 |
| D | 0 | 28 | 0 |
| Mode SS | |||
|---|---|---|---|
| Quadrant | BADHDUFLAG | Total packets | Discarded packets |
| A | 0 | 110 | 0 |
| B | 0 | 110 | 0 |
| C | 0 | 110 | 0 |
| D | 0 | 110 | 0 |
| Mode M0 | |||
|---|---|---|---|
| Quadrant | BADHDUFLAG | Total packets | Discarded packets |
| A | 0 | 14056 | 2 |
| B | 0 | 12351 | 2 |
| C | 0 | 10866 | 2 |
| D | 0 | 13111 | 2 |
| Quadrant | Total seconds | Saturated seconds | Saturation percentage |
|---|---|---|---|
| A | 5335 | 164 | 3.074039% |
| B | 5335 | 193 | 3.617619% |
| C | 5335 | 4 | 0.074977% |
| D | 5335 | 111 | 2.080600% |
Noise dominated data is calculated using 1-second bins in cleaned event files. If a bin has >2000 counts, and if more than 50% of those come from <1% of pixels, then it is considered to be noise-dominated and hence unusable.
| Quadrant | # 1 sec bins | Bins with >0 counts | Bins with >2000 counts | High rate bins dominated by noise | Noise dominated (total time) | Noise dominated (detector-on time) | Marked lightcurve |
|---|---|---|---|---|---|---|---|
| A | 7068 | 5336 | 135 | 135 | 1.91% | 2.53% | 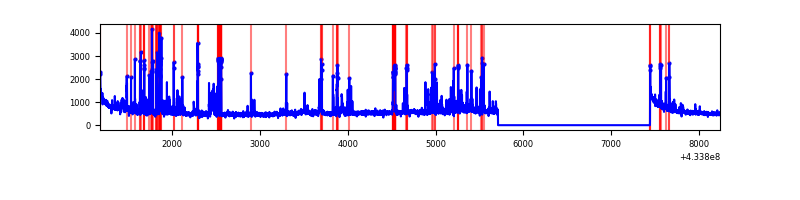 |
| B | 7068 | 5336 | 145 | 145 | 2.05% | 2.72% | 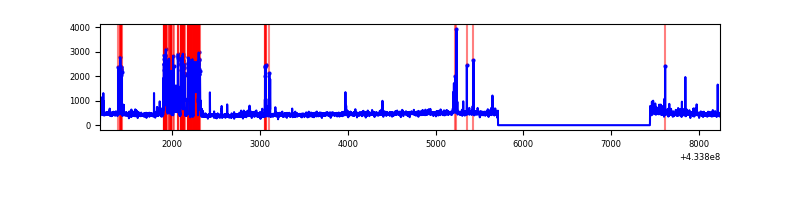 |
| C | 7068 | 5336 | 1 | 1 | 0.01% | 0.02% | 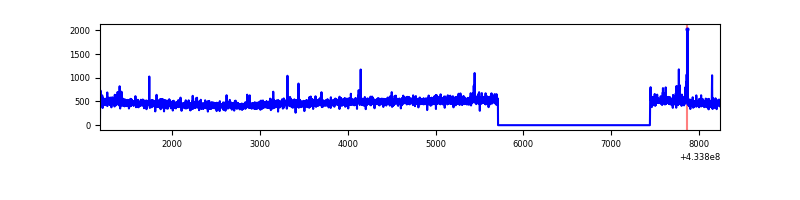 |
| D | 7068 | 5336 | 109 | 109 | 1.54% | 2.04% | 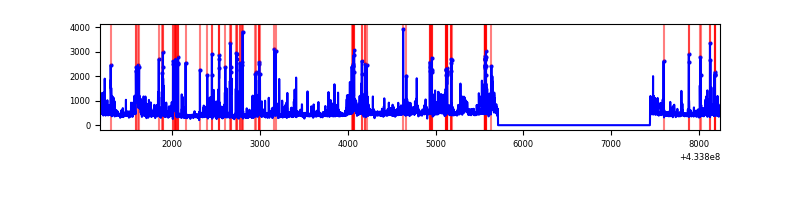 |
Top three noisy pixels from each quadrant. If the there are fewer than three noisy pixels in the level2.evt file, extra rows are filled as -1
| Pixel properties | Quadrant properties | ||||||
|---|---|---|---|---|---|---|---|
| Quadrant | DetID | PixID | Counts | Sigma | Mean | Median | Sigma |
| A | 15 | 237 | 593604 | 4918.22 | 582 | 570 | 120.6 |
| A | 10 | 83 | 574394 | 4758.9 | 582 | 570 | 120.6 |
| A | 12 | 189 | 122496 | 1011.17 | 582 | 570 | 120.6 |
| B | 5 | 172 | 498042 | 4319.57 | 582 | 568 | 115.2 |
| B | 0 | 190 | 62161 | 534.81 | 582 | 568 | 115.2 |
| B | 5 | 255 | 31794 | 271.14 | 582 | 568 | 115.2 |
| C | 15 | 214 | 224858 | 1650.86 | 579 | 581 | 135.9 |
| C | 15 | 159 | 23703 | 170.2 | 579 | 581 | 135.9 |
| C | 3 | 233 | 23274 | 167.04 | 579 | 581 | 135.9 |
| D | 1 | 52 | 285565 | 2014.54 | 569 | 552 | 141.5 |
| D | 13 | 249 | 248712 | 1754.05 | 569 | 552 | 141.5 |
| D | 12 | 218 | 188677 | 1329.71 | 569 | 552 | 141.5 |
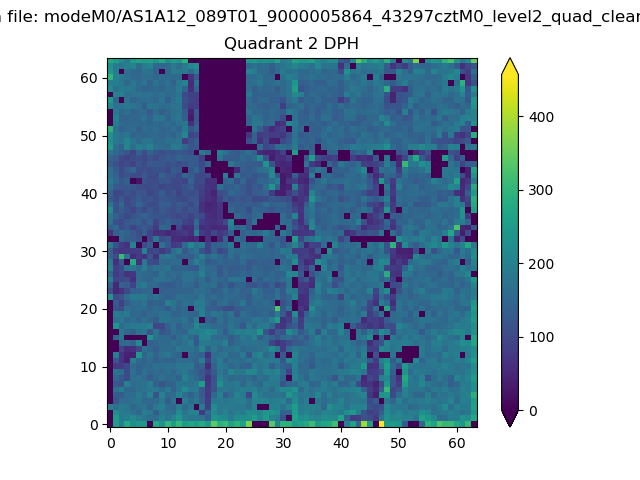
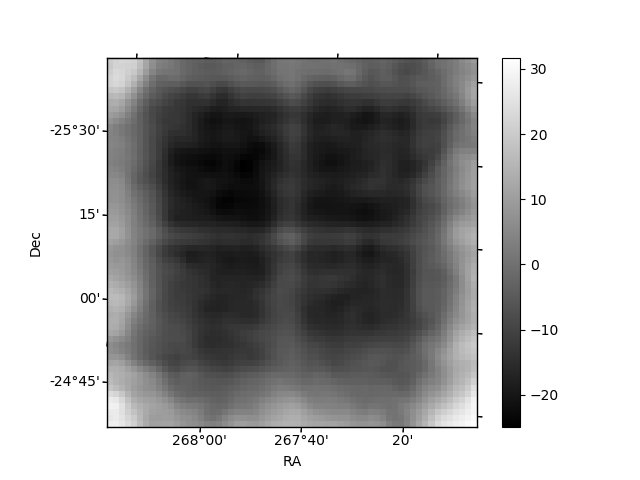
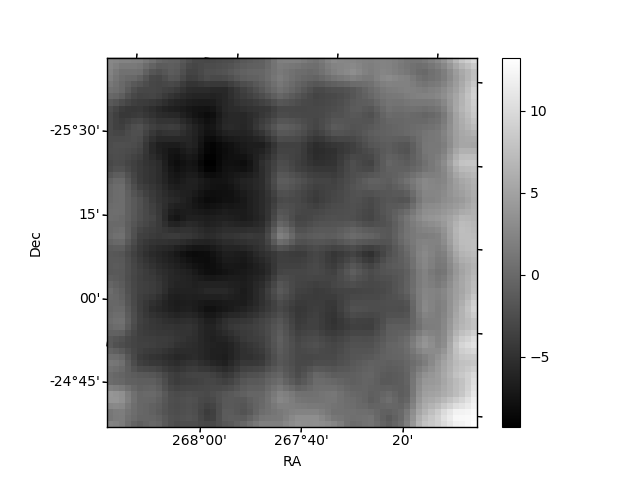
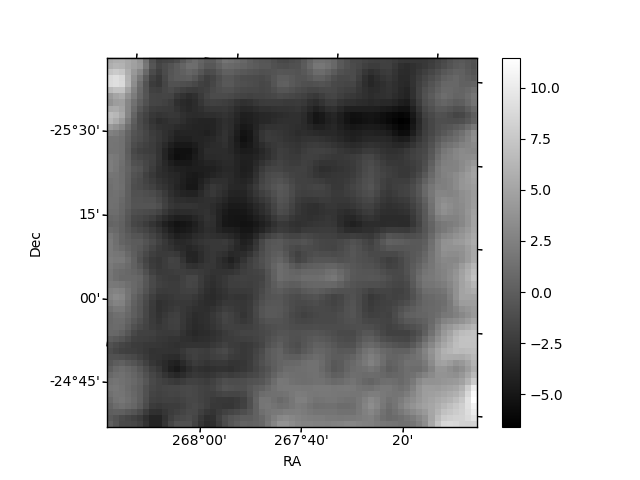
Histogram calculated using DETX and DETY for each event in the final _common_clean file
| Quadrant A | 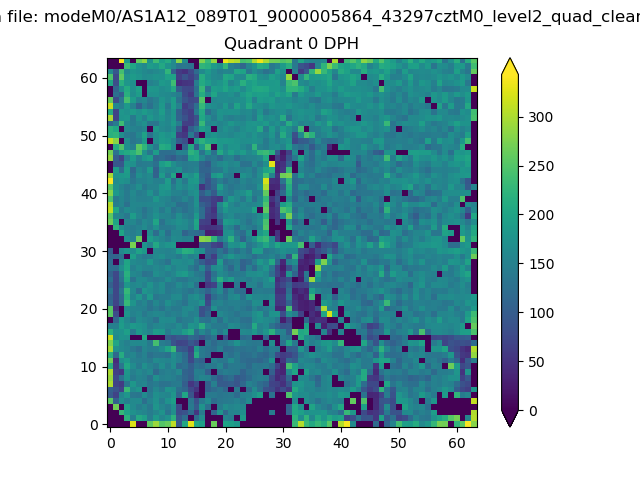 |
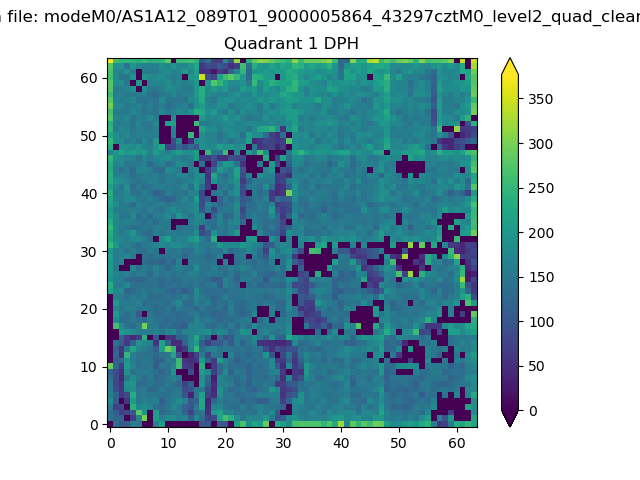 |
Quadrant B |
|---|---|---|---|
| Quadrant D | 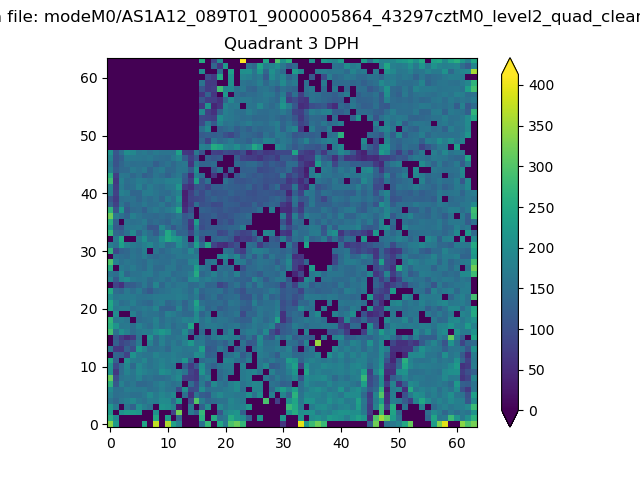 |
 |
Quadrant C |
| Plot type | Count rate plots | Images |
|---|---|---|
| Comparison with Poisson distribution Blue bars denote a histogram of data divided into 1 sec bins. Red curve is a Poisson curve with rate = median count rate of data. |
 |
 |
| Quadrant-wise count rates Data is divided into 100 sec bins |
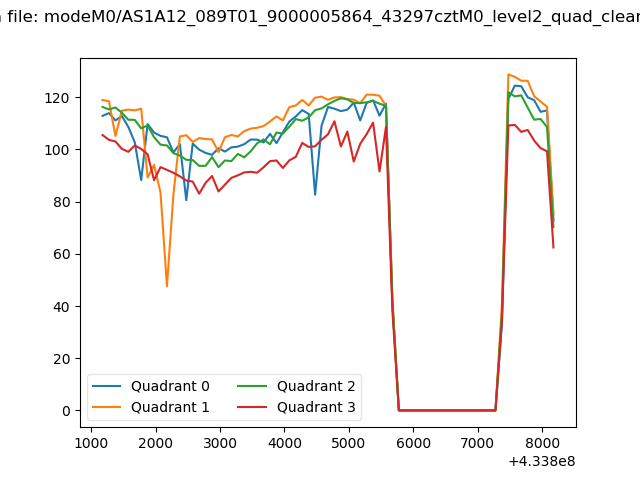 |
|
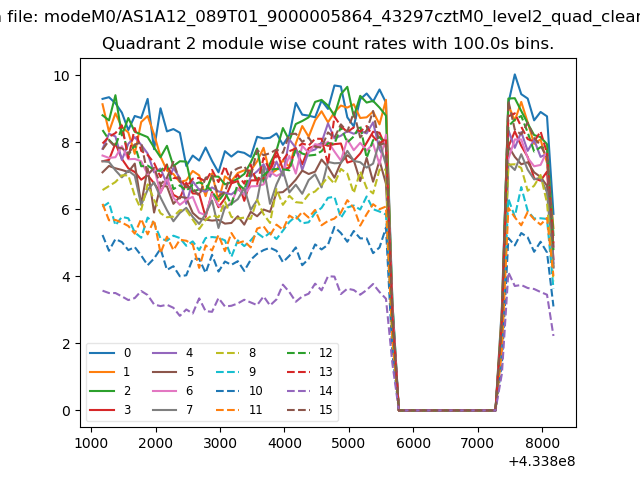
| Module-wise count rates for Quadrant A Data is divided into 100 sec bins |
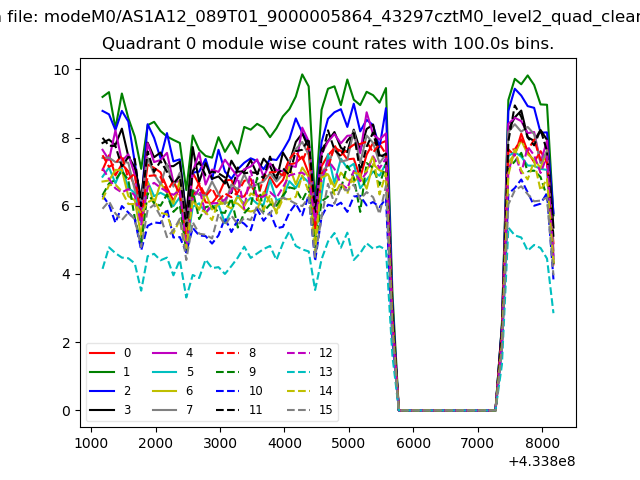 |
 |
| Module-wise count rates for Quadrant B Data is divided into 100 sec bins |
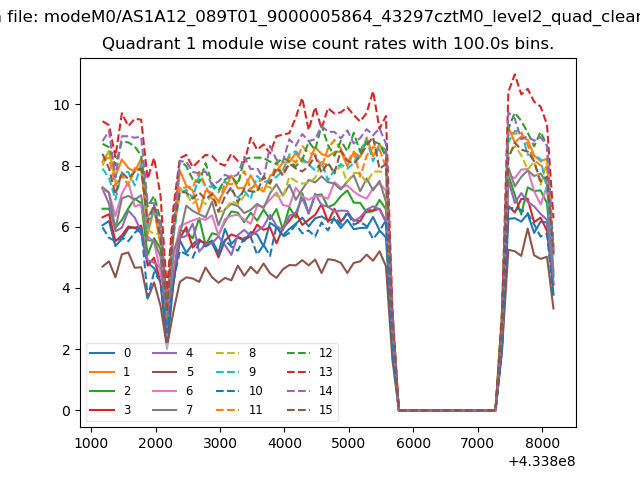 |
 |
| Module-wise count rates for Quadrant C Data is divided into 100 sec bins |
 |
 |
| Module-wise count rates for Quadrant D Data is divided into 100 sec bins |
 |
 |
| Parameter | Plot |
|---|---|
| CZT HV Monitor | 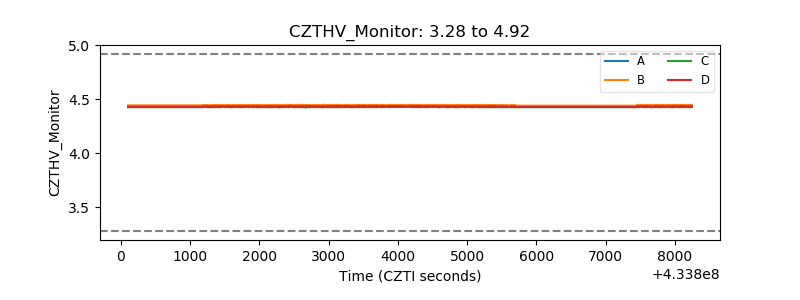 |
| D_VDD | 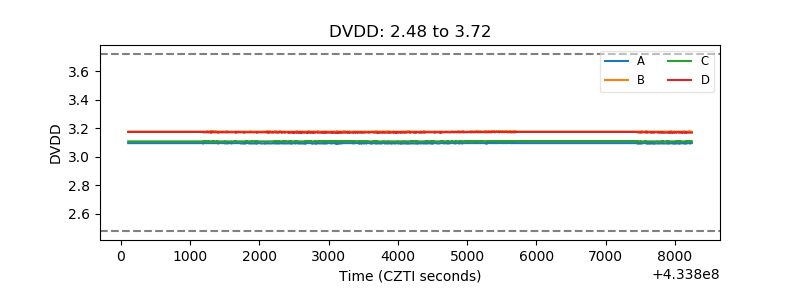 |
| Temperature 1 | 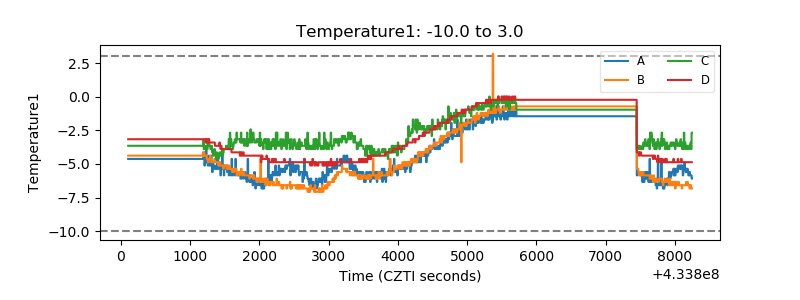 |
| Veto HV Monitor | 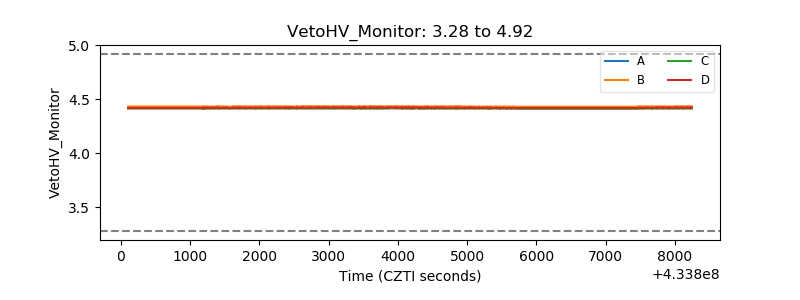 |
| Veto LLD | 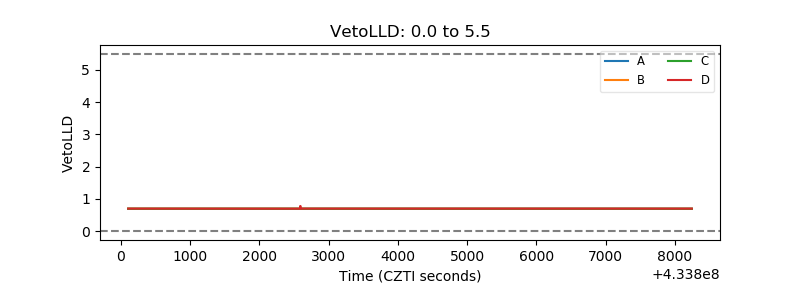 |
| Alpha Counter | 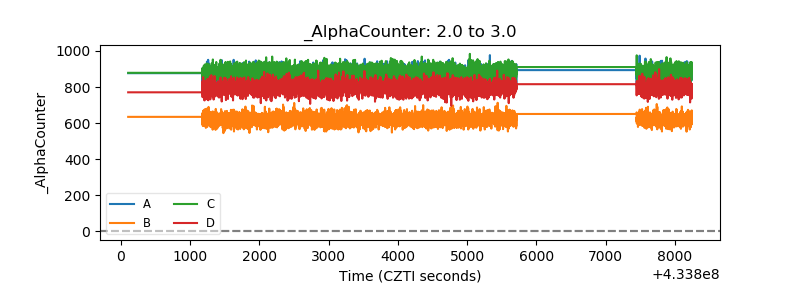 |
| _CPM_Rate | 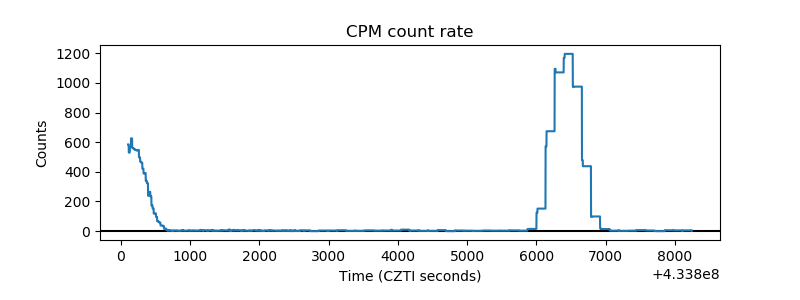 |
| CZT Counter | 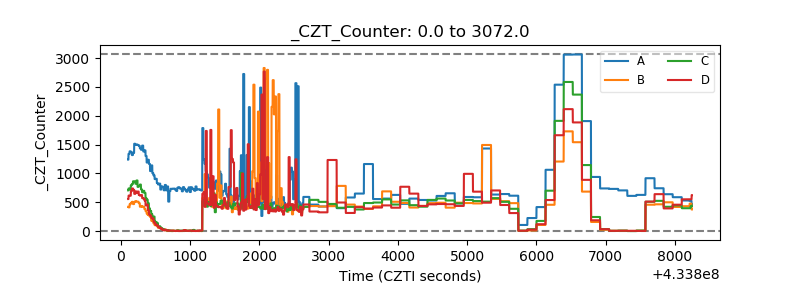 |
| +2.5 Volts monitor | 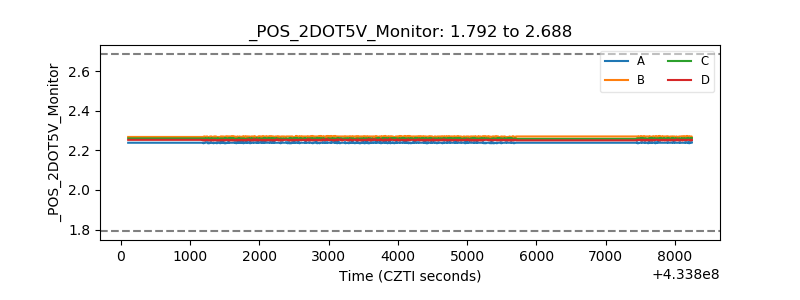 |
| +5 Volts monitor | 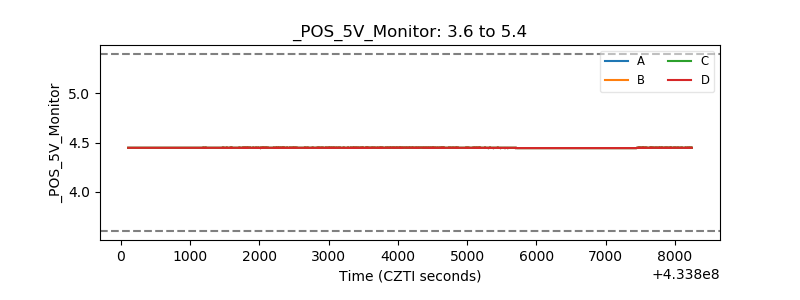 |
| _ROLL_ROT | 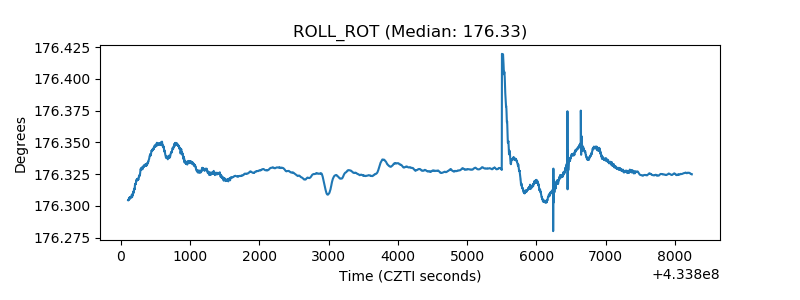 |
| _Roll_DEC | 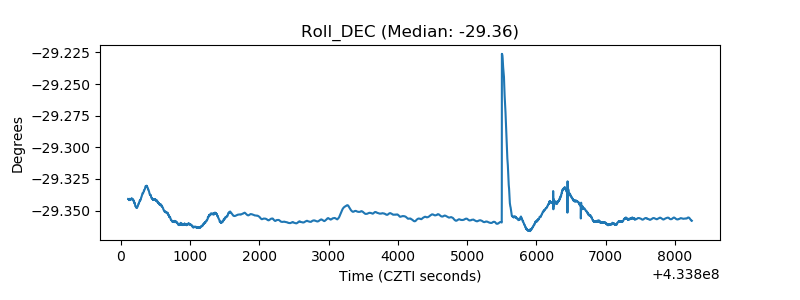 |
| _Roll_RA | 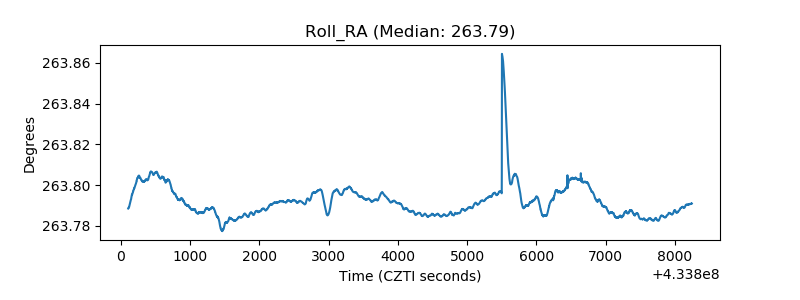 |
| Veto Counter | 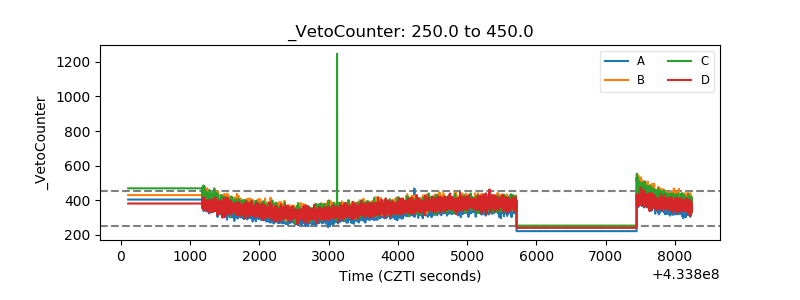 |