| Param | Original file | Final file |
|---|---|---|
| Filename | modeM0/AS1A12_089T01_9000005864_43300cztM0_level2.fits | modeM0/AS1A12_089T01_9000005864_43300cztM0_level2_quad_clean.evt |
| Size (bytes) | 321,661,440 | 92,004,480 |
| Size | 306.8 MB | 87.7 MB |
| Events in quadrant A | 3,546,979 | 612,838 |
| Events in quadrant B | 2,673,896 | 648,539 |
| Events in quadrant C | 2,601,895 | 613,276 |
| Events in quadrant D | 2,685,731 | 553,131 |
| Mode M9 | |||
|---|---|---|---|
| Quadrant | BADHDUFLAG | Total packets | Discarded packets |
| A | 0 | 21 | 0 |
| B | 0 | 21 | 0 |
| C | 0 | 22 | 0 |
| D | 0 | 22 | 0 |
| Mode SS | |||
|---|---|---|---|
| Quadrant | BADHDUFLAG | Total packets | Discarded packets |
| A | 0 | 104 | 0 |
| B | 0 | 104 | 0 |
| C | 0 | 104 | 0 |
| D | 0 | 104 | 0 |
| Mode M0 | |||
|---|---|---|---|
| Quadrant | BADHDUFLAG | Total packets | Discarded packets |
| A | 0 | 13944 | 2 |
| B | 0 | 11021 | 2 |
| C | 0 | 10562 | 2 |
| D | 0 | 11373 | 3 |
| Quadrant | Total seconds | Saturated seconds | Saturation percentage |
|---|---|---|---|
| A | 5115 | 144 | 2.815249% |
| B | 5115 | 59 | 1.153470% |
| C | 5115 | 11 | 0.215054% |
| D | 5114 | 80 | 1.564333% |
Noise dominated data is calculated using 1-second bins in cleaned event files. If a bin has >2000 counts, and if more than 50% of those come from <1% of pixels, then it is considered to be noise-dominated and hence unusable.
| Quadrant | # 1 sec bins | Bins with >0 counts | Bins with >2000 counts | High rate bins dominated by noise | Noise dominated (total time) | Noise dominated (detector-on time) | Marked lightcurve |
|---|---|---|---|---|---|---|---|
| A | 7207 | 5116 | 121 | 121 | 1.68% | 2.37% | 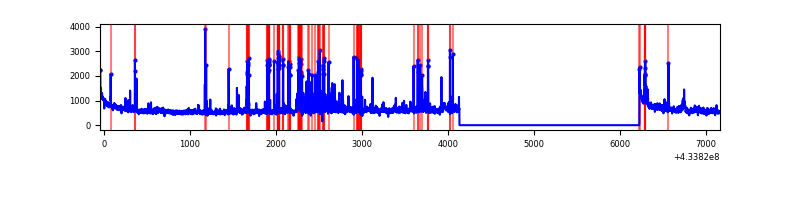 |
| B | 7207 | 5116 | 40 | 40 | 0.56% | 0.78% | 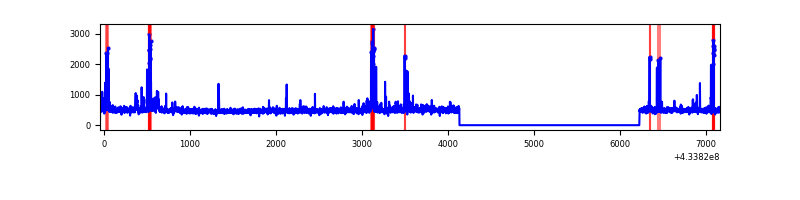 |
| C | 7207 | 5116 | 7 | 7 | 0.10% | 0.14% | 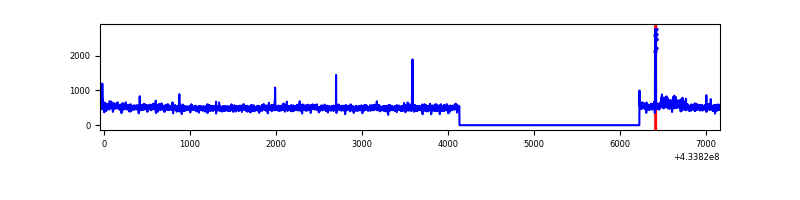 |
| D | 7206 | 5115 | 61 | 61 | 0.85% | 1.19% | 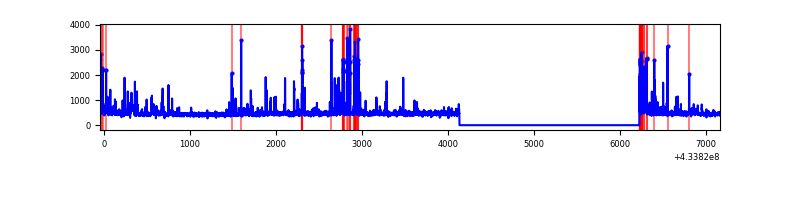 |
Top three noisy pixels from each quadrant. If the there are fewer than three noisy pixels in the level2.evt file, extra rows are filled as -1
| Pixel properties | Quadrant properties | ||||||
|---|---|---|---|---|---|---|---|
| Quadrant | DetID | PixID | Counts | Sigma | Mean | Median | Sigma |
| A | 10 | 83 | 582328 | 4720.71 | 600 | 590 | 123.2 |
| A | 15 | 237 | 494336 | 4006.67 | 600 | 590 | 123.2 |
| A | 12 | 189 | 115998 | 936.52 | 600 | 590 | 123.2 |
| B | 5 | 172 | 92188 | 788.49 | 607 | 592 | 116.2 |
| B | 0 | 190 | 76378 | 652.4 | 607 | 592 | 116.2 |
| B | 5 | 255 | 58179 | 495.73 | 607 | 592 | 116.2 |
| C | 15 | 214 | 219036 | 1578.78 | 595 | 601 | 138.4 |
| C | 7 | 220 | 32825 | 232.91 | 595 | 601 | 138.4 |
| C | 15 | 159 | 22319 | 156.97 | 595 | 601 | 138.4 |
| D | 13 | 249 | 187890 | 1301.44 | 590 | 575 | 143.9 |
| D | 2 | 249 | 71584 | 493.36 | 590 | 575 | 143.9 |
| D | 1 | 52 | 52217 | 358.8 | 590 | 575 | 143.9 |
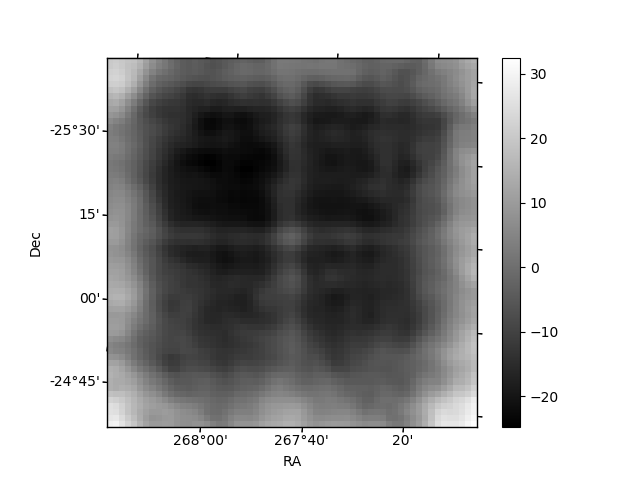
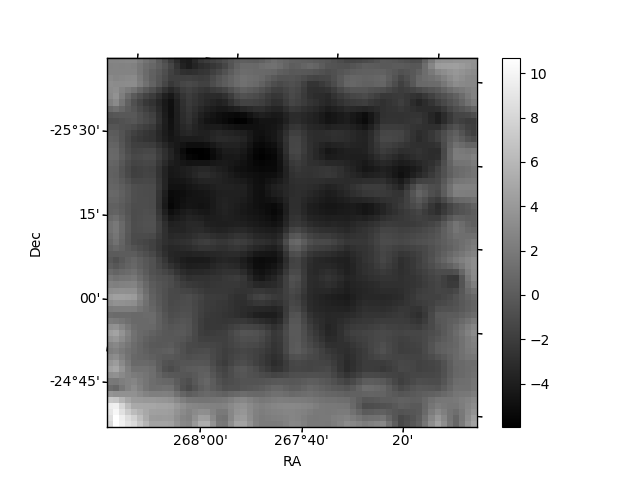
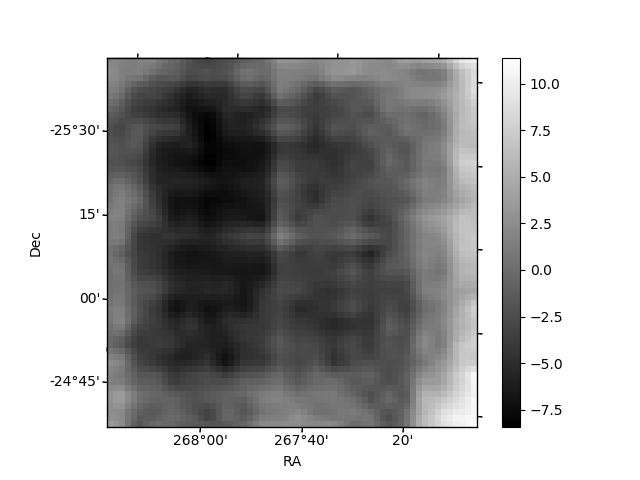
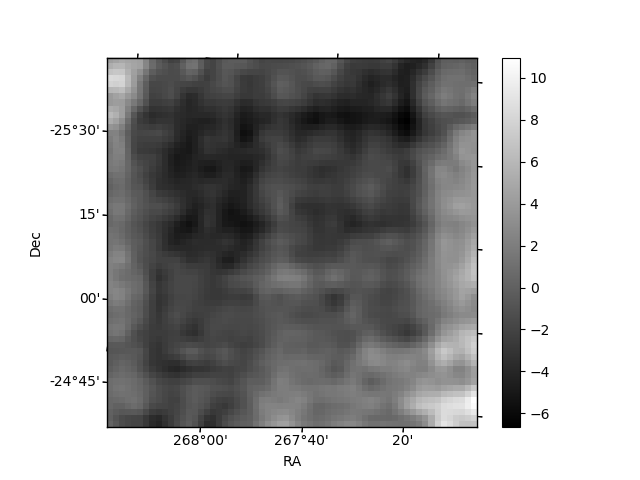
Histogram calculated using DETX and DETY for each event in the final _common_clean file
| Quadrant A | 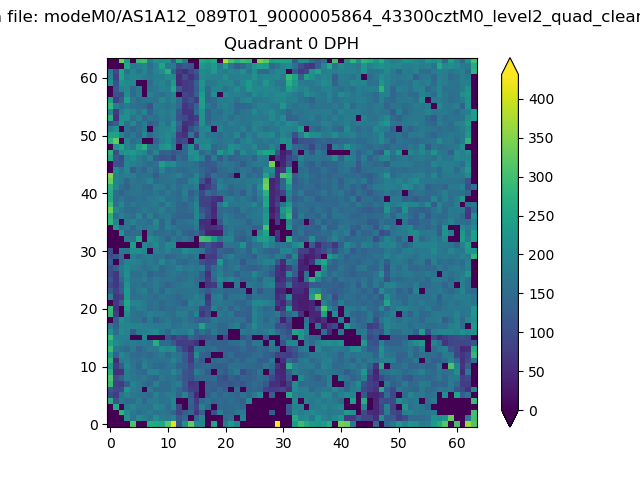 |
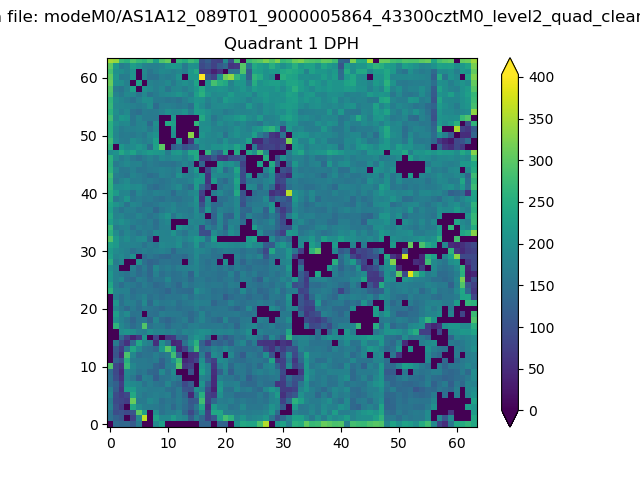 |
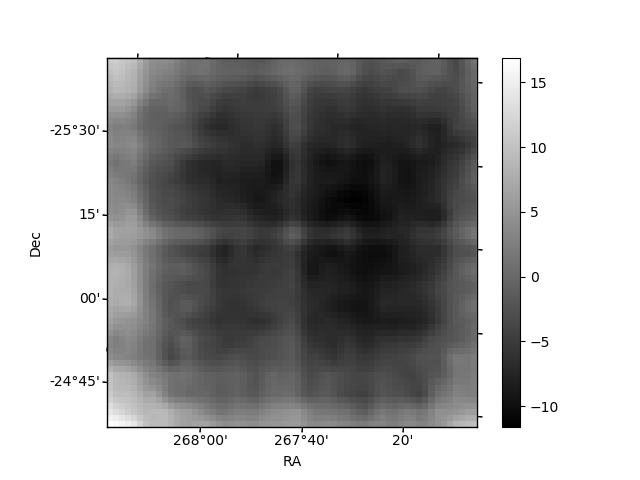
Quadrant B |
|---|---|---|---|
| Quadrant D | 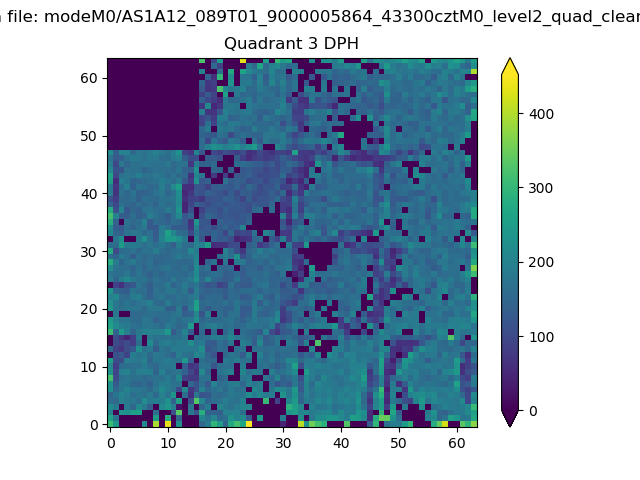 |
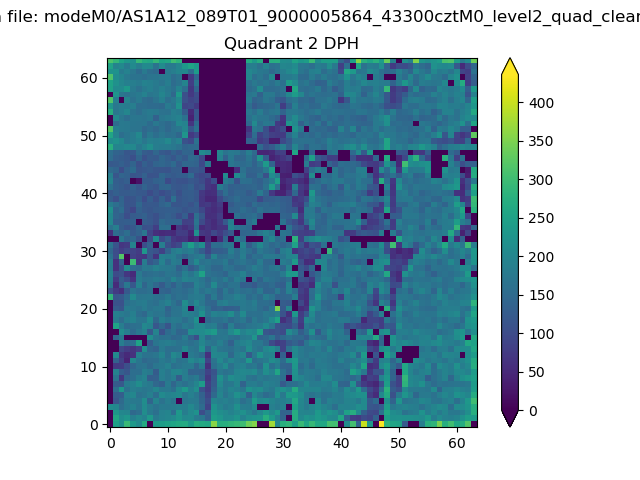 |
Quadrant C |
| Plot type | Count rate plots | Images |
|---|---|---|
| Comparison with Poisson distribution Blue bars denote a histogram of data divided into 1 sec bins. Red curve is a Poisson curve with rate = median count rate of data. |
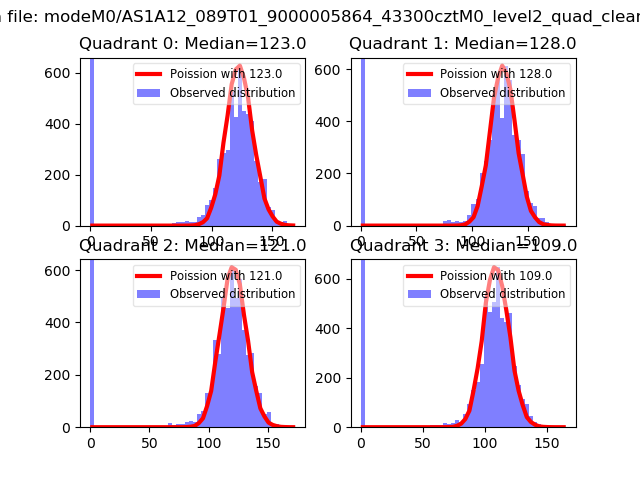 |
 |
| Quadrant-wise count rates Data is divided into 100 sec bins |
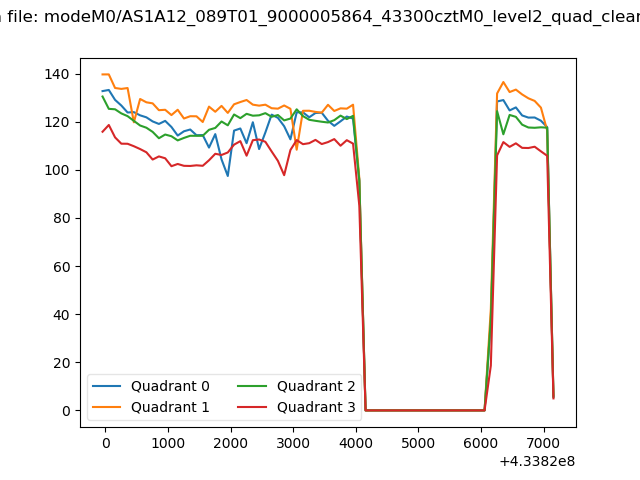 |
|
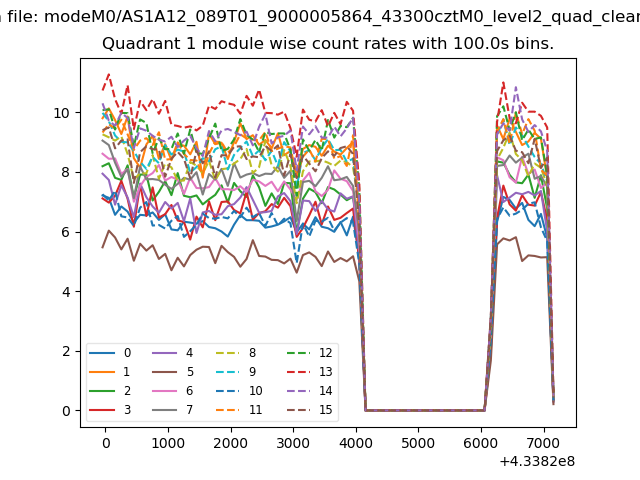
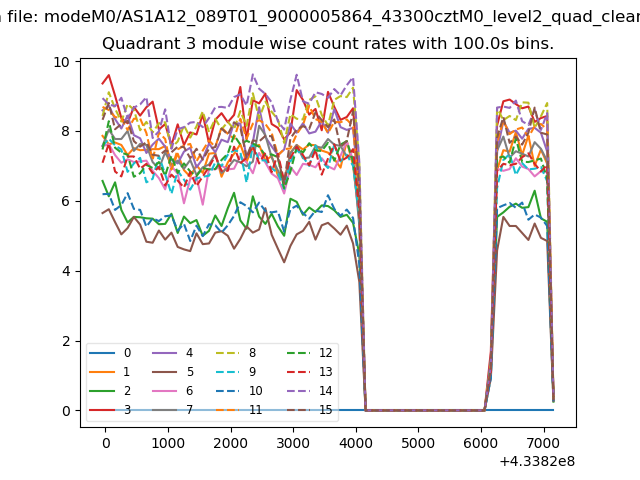
| Module-wise count rates for Quadrant A Data is divided into 100 sec bins |
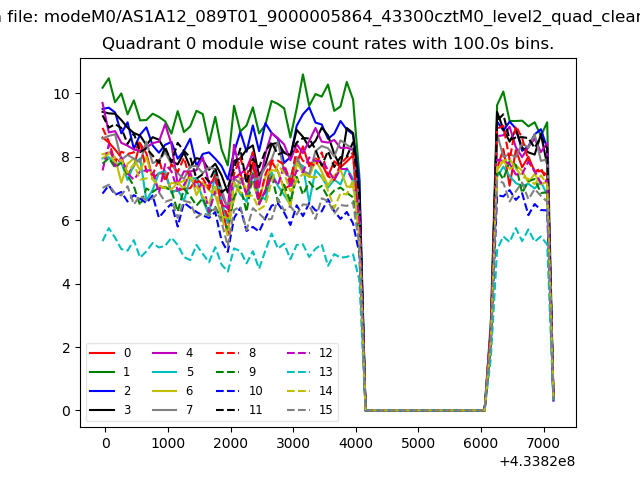 |
 |
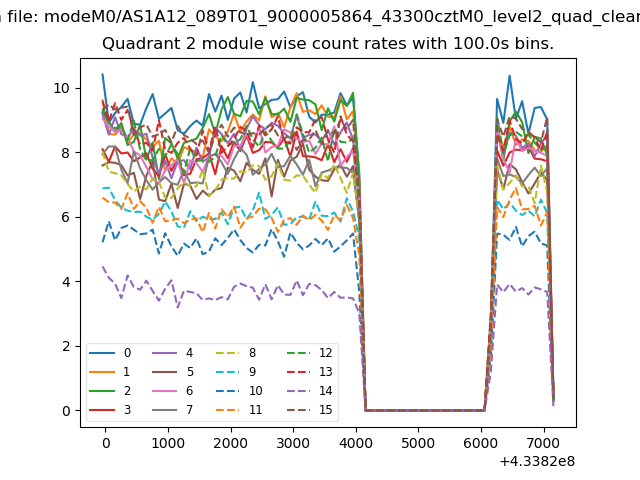
| Module-wise count rates for Quadrant B Data is divided into 100 sec bins |
 |
 |
| Module-wise count rates for Quadrant C Data is divided into 100 sec bins |
 |
 |
| Module-wise count rates for Quadrant D Data is divided into 100 sec bins |
 |
 |
| Parameter | Plot |
|---|---|
| CZT HV Monitor | 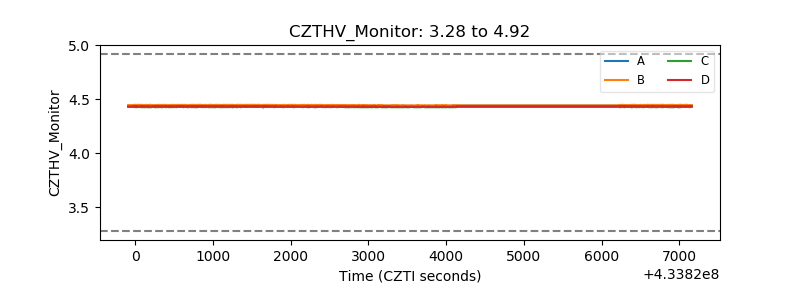 |
| D_VDD | 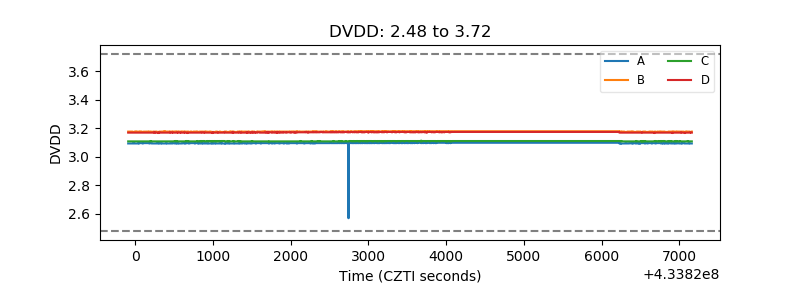 |
| Temperature 1 | 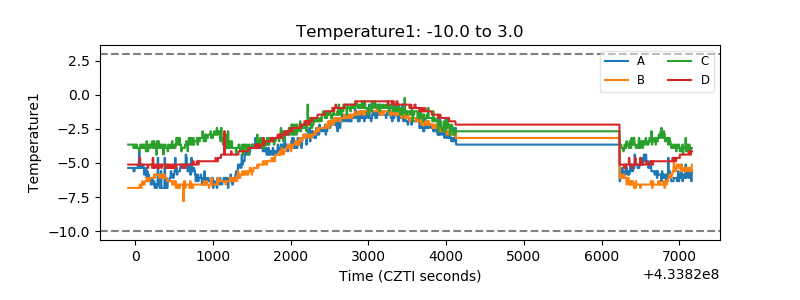 |
| Veto HV Monitor | 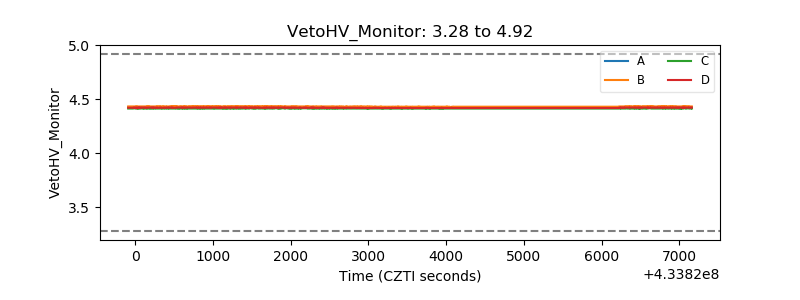 |
| Veto LLD | 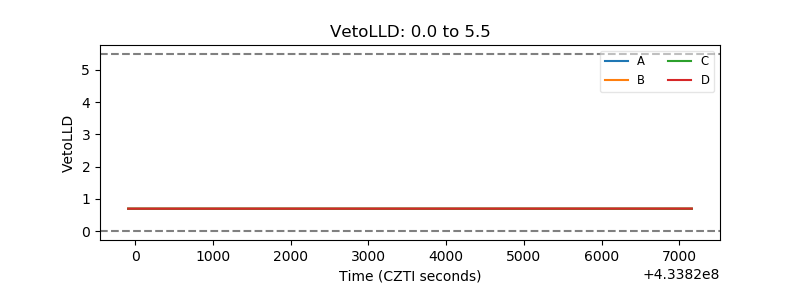 |
| Alpha Counter | 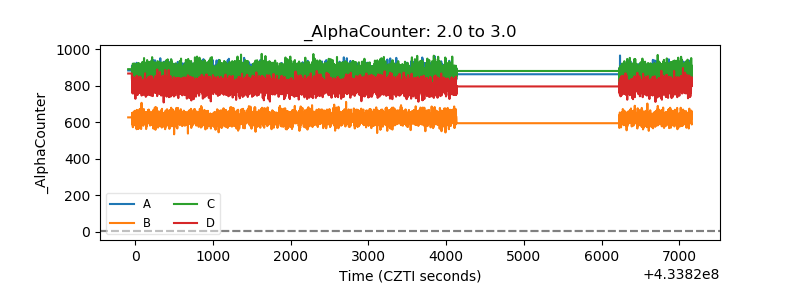 |
| _CPM_Rate | 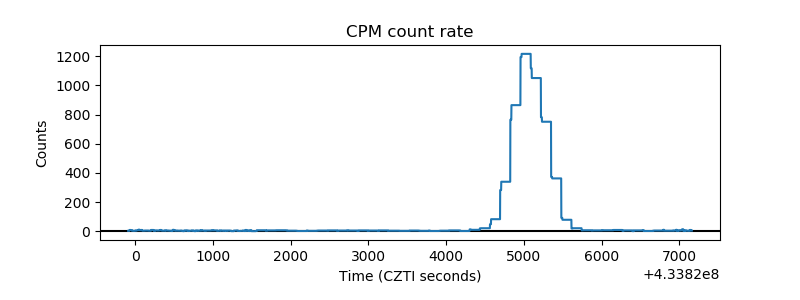 |
| CZT Counter | 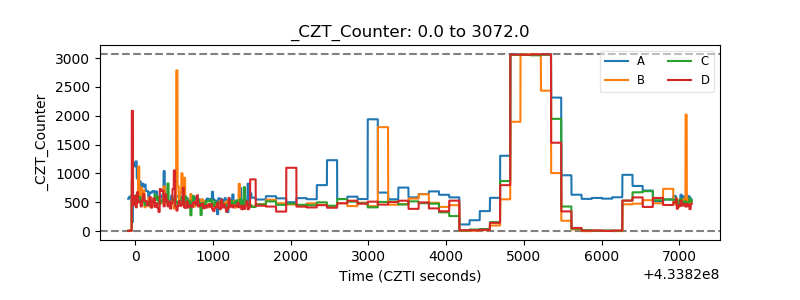 |
| +2.5 Volts monitor | 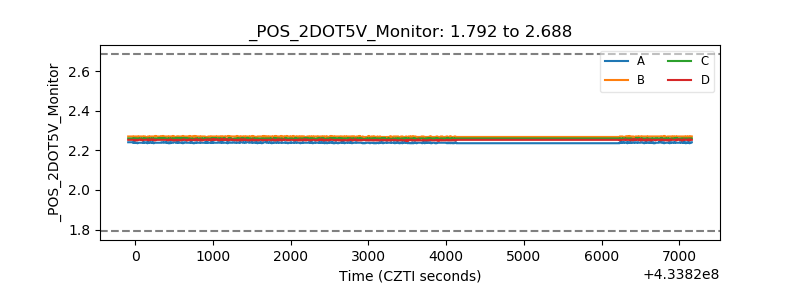 |
| +5 Volts monitor | 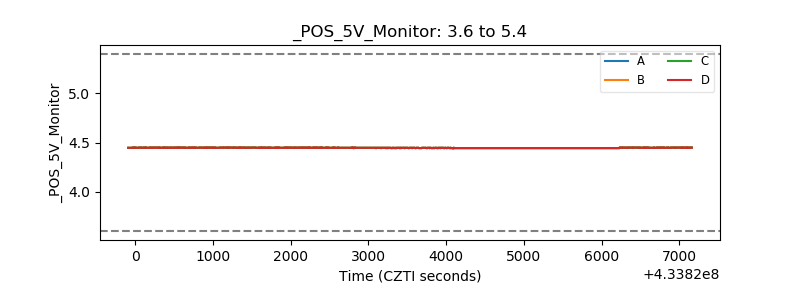 |
| _ROLL_ROT | 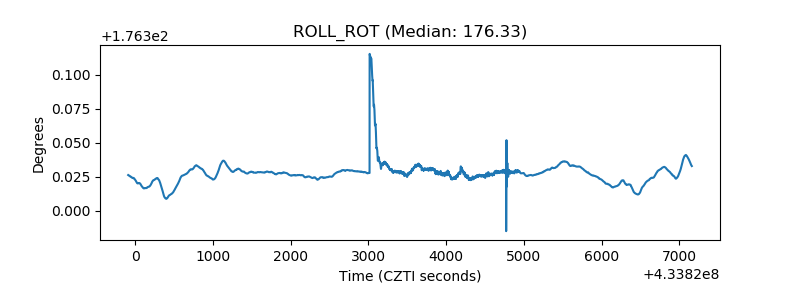 |
| _Roll_DEC | 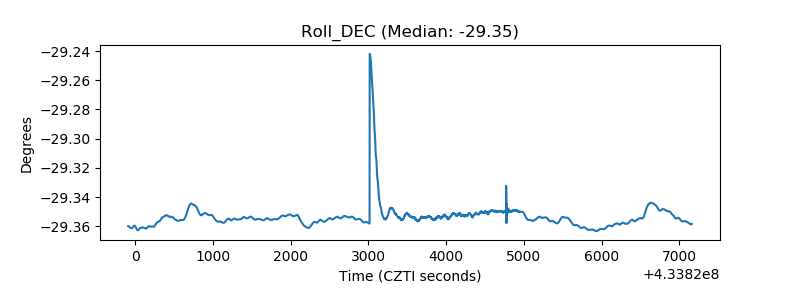 |
| _Roll_RA | 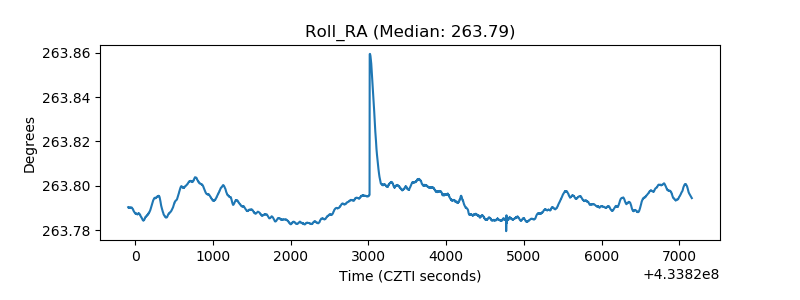 |
| Veto Counter | 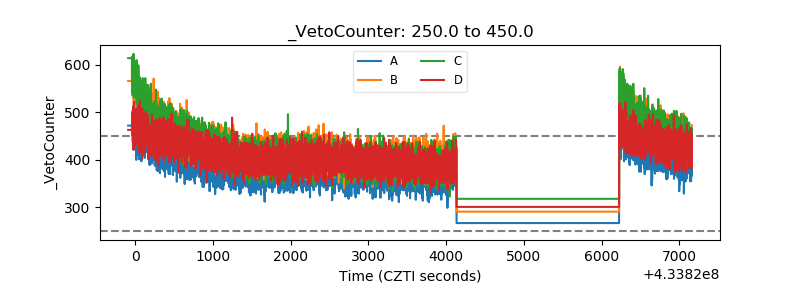 |