| Param | Original file | Final file |
|---|---|---|
| Filename | modeM0/AS1A12_089T01_9000005864_43301cztM0_level2.fits | modeM0/AS1A12_089T01_9000005864_43301cztM0_level2_quad_clean.evt |
| Size (bytes) | 308,160,000 | 87,125,760 |
| Size | 293.9 MB | 83.1 MB |
| Events in quadrant A | 3,259,241 | 580,978 |
| Events in quadrant B | 2,609,418 | 606,326 |
| Events in quadrant C | 2,488,903 | 581,748 |
| Events in quadrant D | 2,667,927 | 525,789 |
| Mode M9 | |||
|---|---|---|---|
| Quadrant | BADHDUFLAG | Total packets | Discarded packets |
| A | 0 | 21 | 0 |
| B | 0 | 21 | 0 |
| C | 0 | 22 | 0 |
| D | 0 | 22 | 0 |
| Mode SS | |||
|---|---|---|---|
| Quadrant | BADHDUFLAG | Total packets | Discarded packets |
| A | 0 | 100 | 0 |
| B | 0 | 100 | 0 |
| C | 0 | 100 | 0 |
| D | 0 | 100 | 0 |
| Mode M0 | |||
|---|---|---|---|
| Quadrant | BADHDUFLAG | Total packets | Discarded packets |
| A | 0 | 12761 | 2 |
| B | 0 | 10752 | 2 |
| C | 0 | 10163 | 2 |
| D | 0 | 11168 | 2 |
| Quadrant | Total seconds | Saturated seconds | Saturation percentage |
|---|---|---|---|
| A | 4896 | 107 | 2.185458% |
| B | 4896 | 86 | 1.756536% |
| C | 4896 | 10 | 0.204248% |
| D | 4896 | 63 | 1.286765% |
Noise dominated data is calculated using 1-second bins in cleaned event files. If a bin has >2000 counts, and if more than 50% of those come from <1% of pixels, then it is considered to be noise-dominated and hence unusable.
| Quadrant | # 1 sec bins | Bins with >0 counts | Bins with >2000 counts | High rate bins dominated by noise | Noise dominated (total time) | Noise dominated (detector-on time) | Marked lightcurve |
|---|---|---|---|---|---|---|---|
| A | 7020 | 4897 | 94 | 94 | 1.34% | 1.92% | 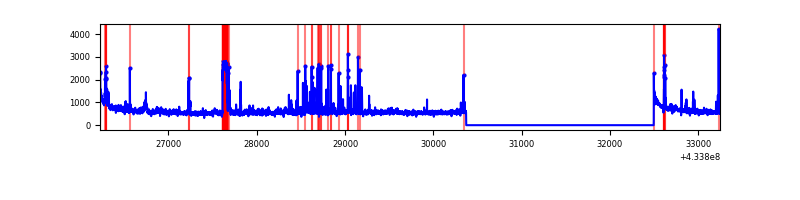 |
| B | 7020 | 4897 | 60 | 60 | 0.85% | 1.23% | 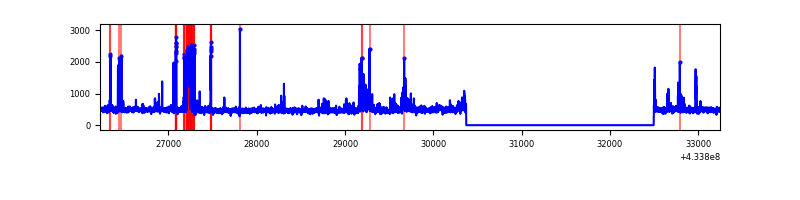 |
| C | 7020 | 4897 | 8 | 8 | 0.11% | 0.16% | 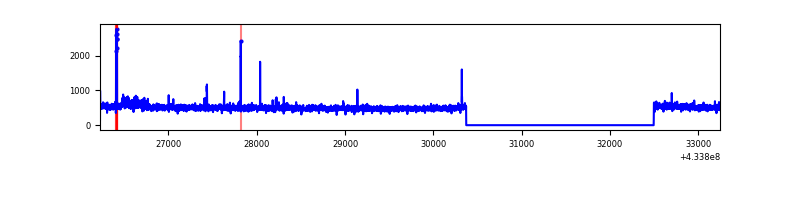 |
| D | 7020 | 4897 | 53 | 53 | 0.75% | 1.08% | 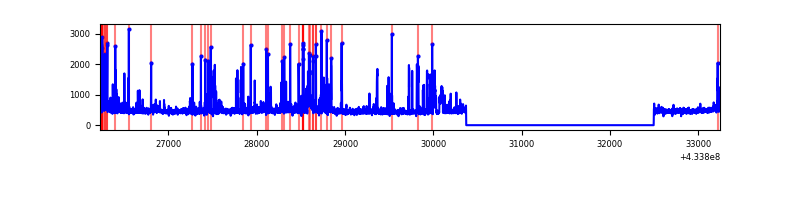 |
Top three noisy pixels from each quadrant. If the there are fewer than three noisy pixels in the level2.evt file, extra rows are filled as -1
| Pixel properties | Quadrant properties | ||||||
|---|---|---|---|---|---|---|---|
| Quadrant | DetID | PixID | Counts | Sigma | Mean | Median | Sigma |
| A | 10 | 83 | 560974 | 4853.93 | 569 | 558 | 115.5 |
| A | 15 | 237 | 375264 | 3245.44 | 569 | 558 | 115.5 |
| A | 12 | 189 | 99293 | 855.17 | 569 | 558 | 115.5 |
| B | 5 | 172 | 178406 | 1600.46 | 572 | 558 | 111.1 |
| B | 0 | 186 | 75845 | 677.51 | 572 | 558 | 111.1 |
| B | 5 | 255 | 38081 | 337.67 | 572 | 558 | 111.1 |
| C | 15 | 214 | 210234 | 1599.5 | 564 | 568 | 131.1 |
| C | 7 | 220 | 35124 | 263.62 | 564 | 568 | 131.1 |
| C | 15 | 159 | 27563 | 205.94 | 564 | 568 | 131.1 |
| D | 2 | 96 | 168273 | 1243.4 | 559 | 545 | 134.9 |
| D | 13 | 249 | 166723 | 1231.91 | 559 | 545 | 134.9 |
| D | 2 | 249 | 40576 | 296.76 | 559 | 545 | 134.9 |
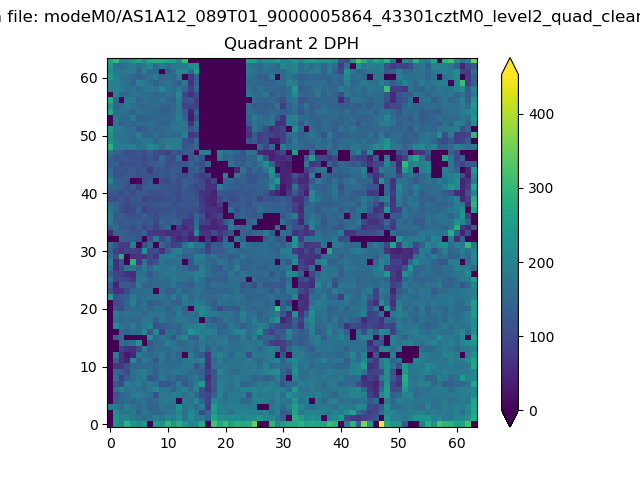
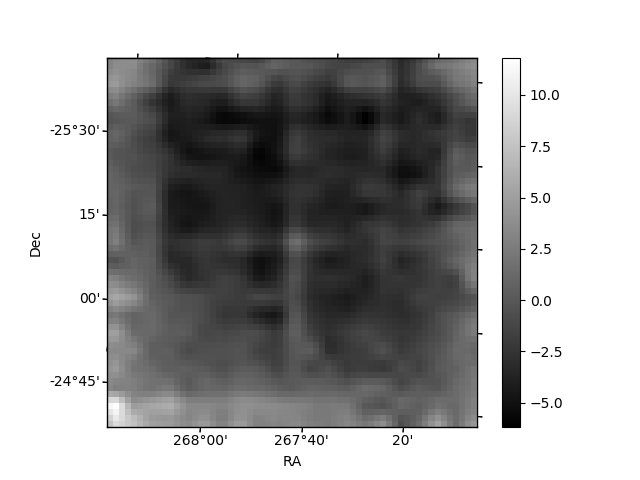
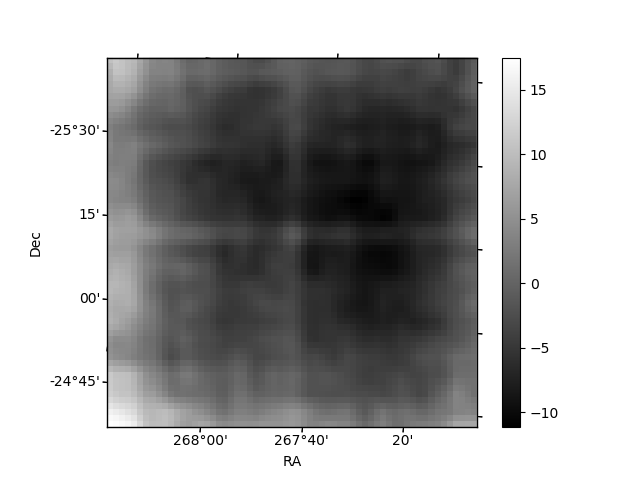
Histogram calculated using DETX and DETY for each event in the final _common_clean file
| Quadrant A |  |
 |
Quadrant B |
|---|---|---|---|
| Quadrant D |  |
 |
Quadrant C |
| Plot type | Count rate plots | Images |
|---|---|---|
| Comparison with Poisson distribution Blue bars denote a histogram of data divided into 1 sec bins. Red curve is a Poisson curve with rate = median count rate of data. |
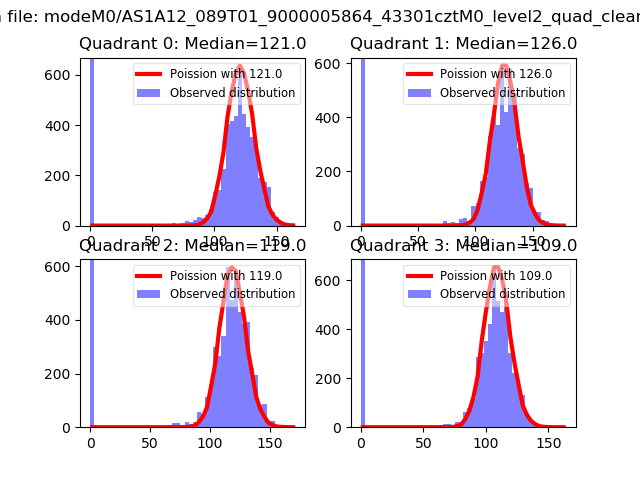 |
 |
| Quadrant-wise count rates Data is divided into 100 sec bins |
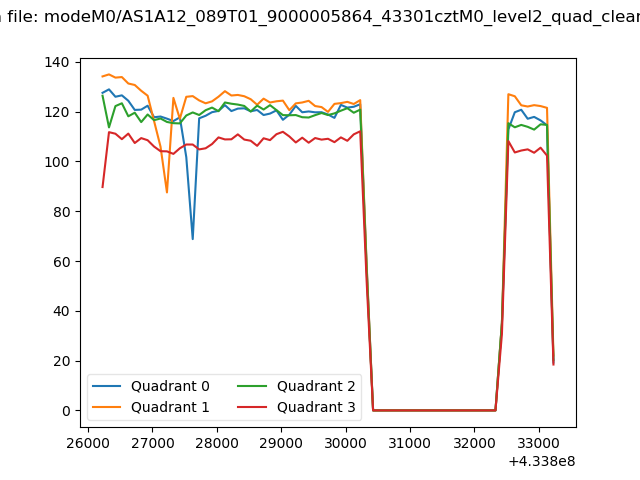 |
|
| Module-wise count rates for Quadrant A Data is divided into 100 sec bins |
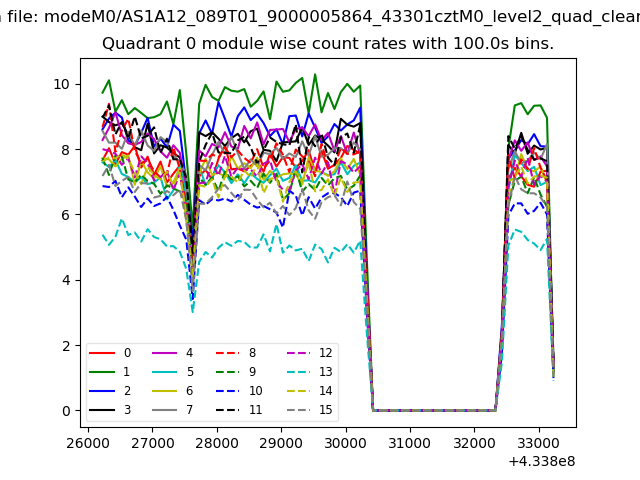 |
 |
| Module-wise count rates for Quadrant B Data is divided into 100 sec bins |
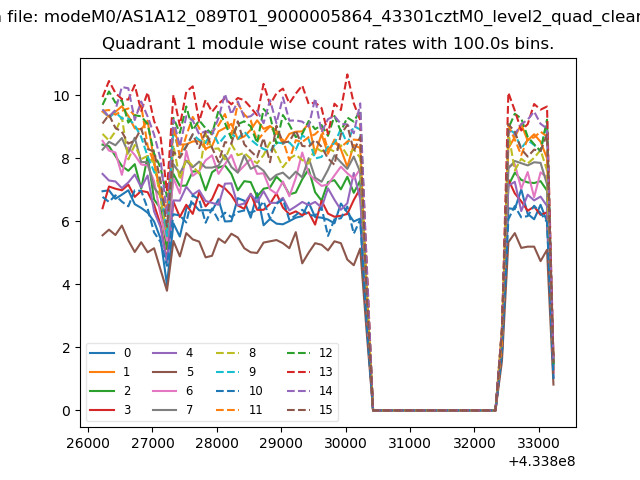 |
 |
| Module-wise count rates for Quadrant C Data is divided into 100 sec bins |
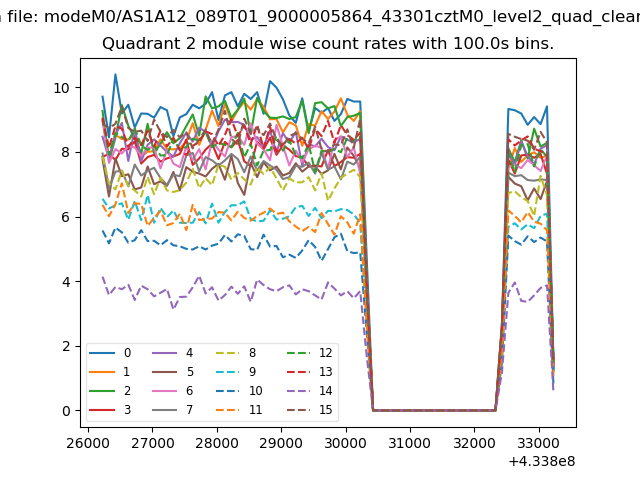 |
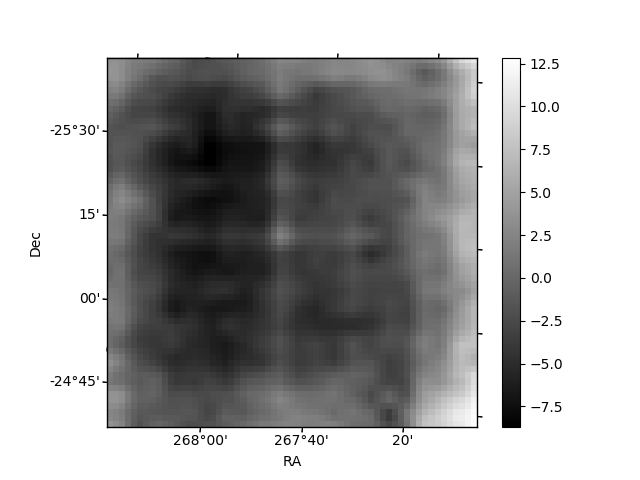 |
| Module-wise count rates for Quadrant D Data is divided into 100 sec bins |
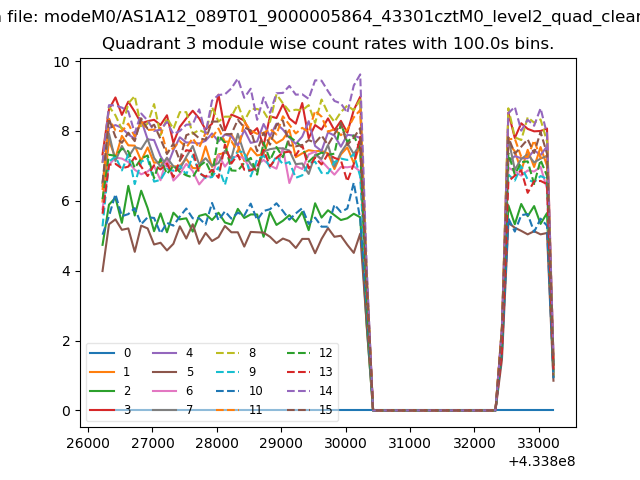 |
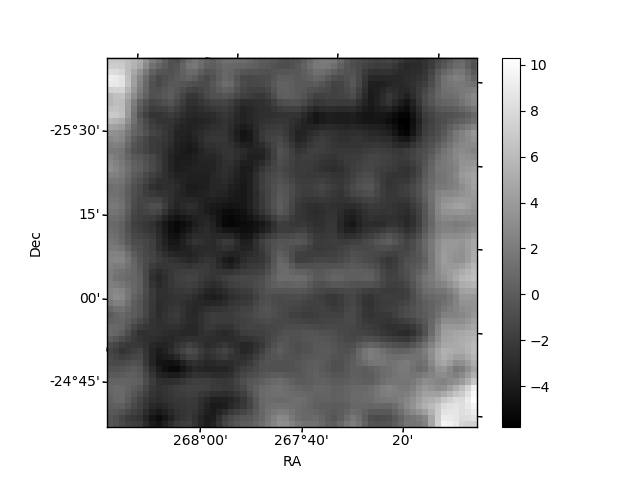 |
| Parameter | Plot |
|---|---|
| CZT HV Monitor |  |
| D_VDD | 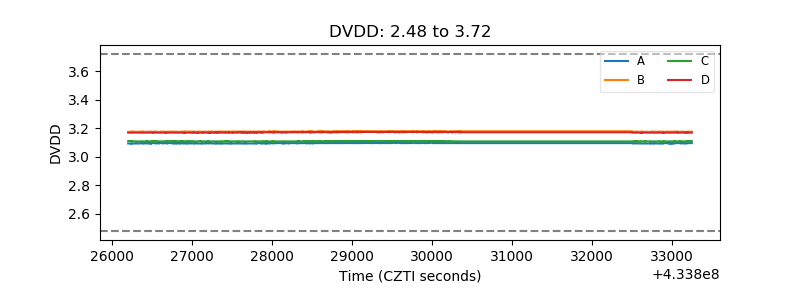 |
| Temperature 1 | 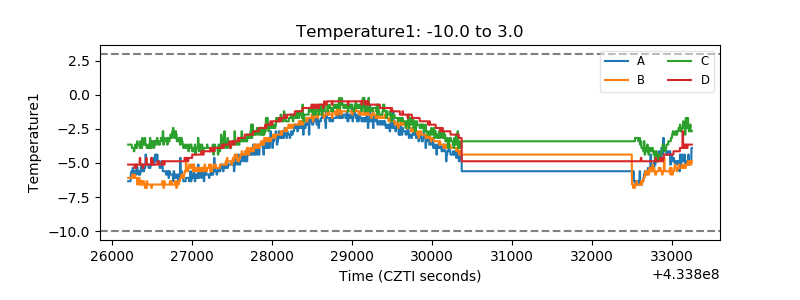 |
| Veto HV Monitor | 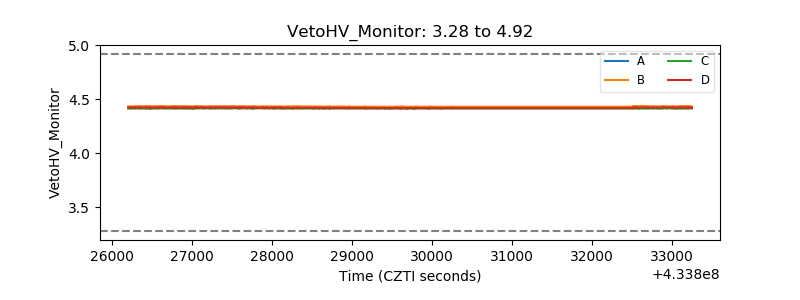 |
| Veto LLD | 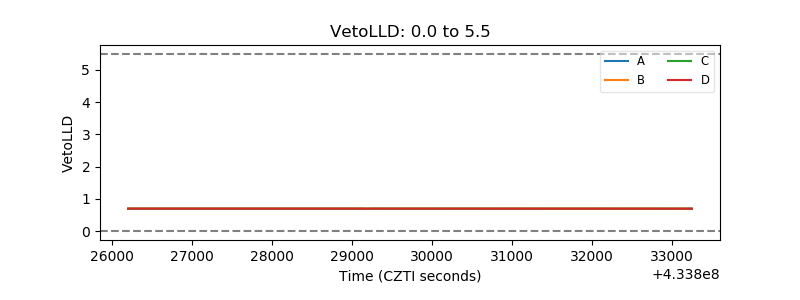 |
| Alpha Counter | 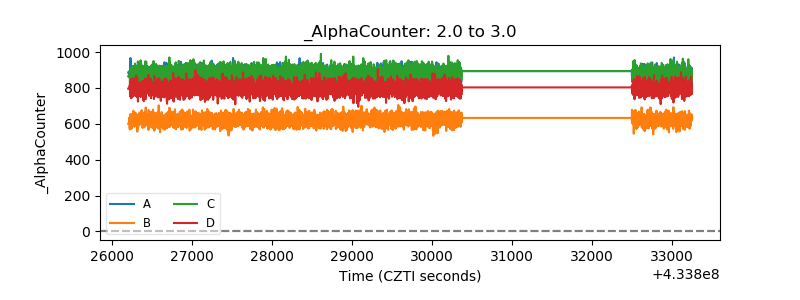 |
| _CPM_Rate | 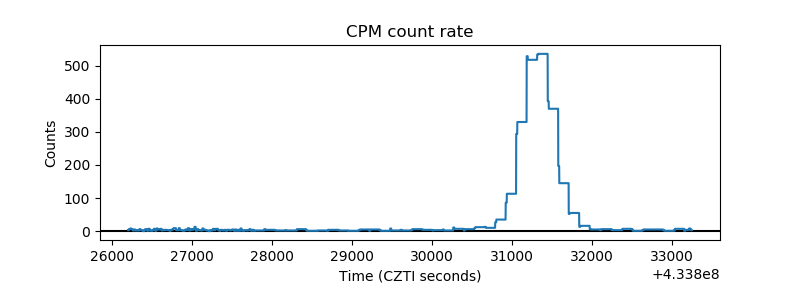 |
| CZT Counter | 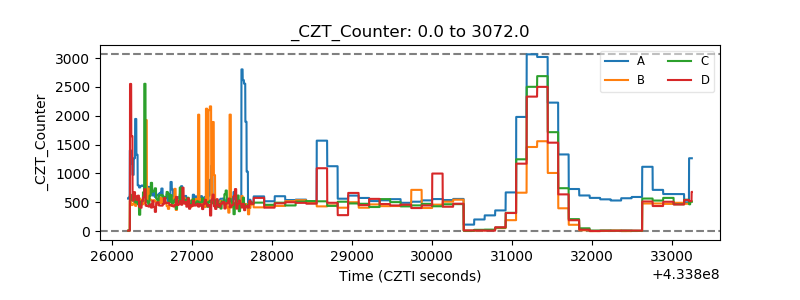 |
| +2.5 Volts monitor | 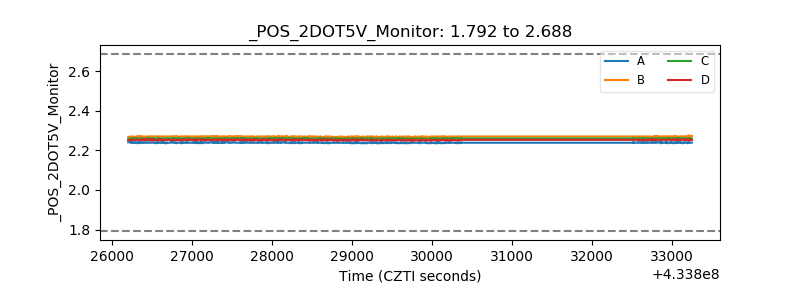 |
| +5 Volts monitor | 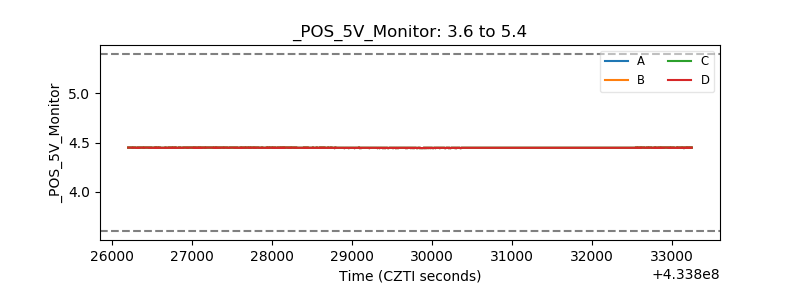 |
| _ROLL_ROT | 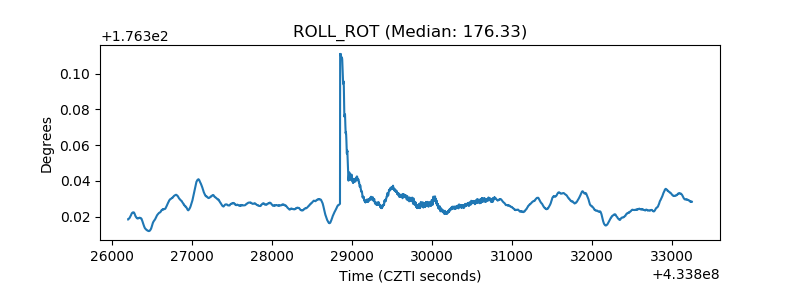 |
| _Roll_DEC | 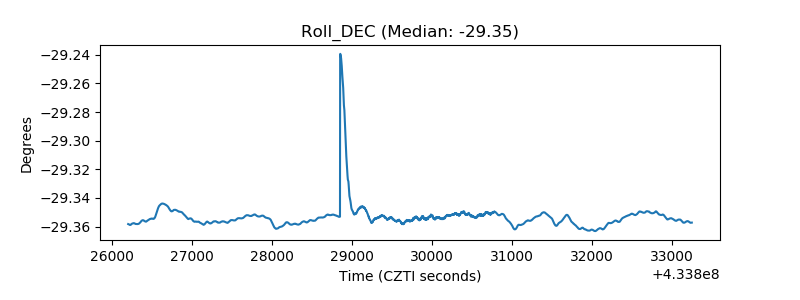 |
| _Roll_RA | 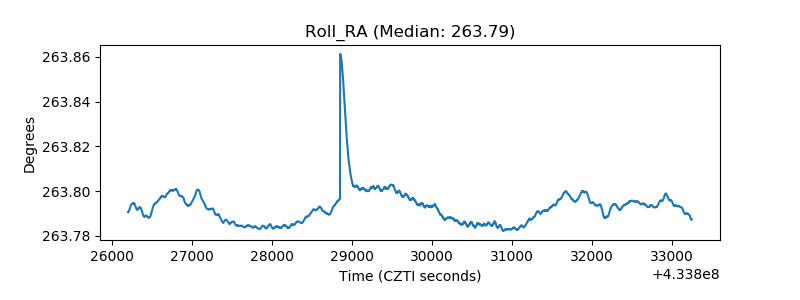 |
| Veto Counter | 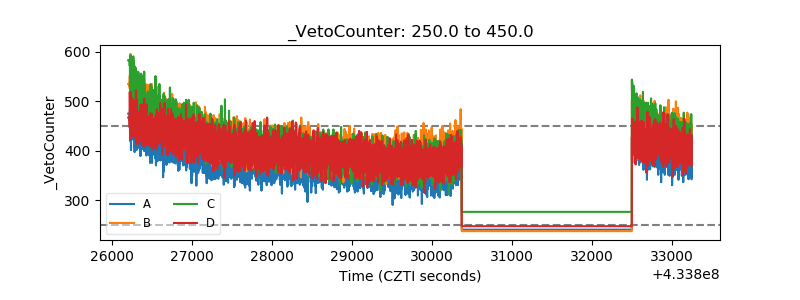 |