| Param | Original file | Final file |
|---|---|---|
| Filename | modeM0/AS1A12_089T01_9000005864_43302cztM0_level2.fits | modeM0/AS1A12_089T01_9000005864_43302cztM0_level2_quad_clean.evt |
| Size (bytes) | 326,649,600 | 85,783,680 |
| Size | 311.5 MB | 81.8 MB |
| Events in quadrant A | 3,840,873 | 555,375 |
| Events in quadrant B | 2,552,562 | 600,247 |
| Events in quadrant C | 2,403,400 | 573,950 |
| Events in quadrant D | 2,907,916 | 519,778 |
| Mode M9 | |||
|---|---|---|---|
| Quadrant | BADHDUFLAG | Total packets | Discarded packets |
| A | 0 | 30 | 0 |
| B | 0 | 30 | 0 |
| C | 0 | 31 | 0 |
| D | 0 | 31 | 0 |
| Mode SS | |||
|---|---|---|---|
| Quadrant | BADHDUFLAG | Total packets | Discarded packets |
| A | 0 | 102 | 0 |
| B | 0 | 102 | 0 |
| C | 0 | 102 | 0 |
| D | 0 | 102 | 0 |
| Mode M0 | |||
|---|---|---|---|
| Quadrant | BADHDUFLAG | Total packets | Discarded packets |
| A | 0 | 14501 | 2 |
| B | 0 | 10741 | 2 |
| C | 0 | 10042 | 2 |
| D | 0 | 11993 | 2 |
| Quadrant | Total seconds | Saturated seconds | Saturation percentage |
|---|---|---|---|
| A | 4965 | 283 | 5.699899% |
| B | 4965 | 16 | 0.322256% |
| C | 4965 | 4 | 0.080564% |
| D | 4965 | 40 | 0.805639% |
Noise dominated data is calculated using 1-second bins in cleaned event files. If a bin has >2000 counts, and if more than 50% of those come from <1% of pixels, then it is considered to be noise-dominated and hence unusable.
| Quadrant | # 1 sec bins | Bins with >0 counts | Bins with >2000 counts | High rate bins dominated by noise | Noise dominated (total time) | Noise dominated (detector-on time) | Marked lightcurve |
|---|---|---|---|---|---|---|---|
| A | 7058 | 4966 | 244 | 244 | 3.46% | 4.91% | 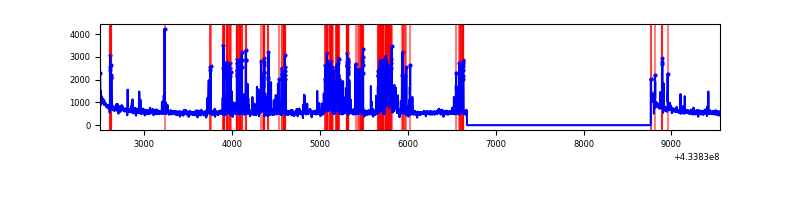 |
| B | 7058 | 4966 | 8 | 8 | 0.11% | 0.16% | 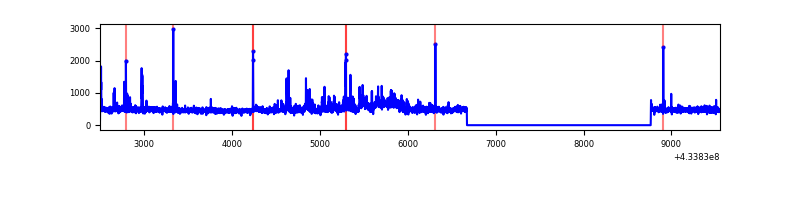 |
| C | 7058 | 4966 | 0 | 0 | 0.00% | 0.00% | 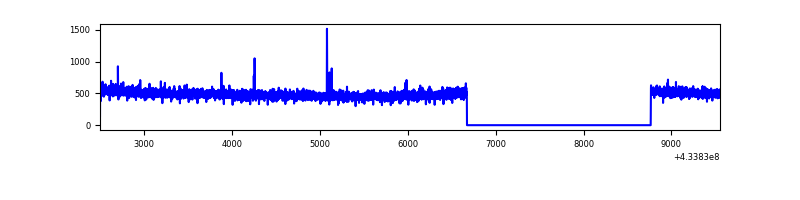 |
| D | 7058 | 4966 | 33 | 33 | 0.47% | 0.66% | 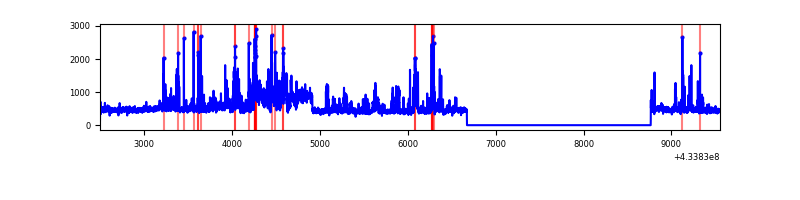 |
Top three noisy pixels from each quadrant. If the there are fewer than three noisy pixels in the level2.evt file, extra rows are filled as -1
| Pixel properties | Quadrant properties | ||||||
|---|---|---|---|---|---|---|---|
| Quadrant | DetID | PixID | Counts | Sigma | Mean | Median | Sigma |
| A | 15 | 237 | 835244 | 7323.1 | 561 | 552 | 114.0 |
| A | 10 | 83 | 580987 | 5092.4 | 561 | 552 | 114.0 |
| A | 15 | 223 | 211453 | 1850.32 | 561 | 552 | 114.0 |
| B | 4 | 67 | 157629 | 1415.57 | 568 | 552 | 111.0 |
| B | 5 | 172 | 44932 | 399.95 | 568 | 552 | 111.0 |
| B | 0 | 190 | 43426 | 386.38 | 568 | 552 | 111.0 |
| C | 15 | 214 | 213729 | 1624.25 | 557 | 560 | 131.2 |
| C | 15 | 159 | 9466 | 67.86 | 557 | 560 | 131.2 |
| C | 3 | 233 | 4401 | 29.27 | 557 | 560 | 131.2 |
| D | 1 | 20 | 280290 | 2040.37 | 556 | 540 | 137.1 |
| D | 2 | 96 | 195518 | 1422.08 | 556 | 540 | 137.1 |
| D | 2 | 249 | 112825 | 818.96 | 556 | 540 | 137.1 |
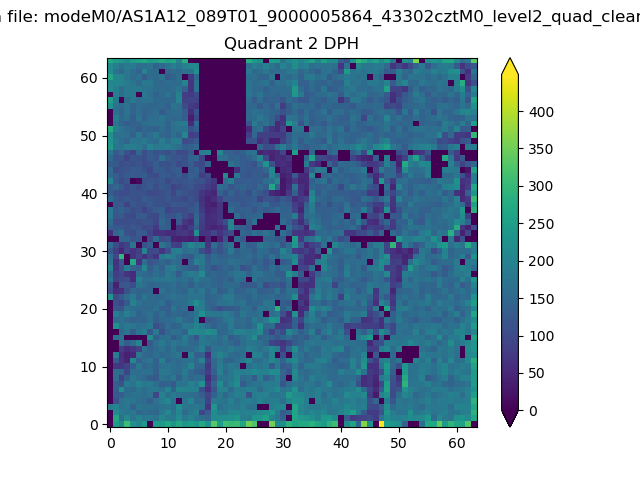
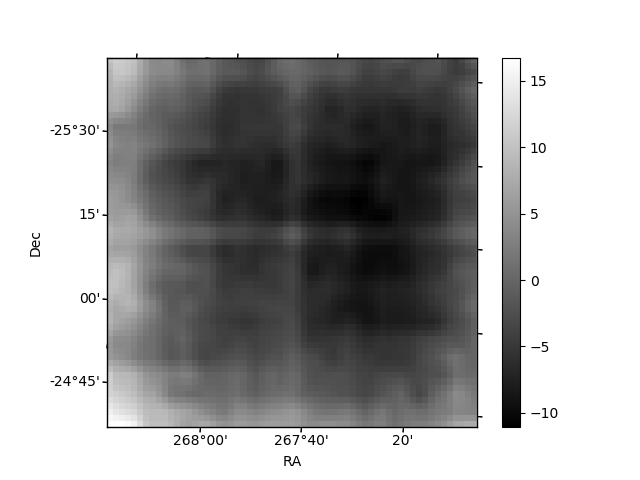
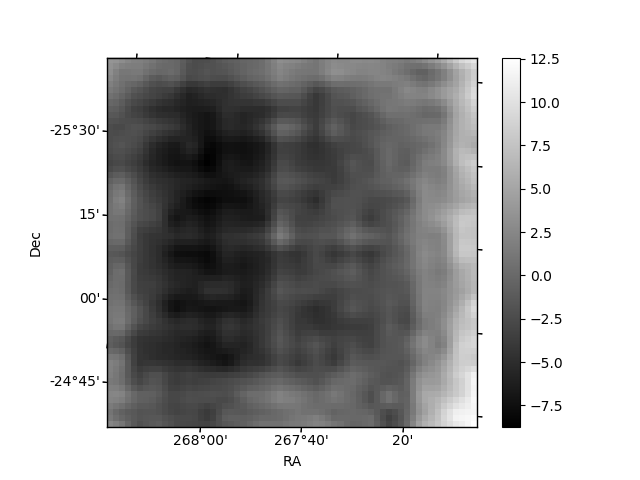
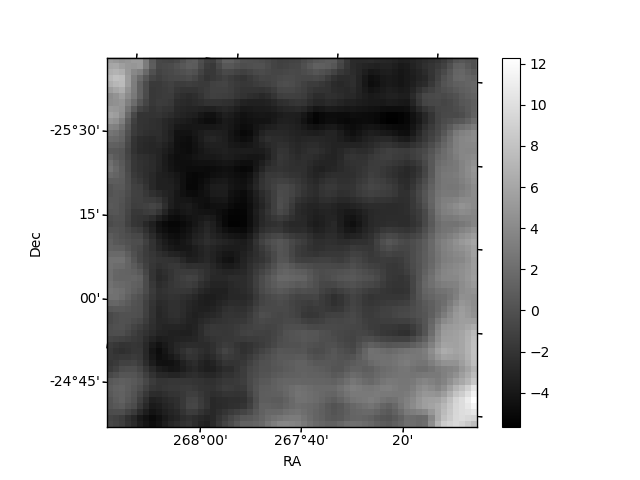
Histogram calculated using DETX and DETY for each event in the final _common_clean file
| Quadrant A | 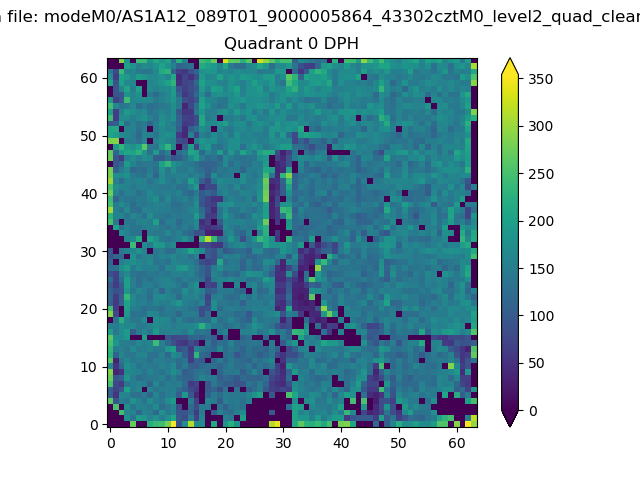 |
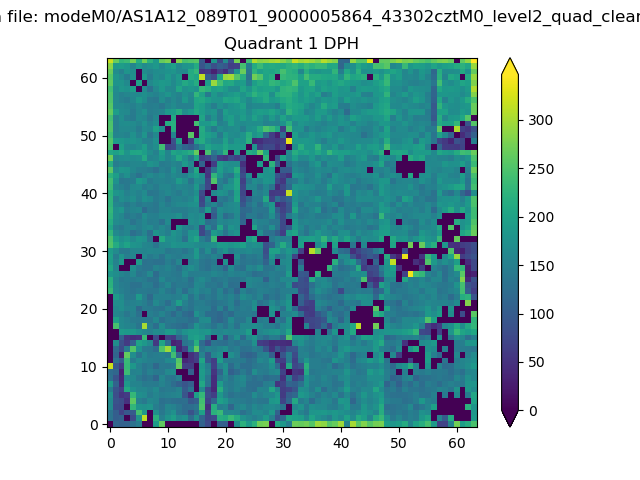 |
Quadrant B |
|---|---|---|---|
| Quadrant D | 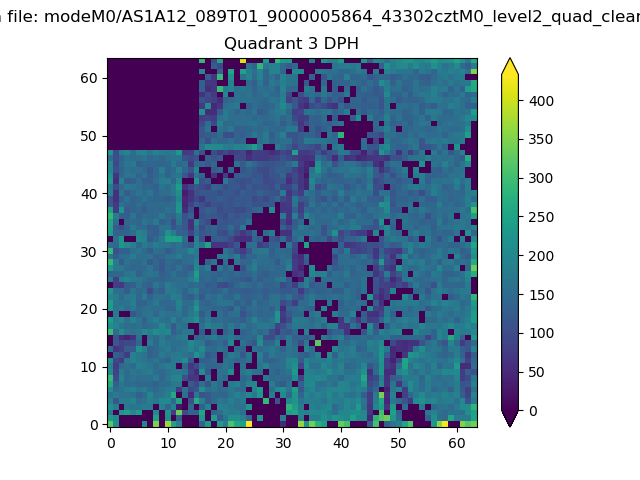 |
 |
Quadrant C |
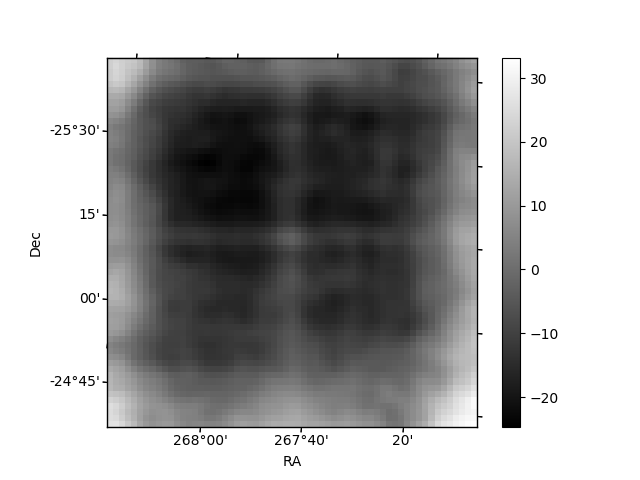
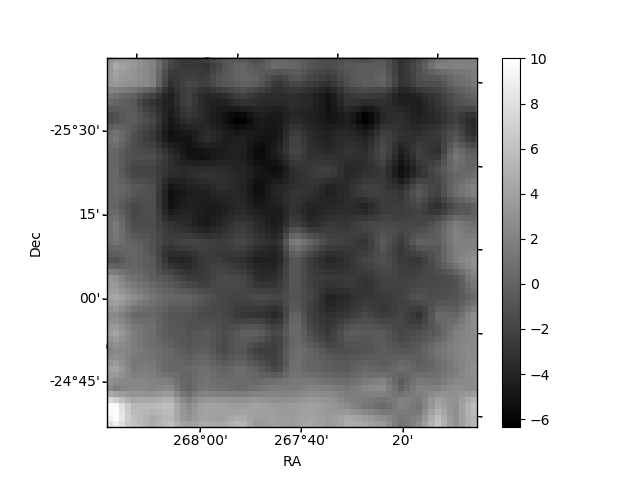
| Plot type | Count rate plots | Images |
|---|---|---|
| Comparison with Poisson distribution Blue bars denote a histogram of data divided into 1 sec bins. Red curve is a Poisson curve with rate = median count rate of data. |
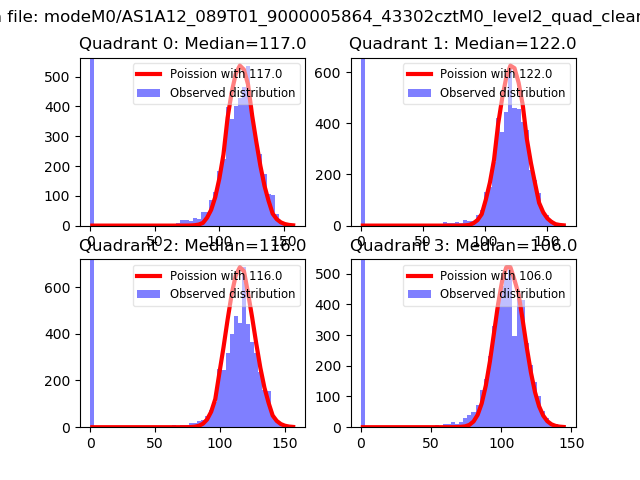 |
 |
| Quadrant-wise count rates Data is divided into 100 sec bins |
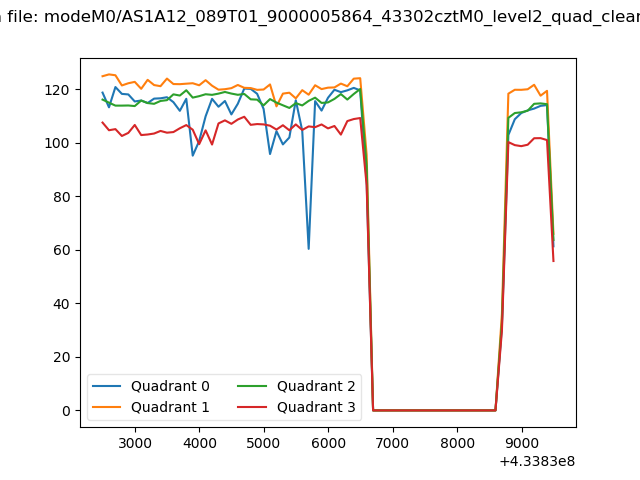 |
|
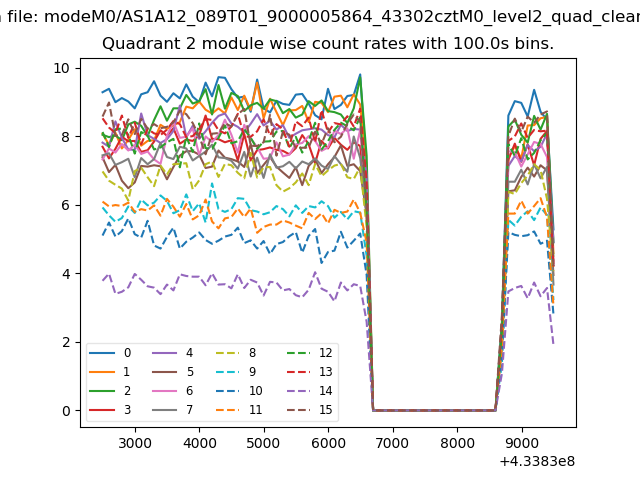
| Module-wise count rates for Quadrant A Data is divided into 100 sec bins |
 |
 |
| Module-wise count rates for Quadrant B Data is divided into 100 sec bins |
 |
 |
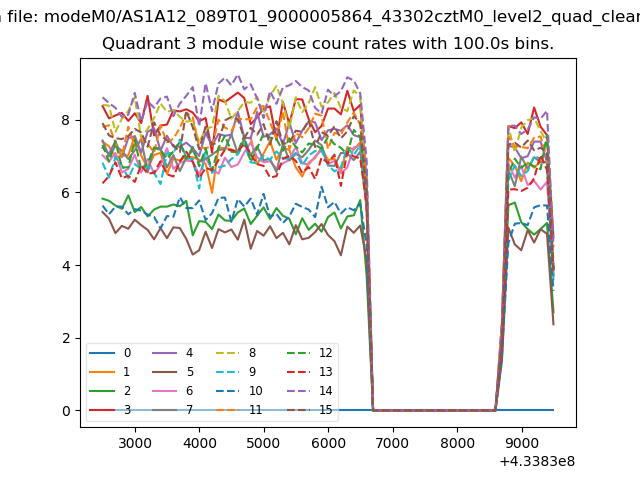
| Module-wise count rates for Quadrant C Data is divided into 100 sec bins |
 |
 |
| Module-wise count rates for Quadrant D Data is divided into 100 sec bins |
 |
 |
| Parameter | Plot |
|---|---|
| CZT HV Monitor | 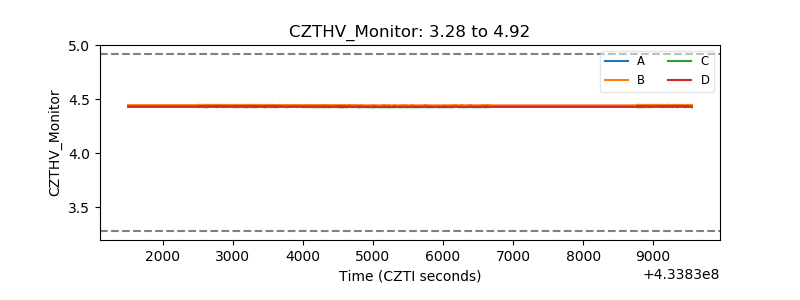 |
| D_VDD | 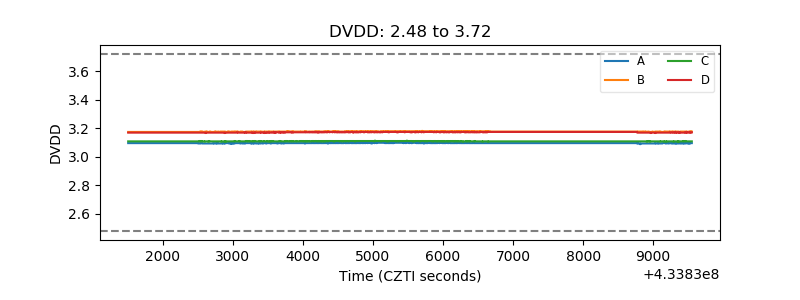 |
| Temperature 1 | 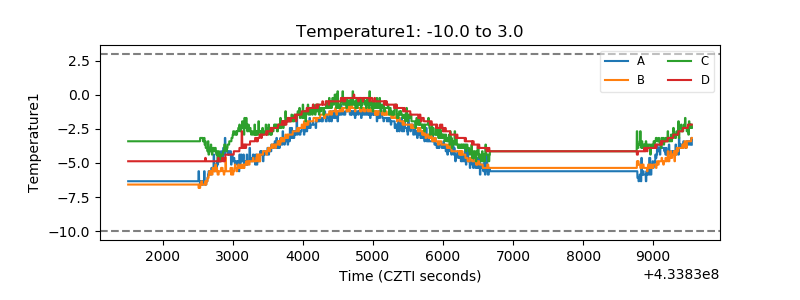 |
| Veto HV Monitor |  |
| Veto LLD | 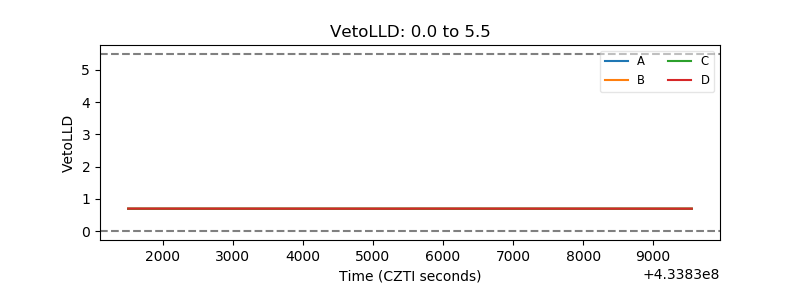 |
| Alpha Counter | 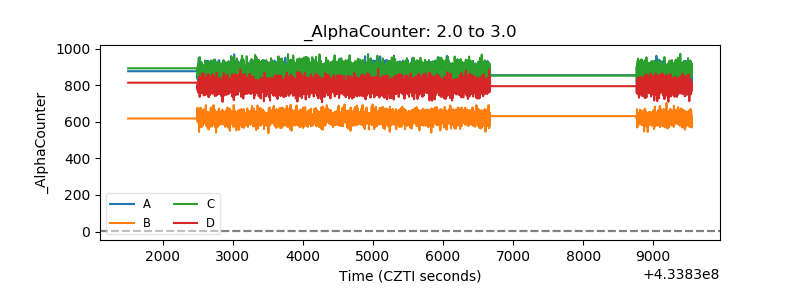 |
| _CPM_Rate | 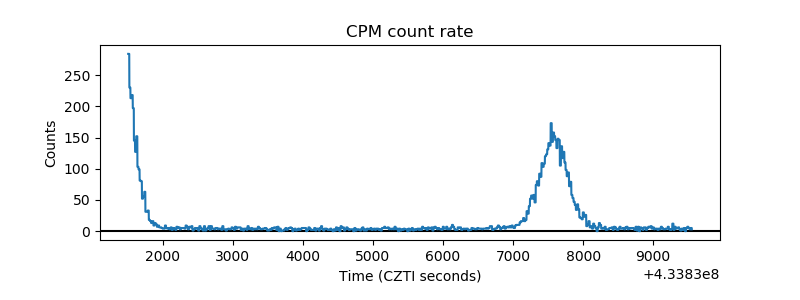 |
| CZT Counter | 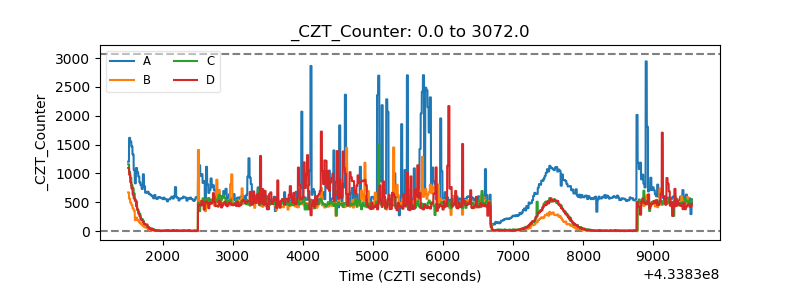 |
| +2.5 Volts monitor | 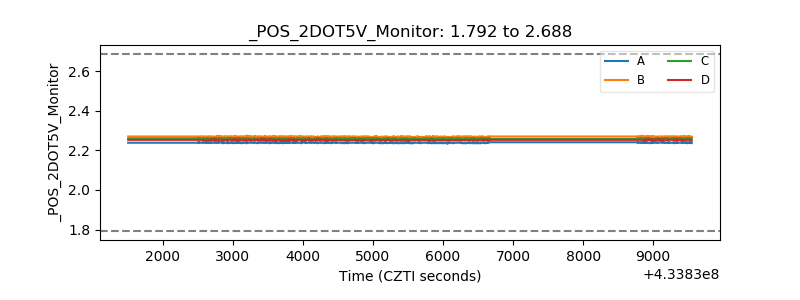 |
| +5 Volts monitor | 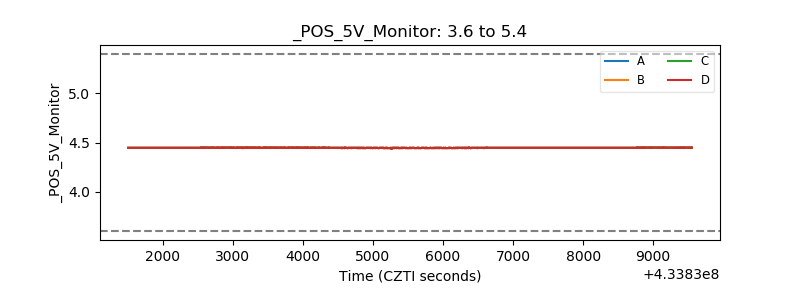 |
| _ROLL_ROT | 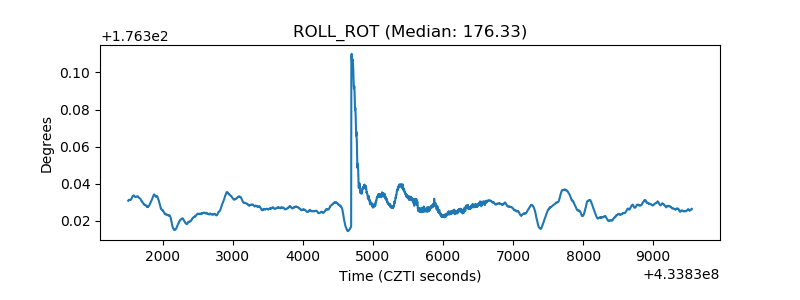 |
| _Roll_DEC | 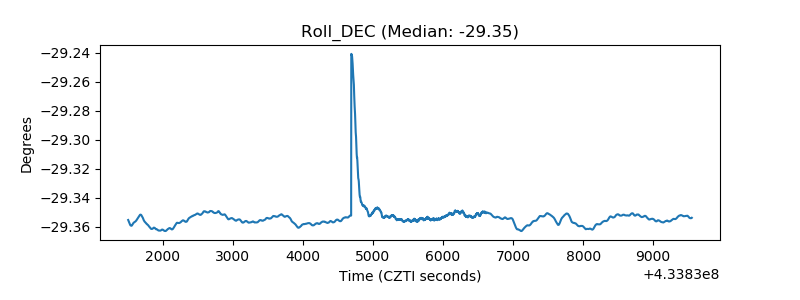 |
| _Roll_RA | 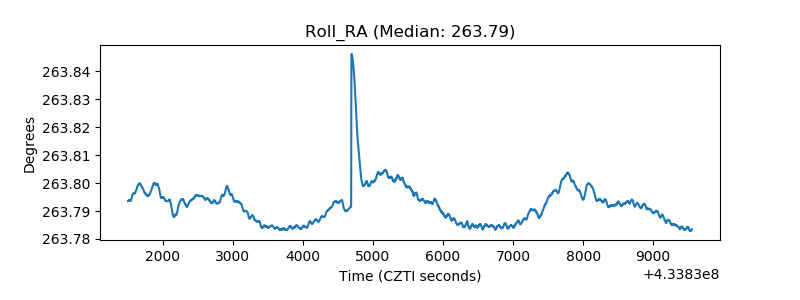 |
| Veto Counter | 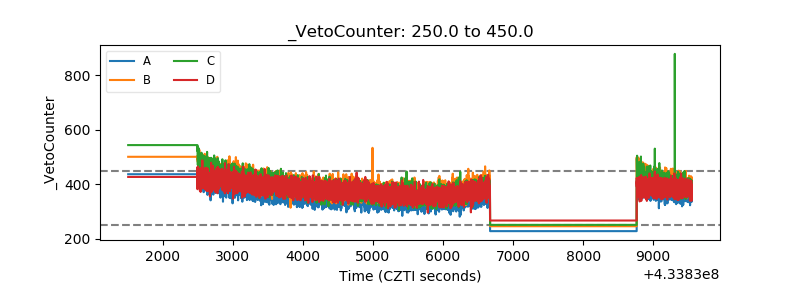 |