| Param | Original file | Final file |
|---|---|---|
| Filename | modeM0/AS1A12_088T25_9000005866_43303cztM0_level2.fits | modeM0/AS1A12_088T25_9000005866_43303cztM0_level2_quad_clean.evt |
| Size (bytes) | 77,630,400 | 20,903,040 |
| Size | 74.0 MB | 19.9 MB |
| Events in quadrant A | 790,049 | 137,886 |
| Events in quadrant B | 660,643 | 144,863 |
| Events in quadrant C | 610,882 | 137,709 |
| Events in quadrant D | 716,117 | 122,635 |
| Mode SS | |||
|---|---|---|---|
| Quadrant | BADHDUFLAG | Total packets | Discarded packets |
| A | 0 | 26 | 0 |
| B | 0 | 26 | 0 |
| C | 0 | 26 | 0 |
| D | 0 | 26 | 0 |
| Mode M0 | |||
|---|---|---|---|
| Quadrant | BADHDUFLAG | Total packets | Discarded packets |
| A | 0 | 3195 | 1 |
| B | 0 | 2682 | 1 |
| C | 0 | 2448 | 1 |
| D | 0 | 2894 | 1 |
| Mode M9 | |||
|---|---|---|---|
| Quadrant | BADHDUFLAG | Total packets | Discarded packets |
| A | 0 | 19 | 0 |
| B | 0 | 19 | 0 |
| C | 0 | 19 | 0 |
| D | 0 | 19 | 0 |
| Quadrant | Total seconds | Saturated seconds | Saturation percentage |
|---|---|---|---|
| A | 1194 | 18 | 1.507538% |
| B | 1193 | 13 | 1.089690% |
| C | 1193 | 1 | 0.083822% |
| D | 1193 | 45 | 3.772003% |
Noise dominated data is calculated using 1-second bins in cleaned event files. If a bin has >2000 counts, and if more than 50% of those come from <1% of pixels, then it is considered to be noise-dominated and hence unusable.
| Quadrant | # 1 sec bins | Bins with >0 counts | Bins with >2000 counts | High rate bins dominated by noise | Noise dominated (total time) | Noise dominated (detector-on time) | Marked lightcurve |
|---|---|---|---|---|---|---|---|
| A | 3107 | 1195 | 7 | 7 | 0.23% | 0.59% | 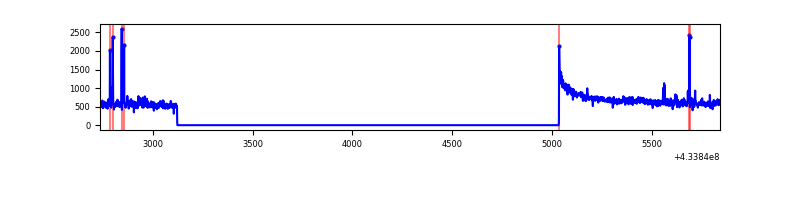 |
| B | 3106 | 1194 | 4 | 4 | 0.13% | 0.34% | 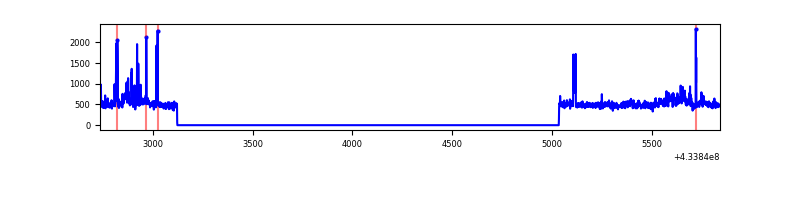 |
| C | 3106 | 1194 | 0 | 0 | 0.00% | 0.00% | 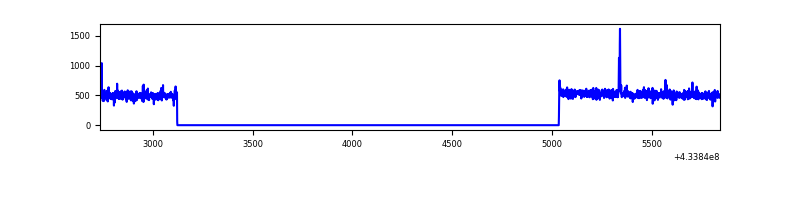 |
| D | 3106 | 1194 | 35 | 35 | 1.13% | 2.93% | 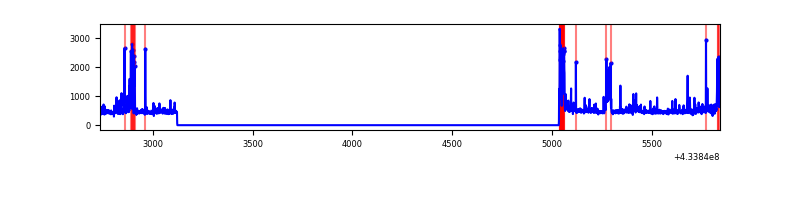 |
Top three noisy pixels from each quadrant. If the there are fewer than three noisy pixels in the level2.evt file, extra rows are filled as -1
| Pixel properties | Quadrant properties | ||||||
|---|---|---|---|---|---|---|---|
| Quadrant | DetID | PixID | Counts | Sigma | Mean | Median | Sigma |
| A | 10 | 83 | 178146 | 5567.1 | 142 | 139 | 32.0 |
| A | 15 | 237 | 22337 | 694.23 | 142 | 139 | 32.0 |
| A | 15 | 223 | 17877 | 554.75 | 142 | 139 | 32.0 |
| B | 5 | 172 | 43082 | 1396.54 | 142 | 138 | 30.8 |
| B | 0 | 190 | 37243 | 1206.66 | 142 | 138 | 30.8 |
| B | 0 | 189 | 16787 | 541.43 | 142 | 138 | 30.8 |
| C | 15 | 214 | 53623 | 1515.75 | 140 | 141 | 35.3 |
| C | 14 | 254 | 7627 | 212.16 | 140 | 141 | 35.3 |
| C | 3 | 233 | 2111 | 55.83 | 140 | 141 | 35.3 |
| D | 13 | 249 | 72070 | 2030.24 | 136 | 131 | 35.4 |
| D | 2 | 249 | 64625 | 1820.13 | 136 | 131 | 35.4 |
| D | 7 | 96 | 17957 | 503.08 | 136 | 131 | 35.4 |
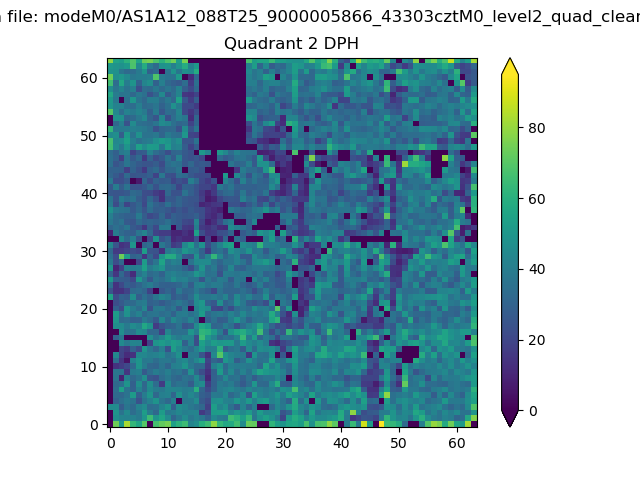
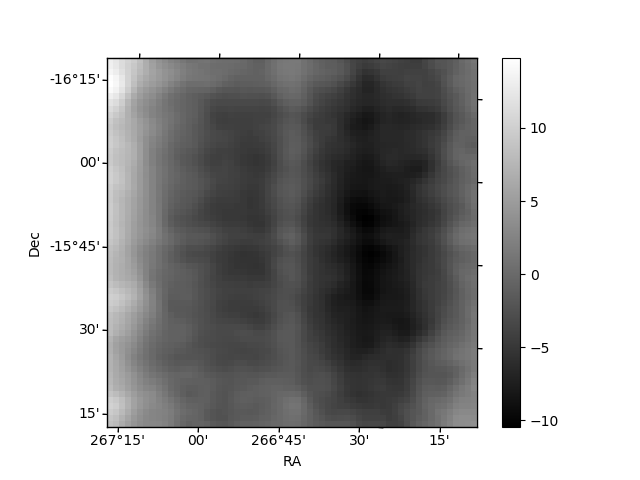
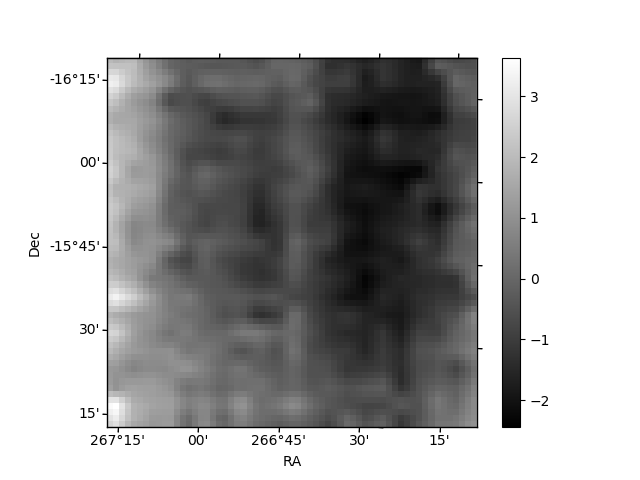
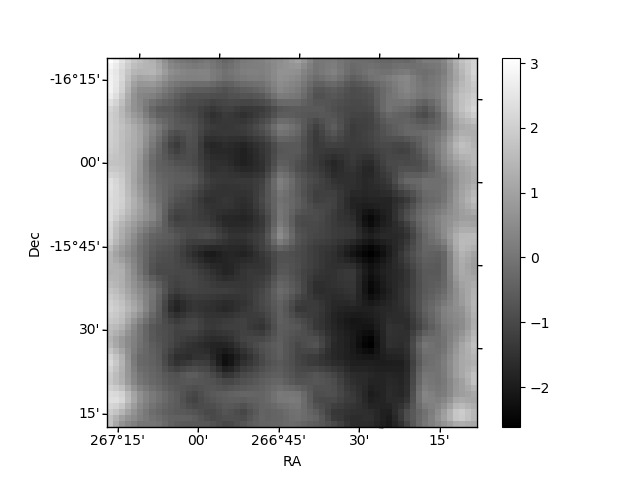
Histogram calculated using DETX and DETY for each event in the final _common_clean file
| Quadrant A | 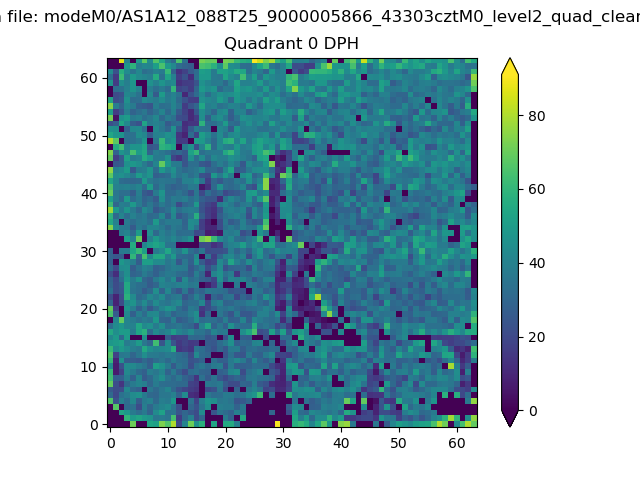 |
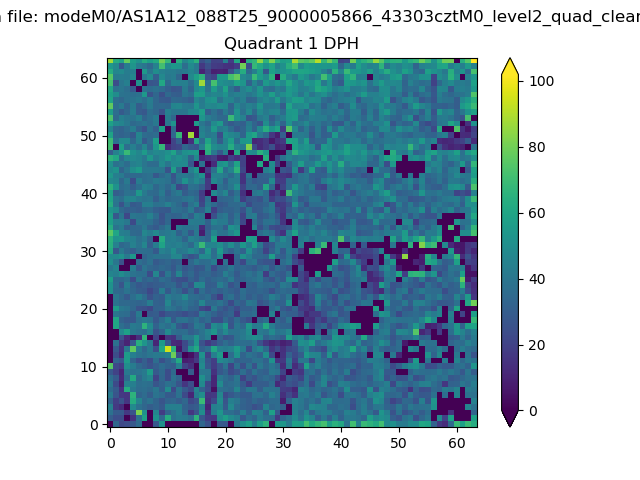 |
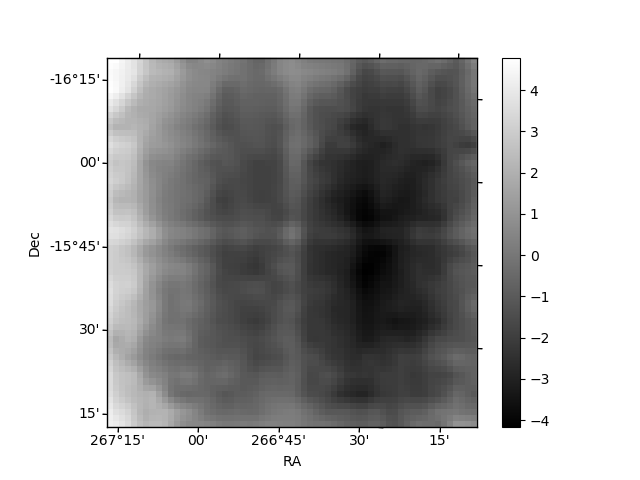
Quadrant B |
|---|---|---|---|
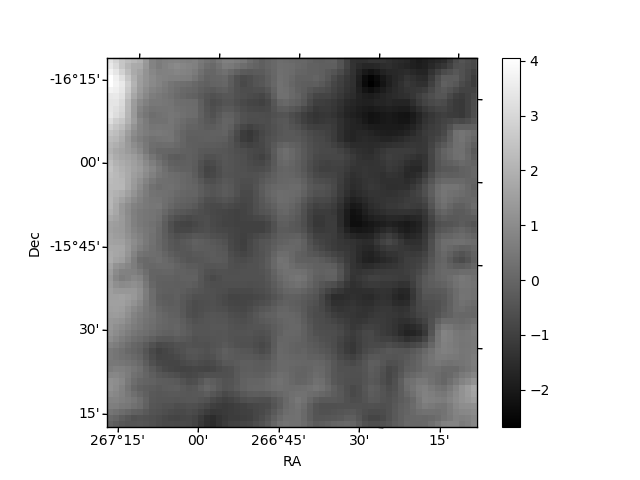
| Quadrant D | 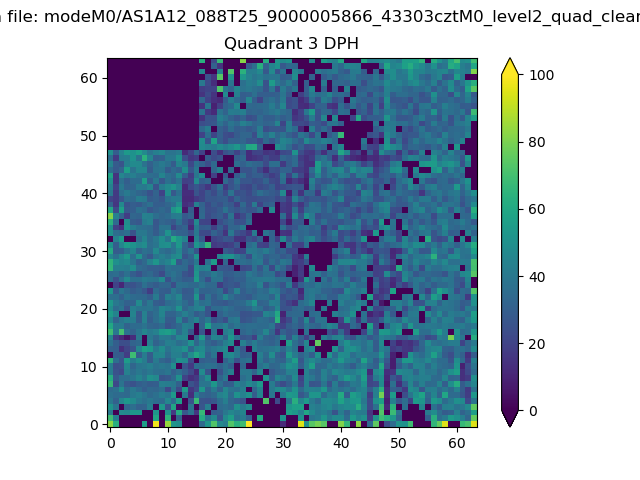 |
 |
Quadrant C |
| Plot type | Count rate plots | Images |
|---|---|---|
| Comparison with Poisson distribution Blue bars denote a histogram of data divided into 1 sec bins. Red curve is a Poisson curve with rate = median count rate of data. |
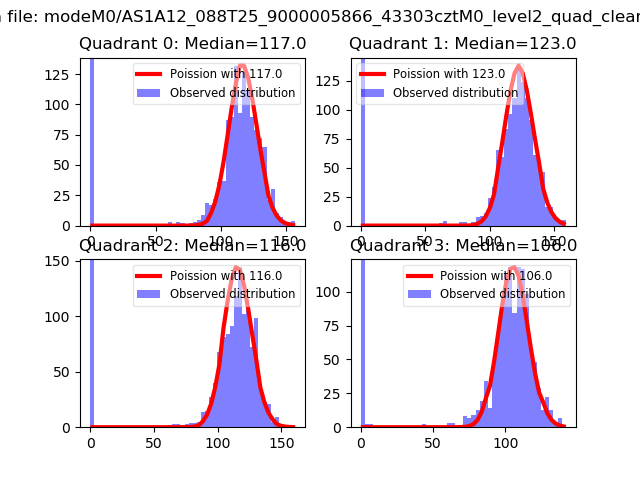 |
 |
| Quadrant-wise count rates Data is divided into 100 sec bins |
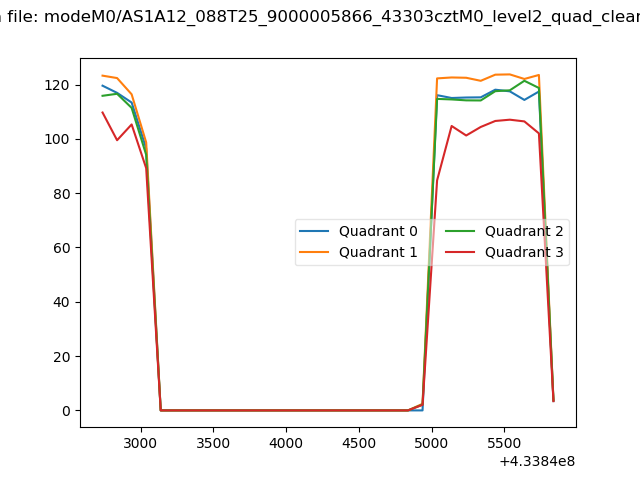 |
|
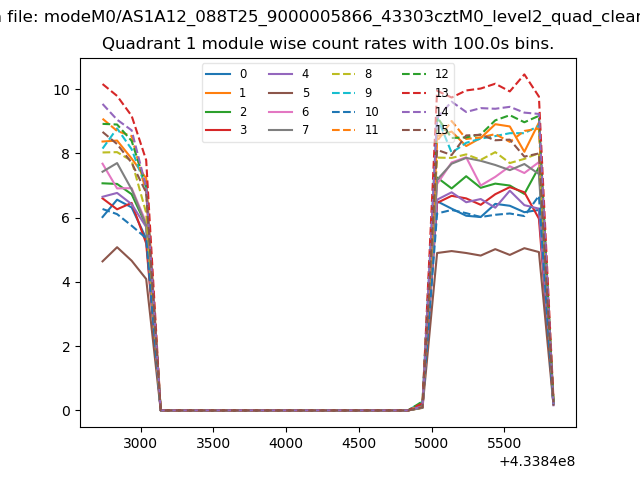
| Module-wise count rates for Quadrant A Data is divided into 100 sec bins |
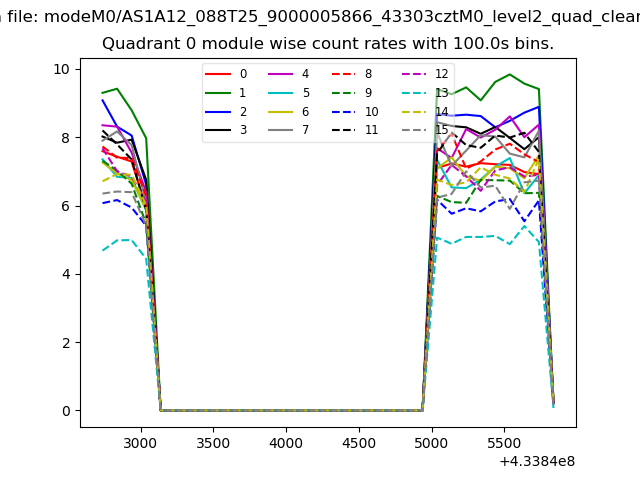 |
 |
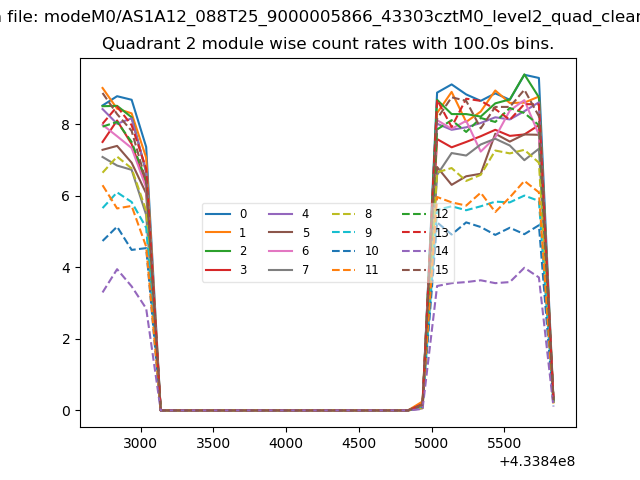
| Module-wise count rates for Quadrant B Data is divided into 100 sec bins |
 |
 |
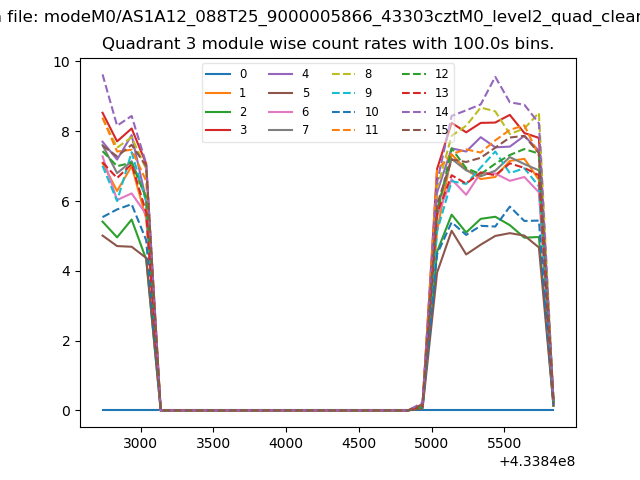
| Module-wise count rates for Quadrant C Data is divided into 100 sec bins |
 |
 |
| Module-wise count rates for Quadrant D Data is divided into 100 sec bins |
 |
 |
| Parameter | Plot |
|---|---|
| CZT HV Monitor | 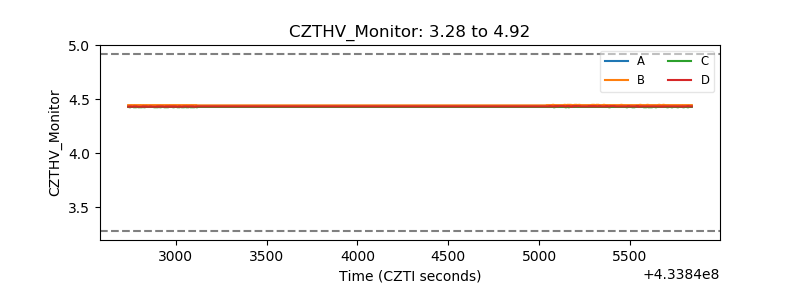 |
| D_VDD | 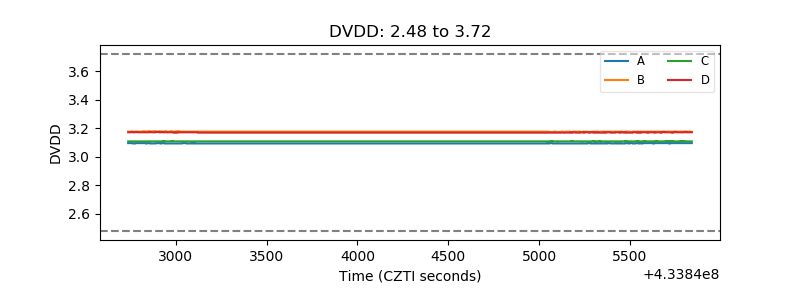 |
| Temperature 1 | 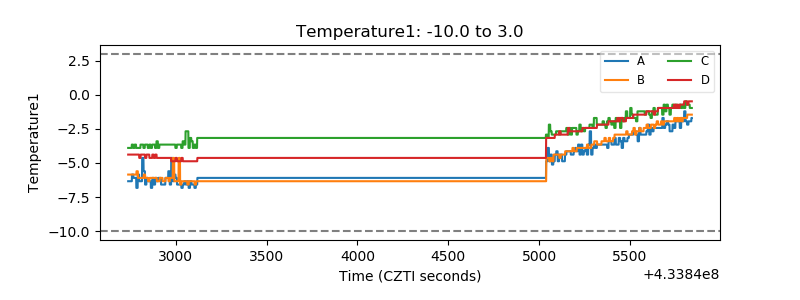 |
| Veto HV Monitor | 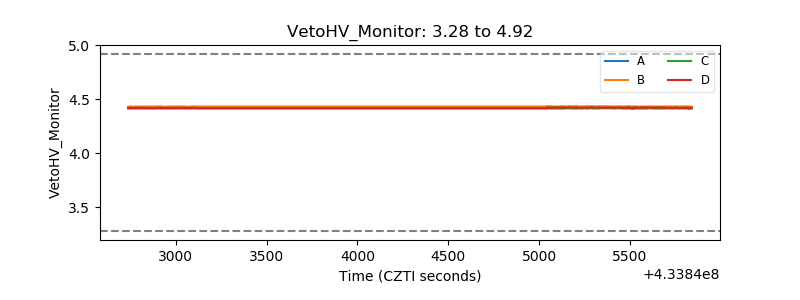 |
| Veto LLD | 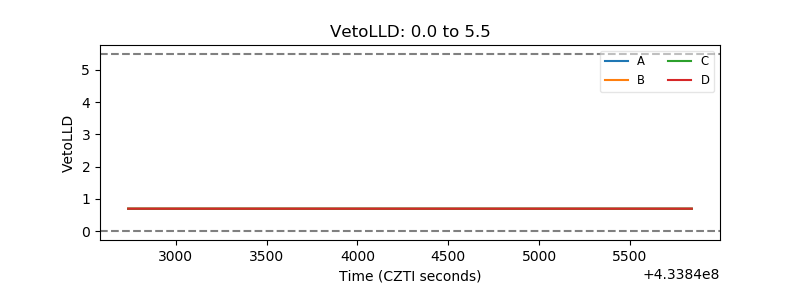 |
| Alpha Counter | 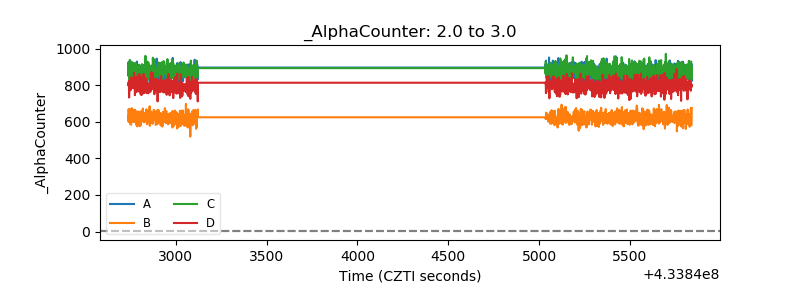 |
| _CPM_Rate | 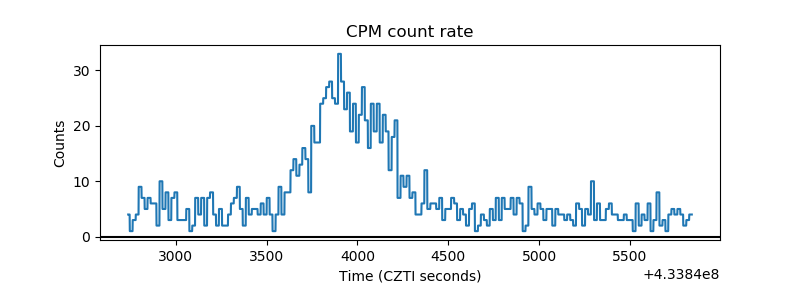 |
| CZT Counter | 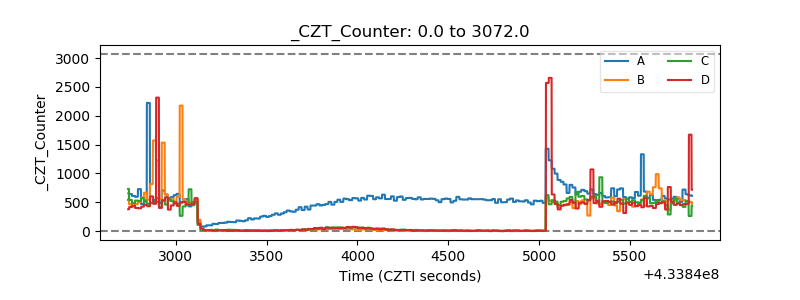 |
| +2.5 Volts monitor | 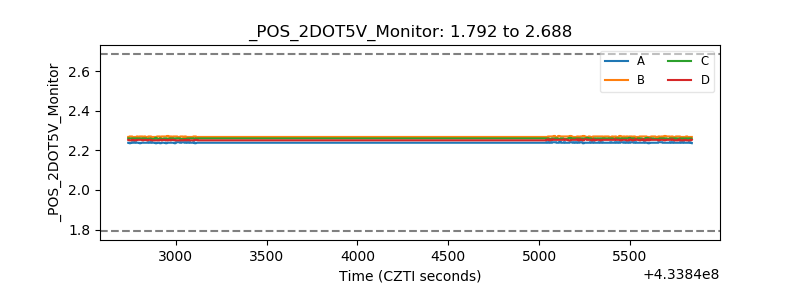 |
| +5 Volts monitor | 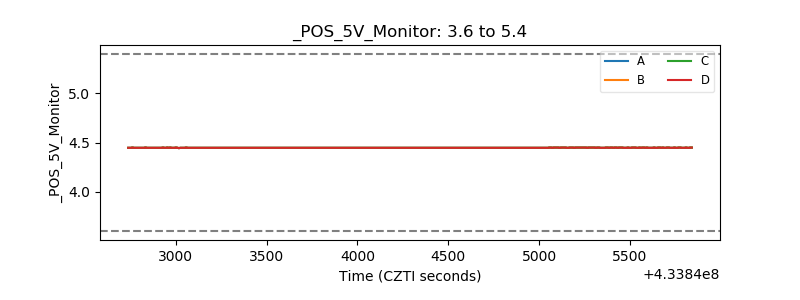 |
| _ROLL_ROT | 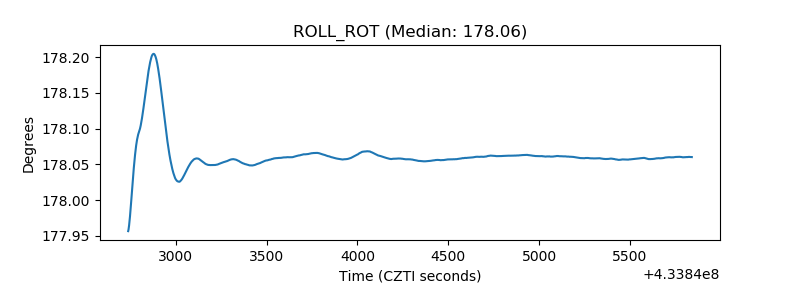 |
| _Roll_DEC | 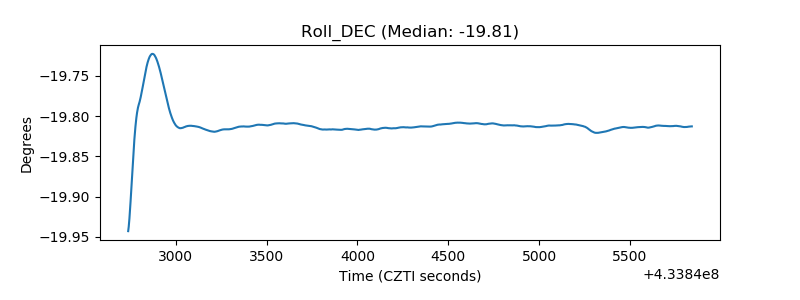 |
| _Roll_RA | 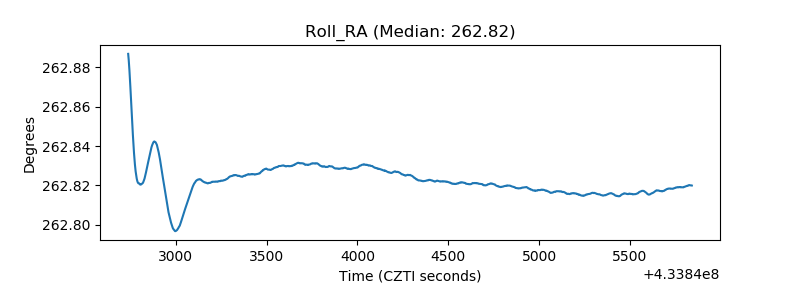 |
| Veto Counter | 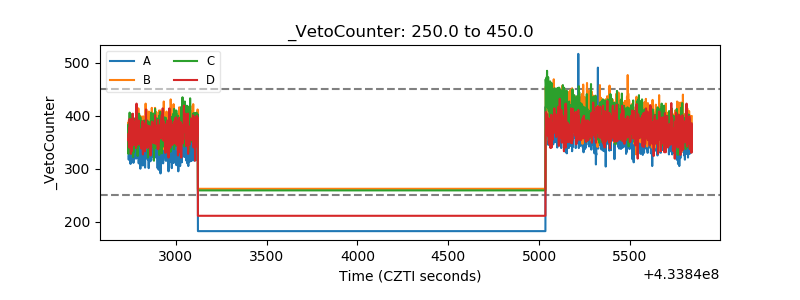 |