| Param | Original file | Final file |
|---|---|---|
| Filename | modeM0/AS1A12_088T25_9000005866_43305cztM0_level2.fits | modeM0/AS1A12_088T25_9000005866_43305cztM0_level2_quad_clean.evt |
| Size (bytes) | 395,343,360 | 95,019,840 |
| Size | 377.0 MB | 90.6 MB |
| Events in quadrant A | 4,172,170 | 623,623 |
| Events in quadrant B | 3,097,903 | 655,506 |
| Events in quadrant C | 2,790,578 | 634,833 |
| Events in quadrant D | 4,127,052 | 561,647 |
| Mode SS | |||
|---|---|---|---|
| Quadrant | BADHDUFLAG | Total packets | Discarded packets |
| A | 0 | 116 | 0 |
| B | 0 | 116 | 0 |
| C | 0 | 116 | 0 |
| D | 0 | 116 | 0 |
| Mode M0 | |||
|---|---|---|---|
| Quadrant | BADHDUFLAG | Total packets | Discarded packets |
| A | 0 | 16010 | 2 |
| B | 0 | 12971 | 2 |
| C | 0 | 11804 | 2 |
| D | 0 | 16214 | 2 |
| Mode M9 | |||
|---|---|---|---|
| Quadrant | BADHDUFLAG | Total packets | Discarded packets |
| A | 0 | 26 | 0 |
| B | 0 | 27 | 0 |
| C | 0 | 27 | 0 |
| D | 0 | 27 | 0 |
| Quadrant | Total seconds | Saturated seconds | Saturation percentage |
|---|---|---|---|
| A | 5743 | 292 | 5.084451% |
| B | 5743 | 99 | 1.723838% |
| C | 5743 | 9 | 0.156713% |
| D | 5743 | 277 | 4.823263% |
Noise dominated data is calculated using 1-second bins in cleaned event files. If a bin has >2000 counts, and if more than 50% of those come from <1% of pixels, then it is considered to be noise-dominated and hence unusable.
| Quadrant | # 1 sec bins | Bins with >0 counts | Bins with >2000 counts | High rate bins dominated by noise | Noise dominated (total time) | Noise dominated (detector-on time) | Marked lightcurve |
|---|---|---|---|---|---|---|---|
| A | 7085 | 5744 | 227 | 227 | 3.20% | 3.95% | 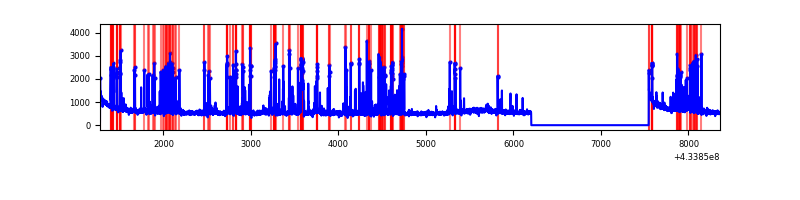 |
| B | 7085 | 5744 | 70 | 70 | 0.99% | 1.22% | 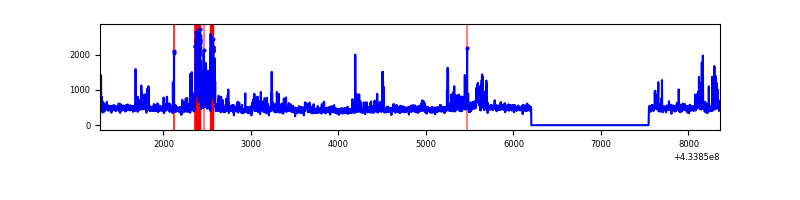 |
| C | 7085 | 5744 | 3 | 3 | 0.04% | 0.05% | 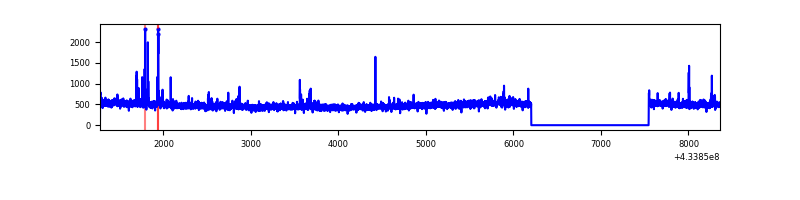 |
| D | 7085 | 5744 | 273 | 273 | 3.85% | 4.75% | 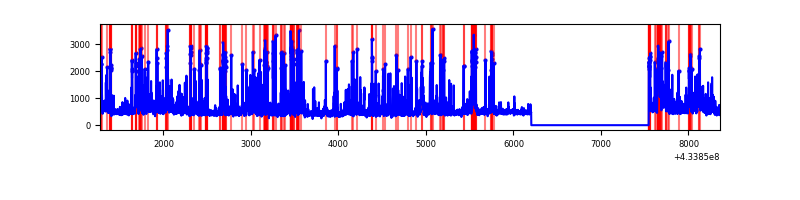 |
Top three noisy pixels from each quadrant. If the there are fewer than three noisy pixels in the level2.evt file, extra rows are filled as -1
| Pixel properties | Quadrant properties | ||||||
|---|---|---|---|---|---|---|---|
| Quadrant | DetID | PixID | Counts | Sigma | Mean | Median | Sigma |
| A | 15 | 237 | 855901 | 6411.89 | 627 | 612 | 133.4 |
| A | 10 | 83 | 650340 | 4870.85 | 627 | 612 | 133.4 |
| A | 15 | 223 | 140668 | 1049.97 | 627 | 612 | 133.4 |
| B | 4 | 67 | 225359 | 1751.44 | 637 | 616 | 128.3 |
| B | 0 | 189 | 116730 | 904.88 | 637 | 616 | 128.3 |
| B | 0 | 190 | 76531 | 591.61 | 637 | 616 | 128.3 |
| C | 15 | 214 | 246805 | 1649.86 | 625 | 628 | 149.2 |
| C | 14 | 254 | 31838 | 209.17 | 625 | 628 | 149.2 |
| C | 3 | 233 | 20440 | 132.78 | 625 | 628 | 149.2 |
| D | 1 | 52 | 850214 | 5474.57 | 613 | 594 | 155.2 |
| D | 2 | 249 | 308987 | 1987.15 | 613 | 594 | 155.2 |
| D | 1 | 47 | 216542 | 1391.47 | 613 | 594 | 155.2 |
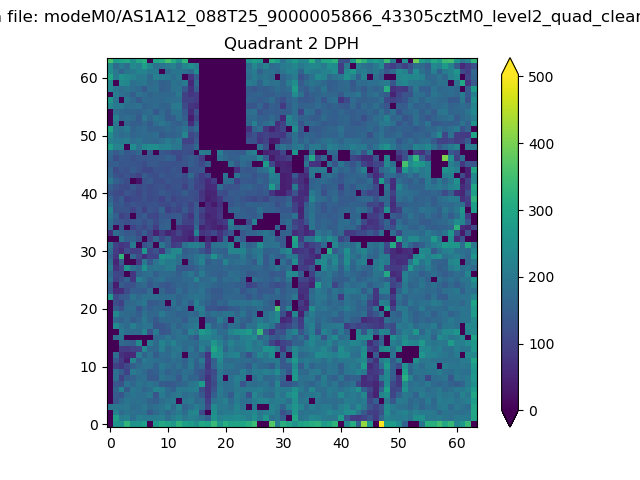
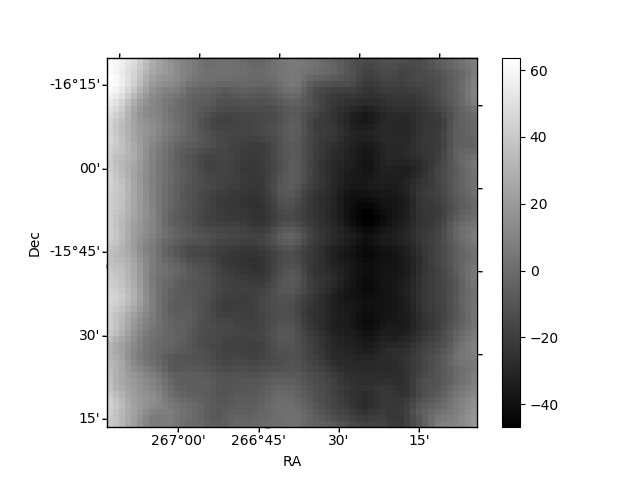
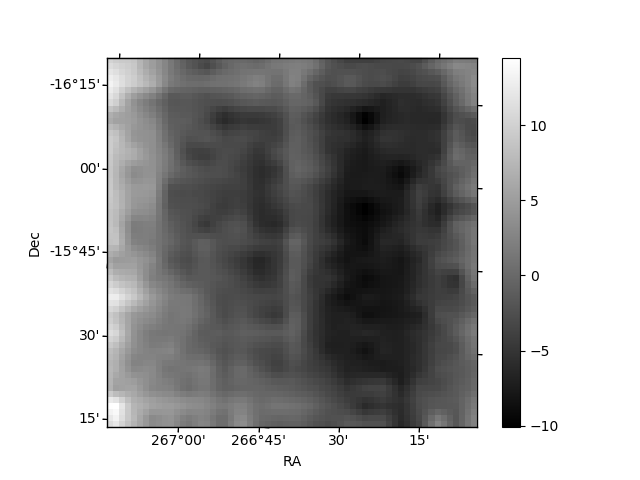
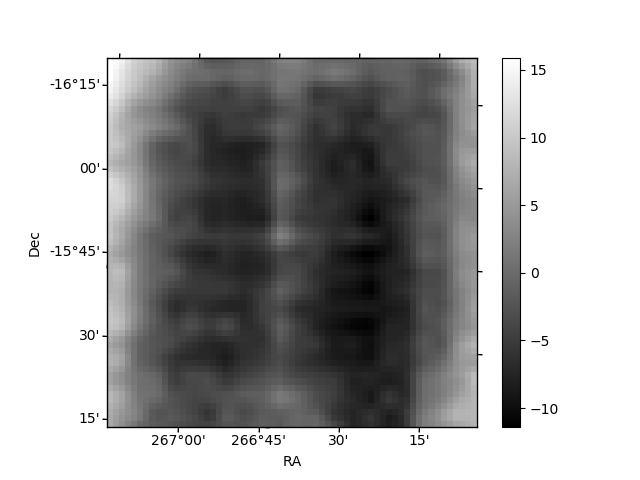
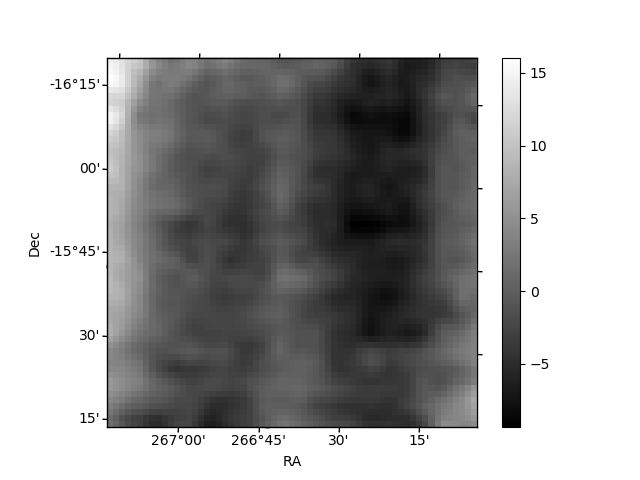
Histogram calculated using DETX and DETY for each event in the final _common_clean file
| Quadrant A | 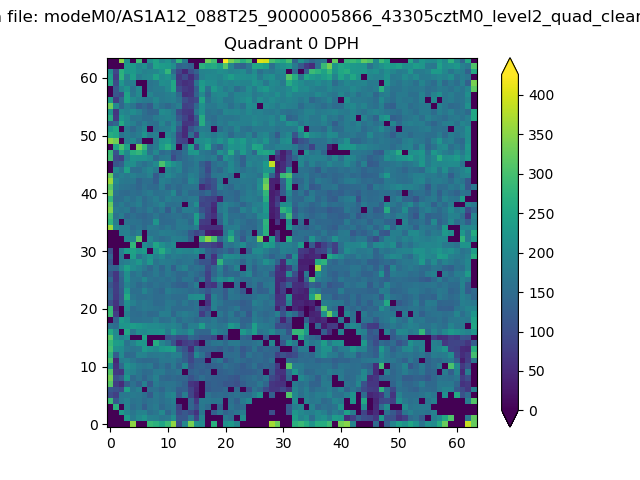 |
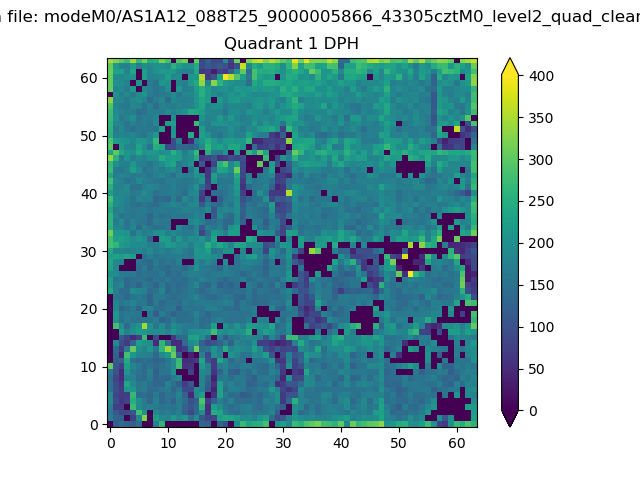 |
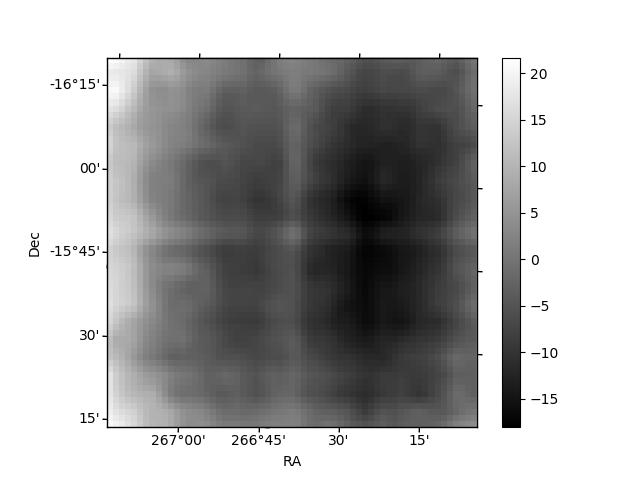
Quadrant B |
|---|---|---|---|
| Quadrant D | 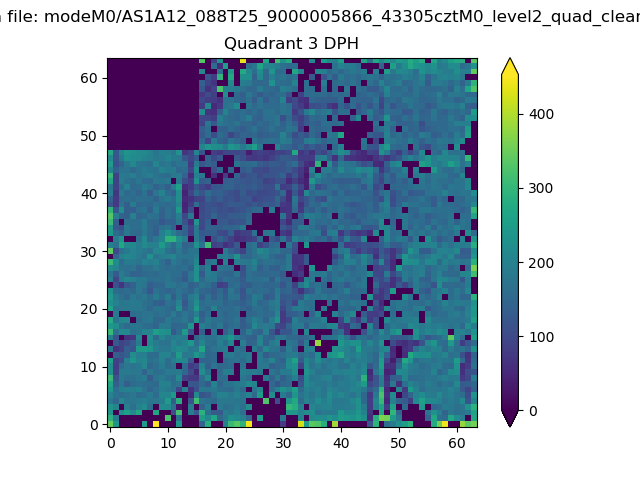 |
 |
Quadrant C |
| Plot type | Count rate plots | Images |
|---|---|---|
| Comparison with Poisson distribution Blue bars denote a histogram of data divided into 1 sec bins. Red curve is a Poisson curve with rate = median count rate of data. |
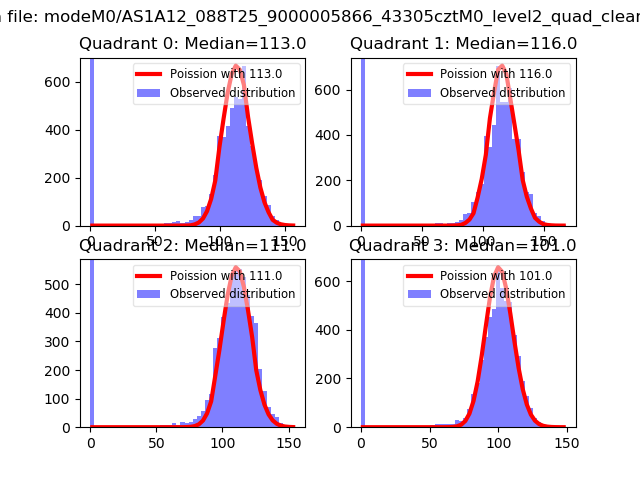 |
 |
| Quadrant-wise count rates Data is divided into 100 sec bins |
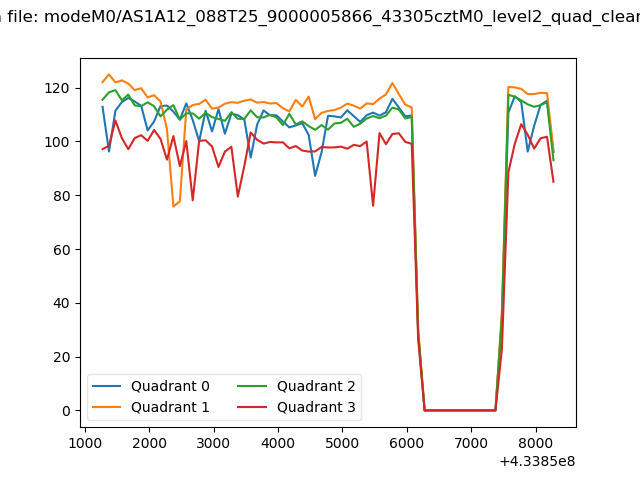 |
|
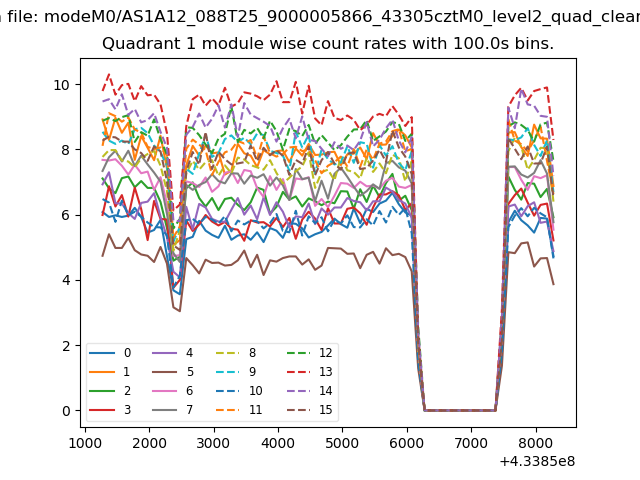
| Module-wise count rates for Quadrant A Data is divided into 100 sec bins |
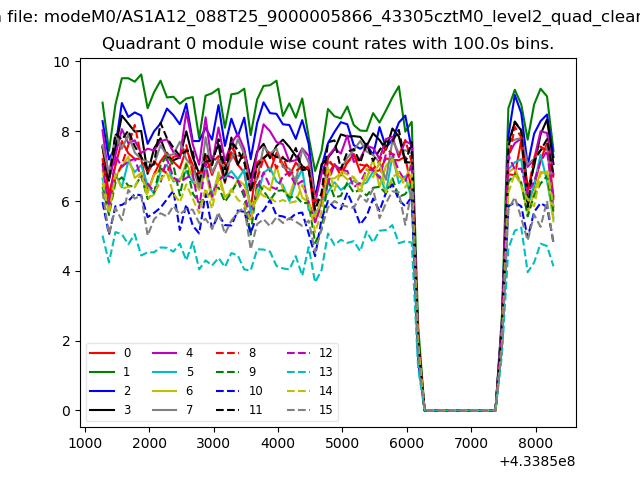 |
 |
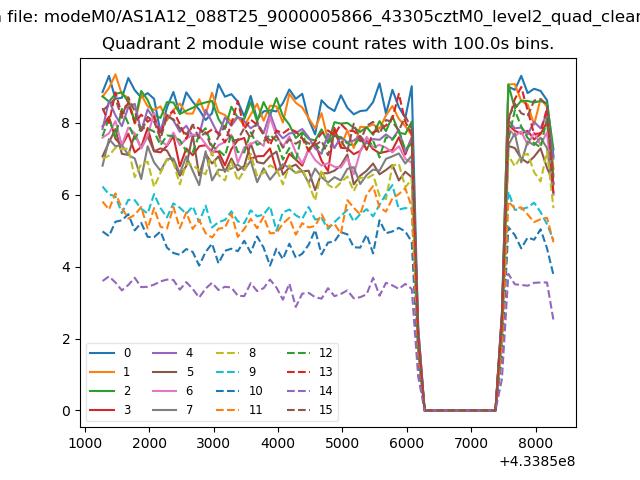
| Module-wise count rates for Quadrant B Data is divided into 100 sec bins |
 |
 |
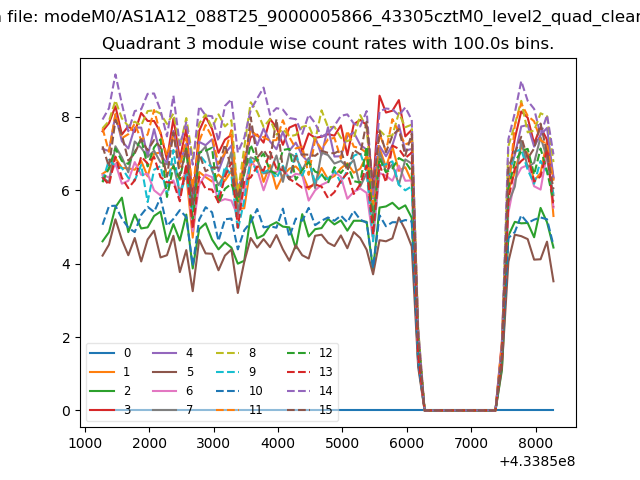
| Module-wise count rates for Quadrant C Data is divided into 100 sec bins |
 |
 |
| Module-wise count rates for Quadrant D Data is divided into 100 sec bins |
 |
 |
| Parameter | Plot |
|---|---|
| CZT HV Monitor | 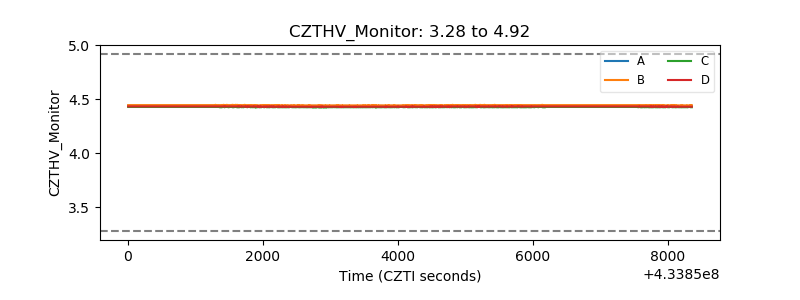 |
| D_VDD | 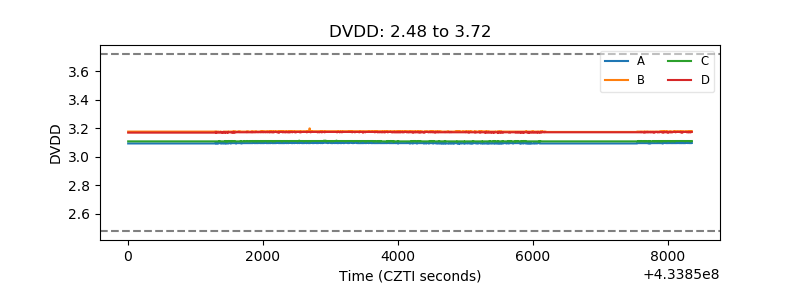 |
| Temperature 1 | 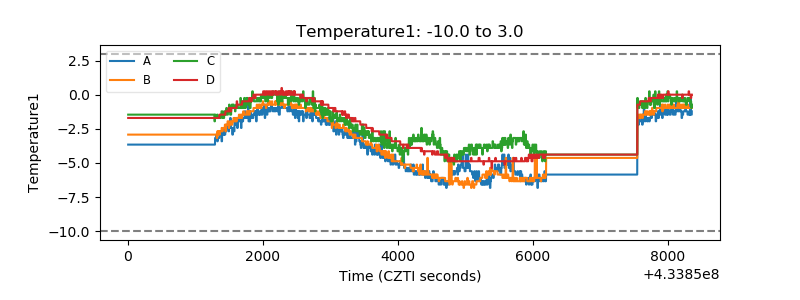 |
| Veto HV Monitor | 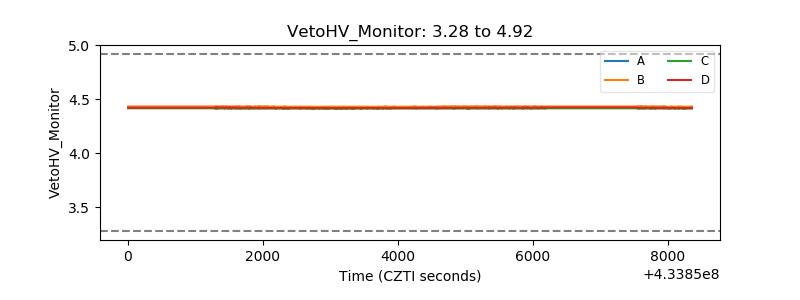 |
| Veto LLD | 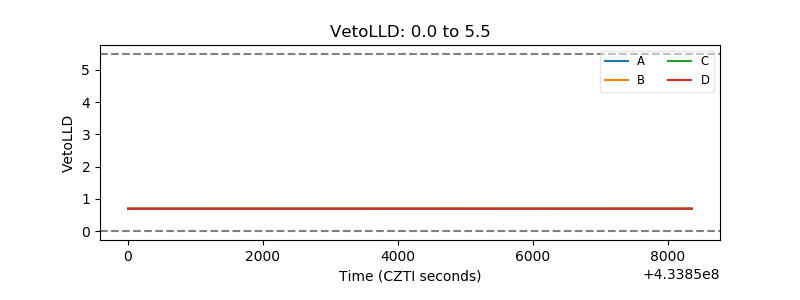 |
| Alpha Counter | 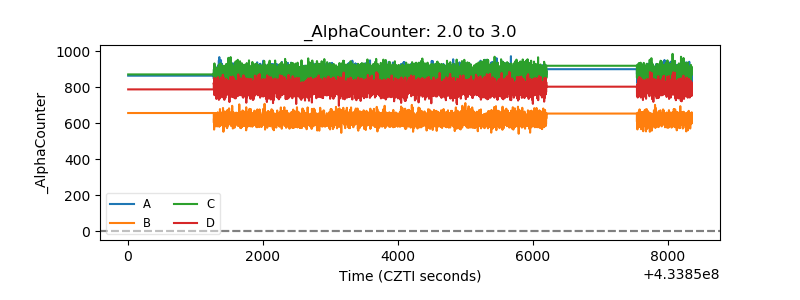 |
| _CPM_Rate | 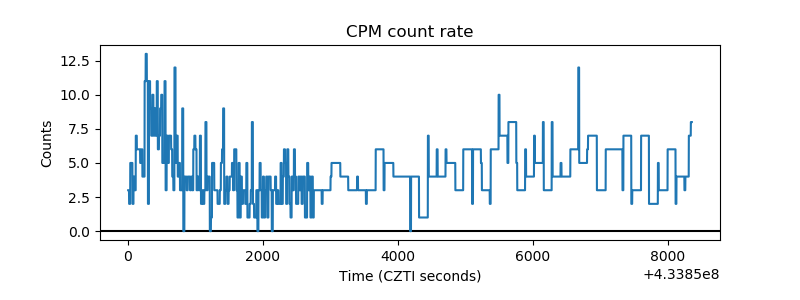 |
| CZT Counter | 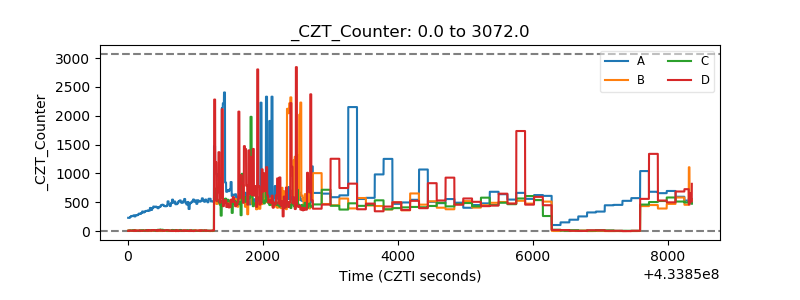 |
| +2.5 Volts monitor | 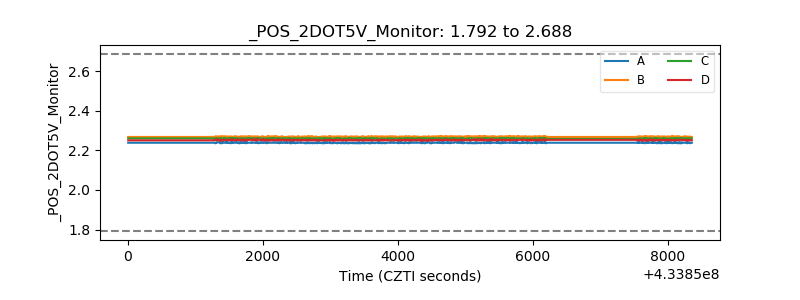 |
| +5 Volts monitor | 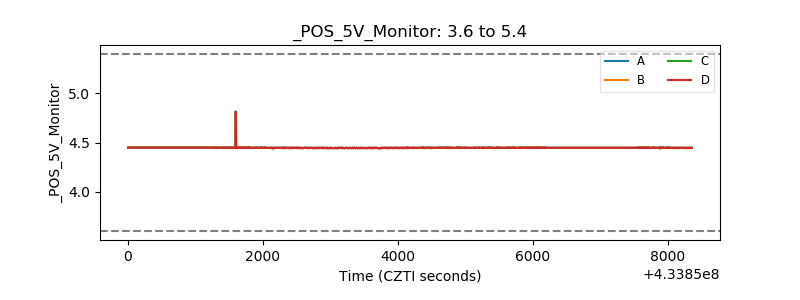 |
| _ROLL_ROT | 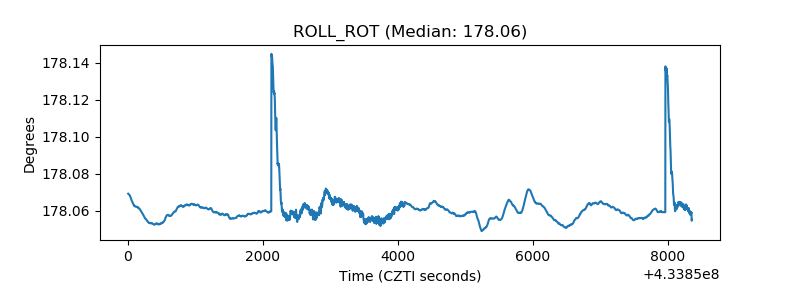 |
| _Roll_DEC | 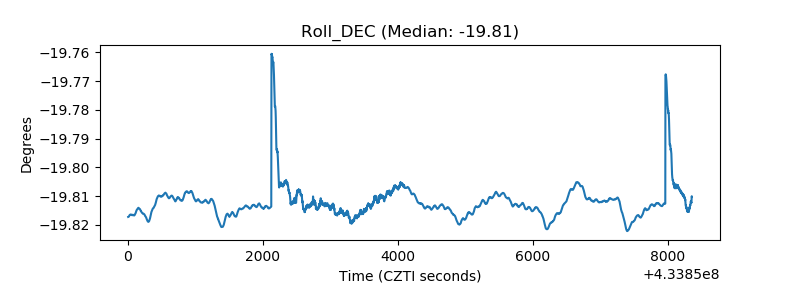 |
| _Roll_RA | 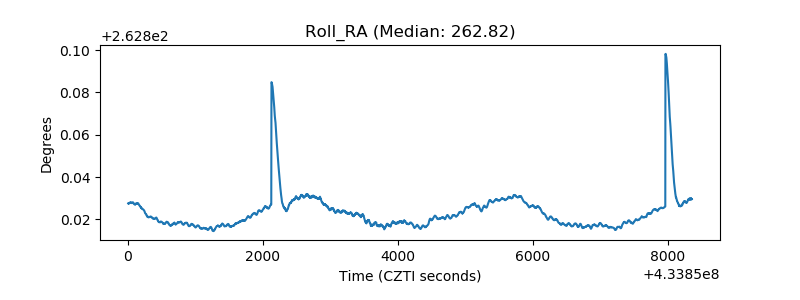 |
| Veto Counter | 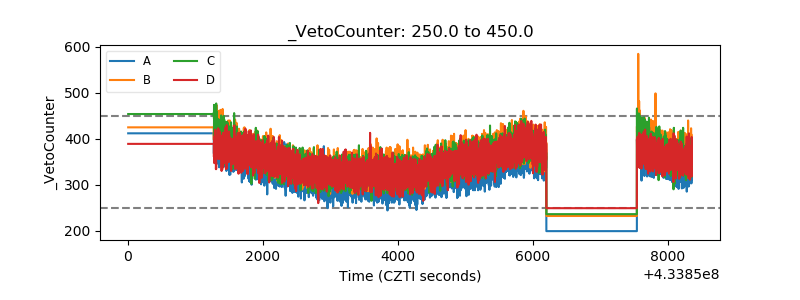 |