| Param | Original file | Final file |
|---|---|---|
| Filename | modeM0/AS1A12_088T25_9000005866_43306cztM0_level2.fits | modeM0/AS1A12_088T25_9000005866_43306cztM0_level2_quad_clean.evt |
| Size (bytes) | 402,102,720 | 98,968,320 |
| Size | 383.5 MB | 94.4 MB |
| Events in quadrant A | 4,124,848 | 654,514 |
| Events in quadrant B | 3,094,181 | 684,705 |
| Events in quadrant C | 3,253,681 | 652,658 |
| Events in quadrant D | 3,945,308 | 585,977 |
| Mode SS | |||
|---|---|---|---|
| Quadrant | BADHDUFLAG | Total packets | Discarded packets |
| A | 0 | 120 | 0 |
| B | 0 | 120 | 0 |
| C | 0 | 120 | 0 |
| D | 0 | 120 | 0 |
| Mode M0 | |||
|---|---|---|---|
| Quadrant | BADHDUFLAG | Total packets | Discarded packets |
| A | 0 | 16013 | 3 |
| B | 0 | 13077 | 2 |
| C | 0 | 13299 | 2 |
| D | 0 | 15938 | 2 |
| Mode M9 | |||
|---|---|---|---|
| Quadrant | BADHDUFLAG | Total packets | Discarded packets |
| A | 0 | 17 | 0 |
| B | 0 | 18 | 0 |
| C | 0 | 18 | 0 |
| D | 0 | 18 | 0 |
| Quadrant | Total seconds | Saturated seconds | Saturation percentage |
|---|---|---|---|
| A | 5999 | 231 | 3.850642% |
| B | 5999 | 32 | 0.533422% |
| C | 5999 | 46 | 0.766794% |
| D | 5999 | 255 | 4.250708% |
Noise dominated data is calculated using 1-second bins in cleaned event files. If a bin has >2000 counts, and if more than 50% of those come from <1% of pixels, then it is considered to be noise-dominated and hence unusable.
| Quadrant | # 1 sec bins | Bins with >0 counts | Bins with >2000 counts | High rate bins dominated by noise | Noise dominated (total time) | Noise dominated (detector-on time) | Marked lightcurve |
|---|---|---|---|---|---|---|---|
| A | 7312 | 6000 | 170 | 170 | 2.32% | 2.83% | 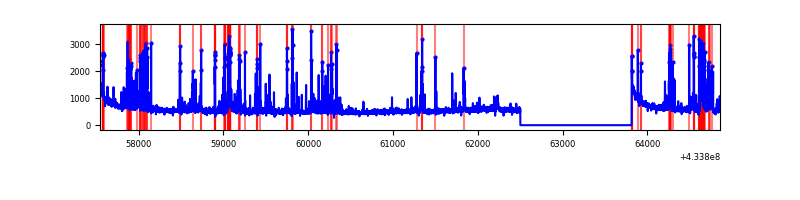 |
| B | 7312 | 6000 | 19 | 19 | 0.26% | 0.32% | 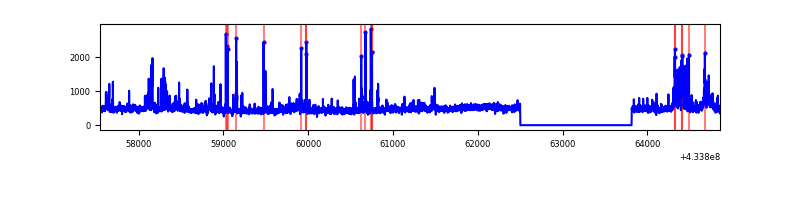 |
| C | 7312 | 6000 | 54 | 54 | 0.74% | 0.90% | 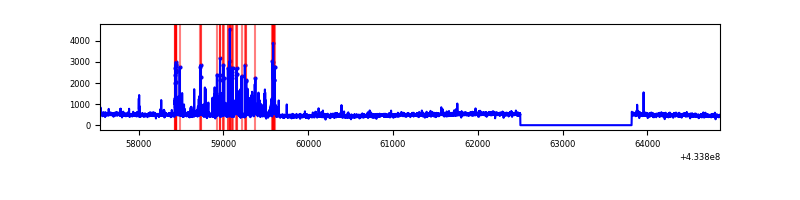 |
| D | 7312 | 6000 | 249 | 249 | 3.41% | 4.15% | 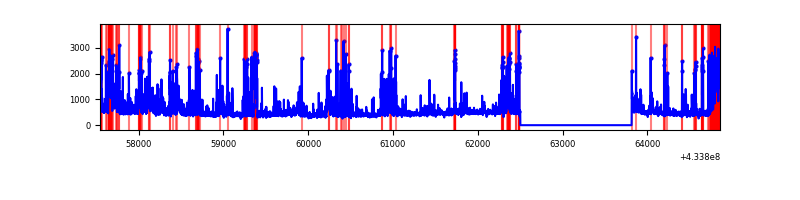 |
Top three noisy pixels from each quadrant. If the there are fewer than three noisy pixels in the level2.evt file, extra rows are filled as -1
| Pixel properties | Quadrant properties | ||||||
|---|---|---|---|---|---|---|---|
| Quadrant | DetID | PixID | Counts | Sigma | Mean | Median | Sigma |
| A | 10 | 83 | 685167 | 4899.96 | 658 | 643 | 139.7 |
| A | 15 | 237 | 663885 | 4747.62 | 658 | 643 | 139.7 |
| A | 15 | 223 | 90968 | 646.56 | 658 | 643 | 139.7 |
| B | 0 | 186 | 153709 | 1156.36 | 665 | 645 | 132.4 |
| B | 0 | 245 | 136214 | 1024.19 | 665 | 645 | 132.4 |
| B | 0 | 190 | 68965 | 516.14 | 665 | 645 | 132.4 |
| C | 15 | 111 | 396230 | 2559.22 | 646 | 649 | 154.6 |
| C | 15 | 214 | 254914 | 1644.98 | 646 | 649 | 154.6 |
| C | 3 | 233 | 30337 | 192.07 | 646 | 649 | 154.6 |
| D | 1 | 52 | 450227 | 2811.58 | 639 | 619 | 159.9 |
| D | 10 | 118 | 253599 | 1581.99 | 639 | 619 | 159.9 |
| D | 2 | 249 | 178700 | 1113.61 | 639 | 619 | 159.9 |
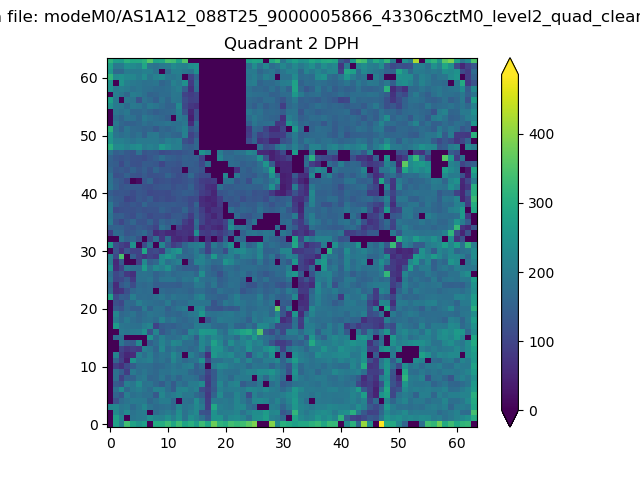
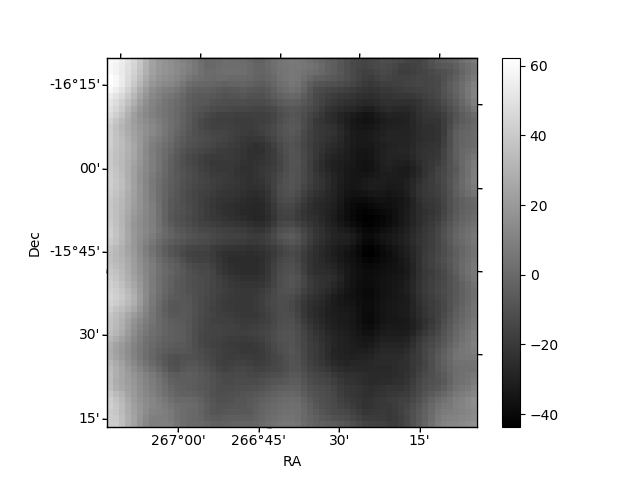
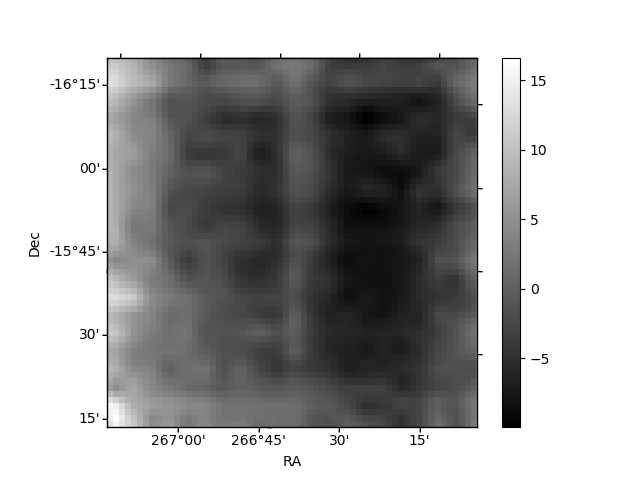
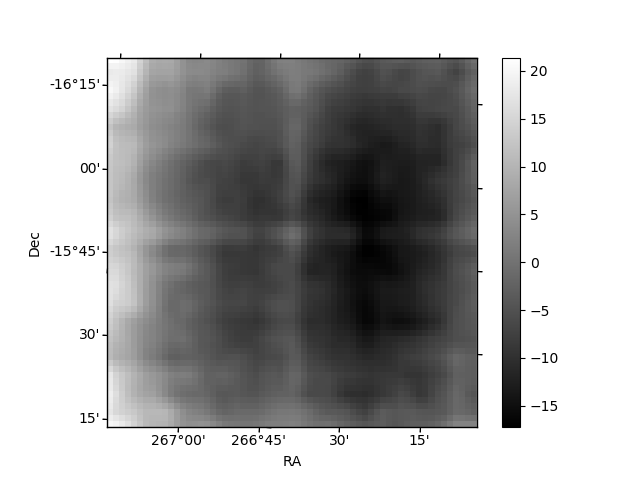
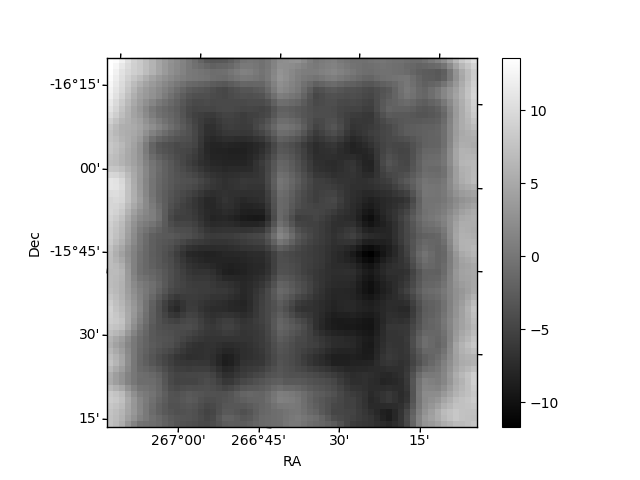
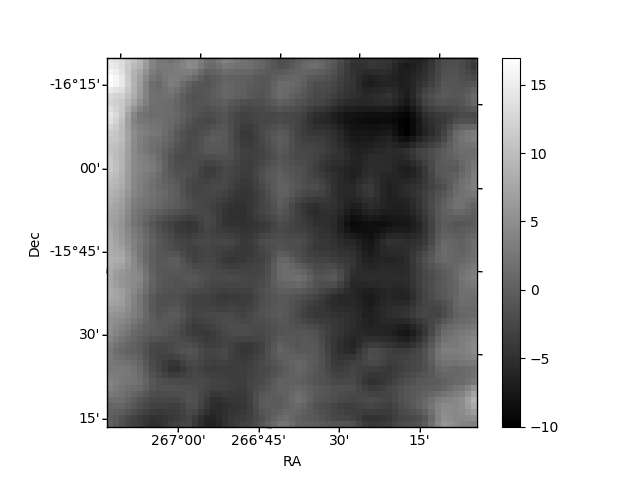
Histogram calculated using DETX and DETY for each event in the final _common_clean file
| Quadrant A | 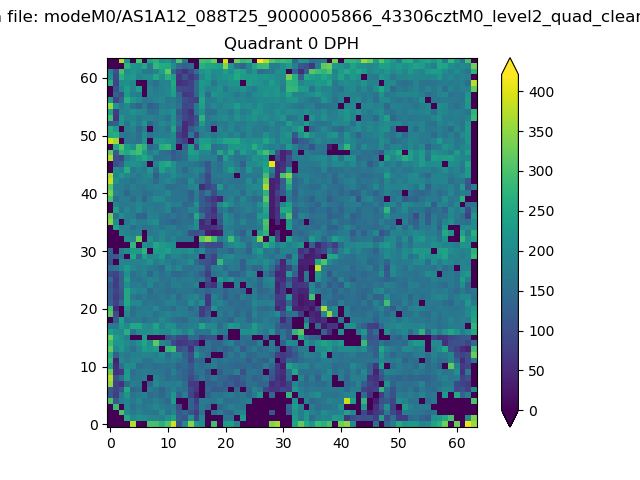 |
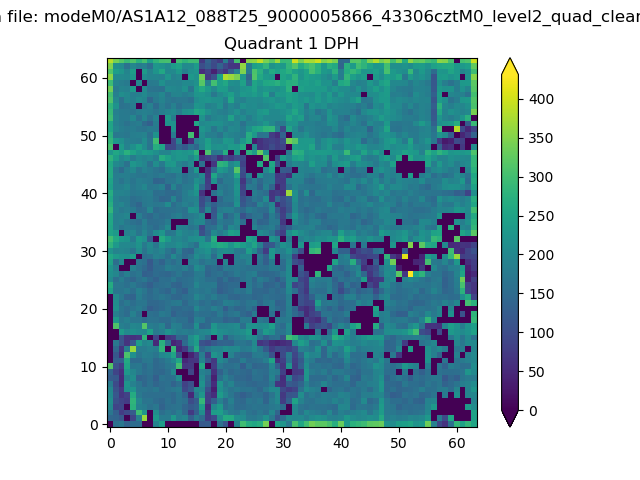 |
Quadrant B |
|---|---|---|---|
| Quadrant D | 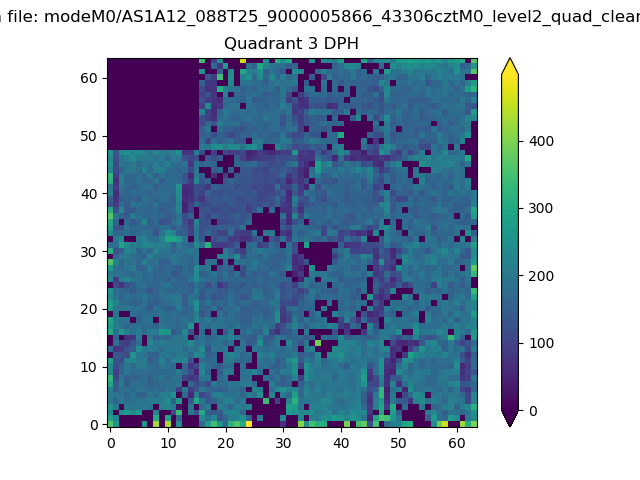 |
 |
Quadrant C |
| Plot type | Count rate plots | Images |
|---|---|---|
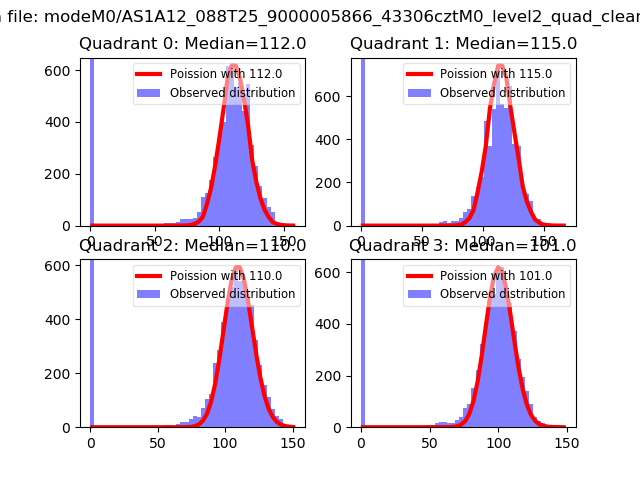
| Comparison with Poisson distribution Blue bars denote a histogram of data divided into 1 sec bins. Red curve is a Poisson curve with rate = median count rate of data. |
 |
 |
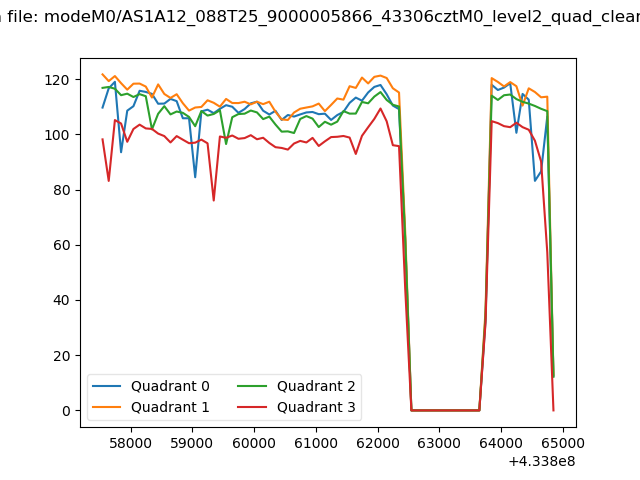
| Quadrant-wise count rates Data is divided into 100 sec bins |
 |
|
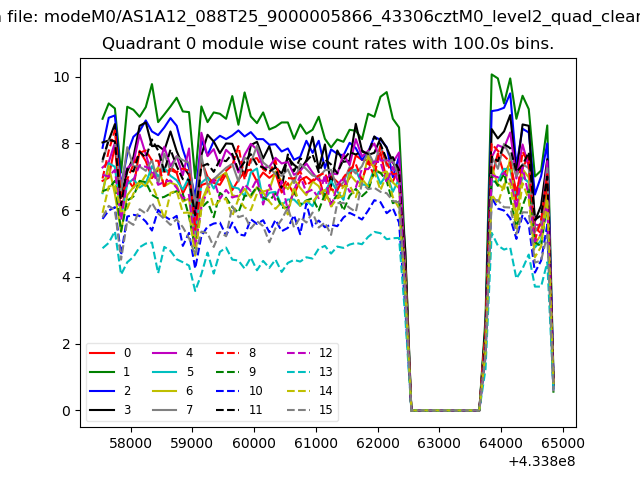
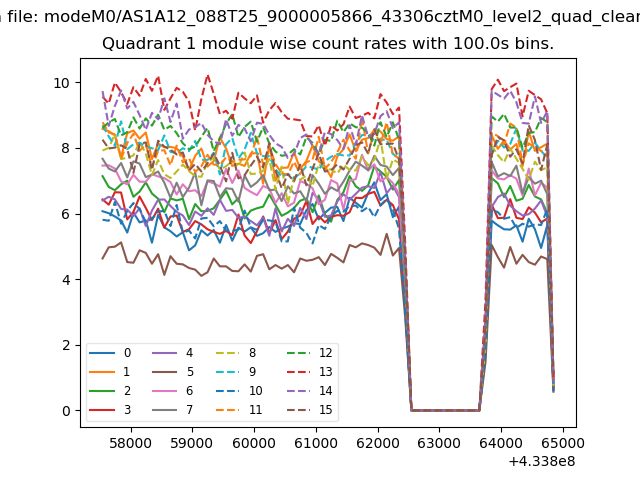
| Module-wise count rates for Quadrant A Data is divided into 100 sec bins |
 |
 |
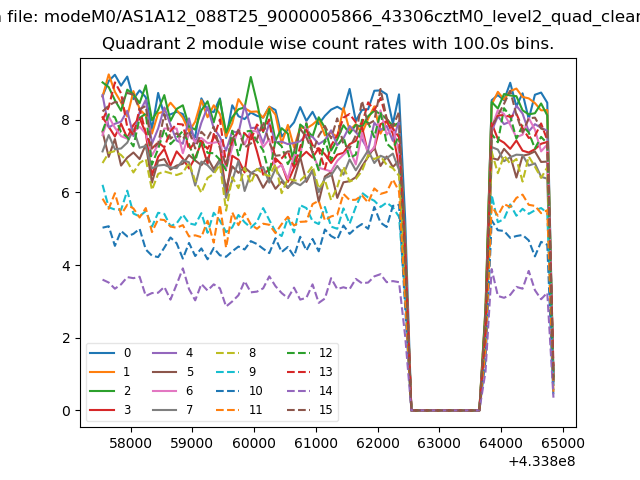
| Module-wise count rates for Quadrant B Data is divided into 100 sec bins |
 |
 |
| Module-wise count rates for Quadrant C Data is divided into 100 sec bins |
 |
 |
| Module-wise count rates for Quadrant D Data is divided into 100 sec bins |
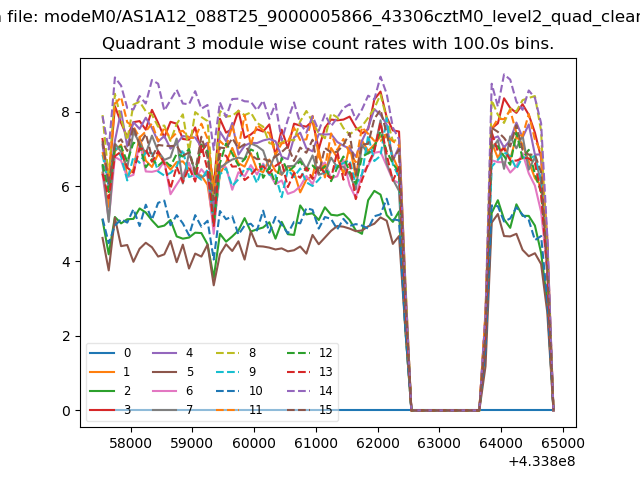 |
 |
| Parameter | Plot |
|---|---|
| CZT HV Monitor | 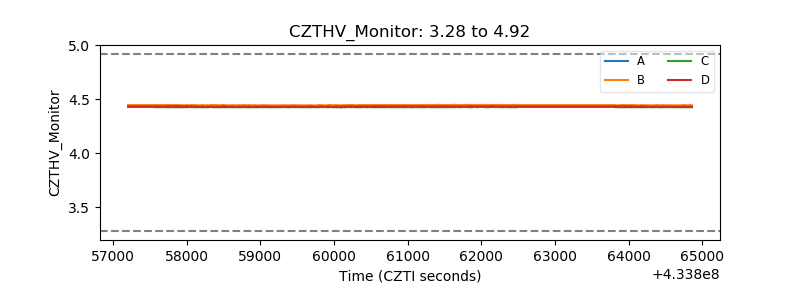 |
| D_VDD | 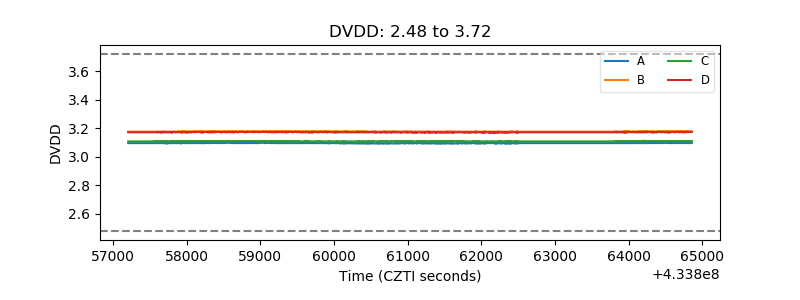 |
| Temperature 1 | 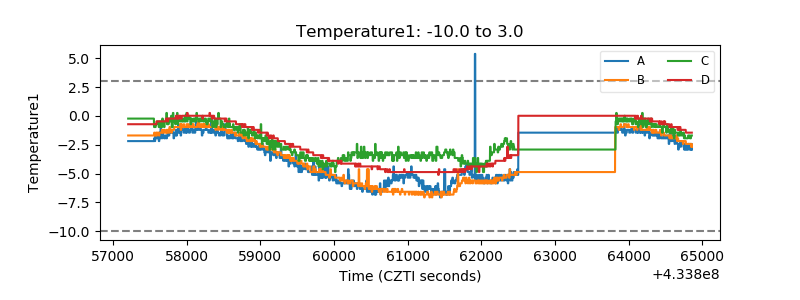 |
| Veto HV Monitor | 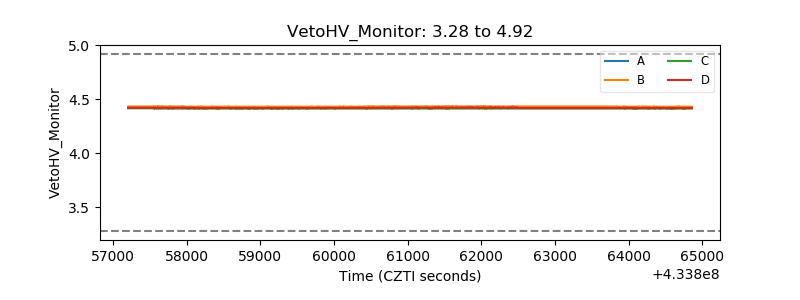 |
| Veto LLD | 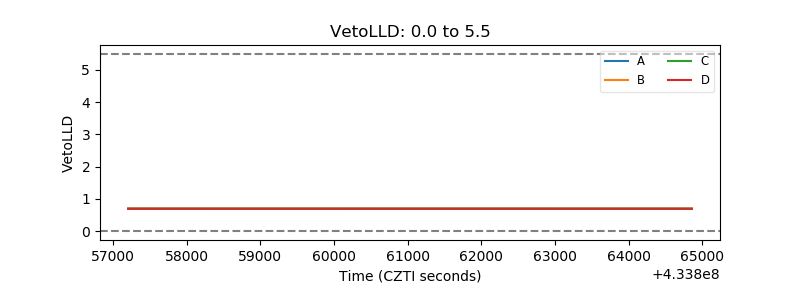 |
| Alpha Counter | 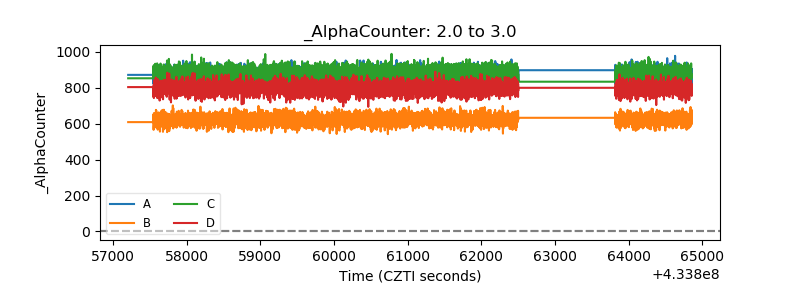 |
| _CPM_Rate | 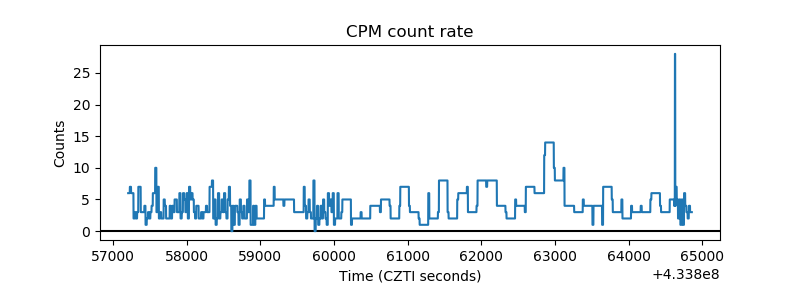 |
| CZT Counter | 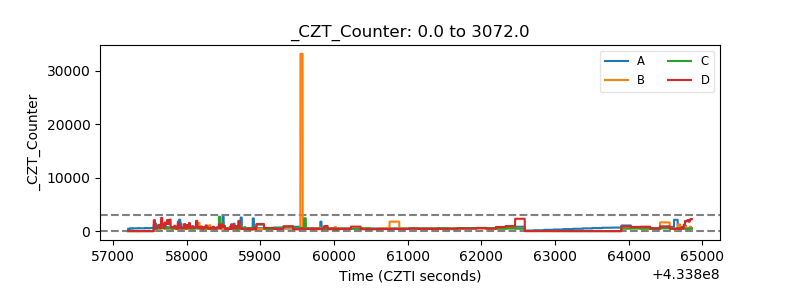 |
| +2.5 Volts monitor |  |
| +5 Volts monitor | 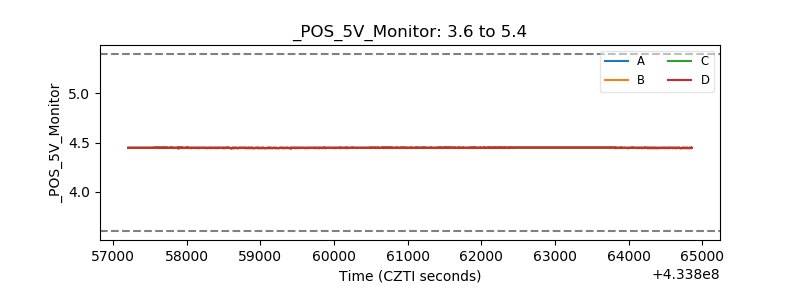 |
| _ROLL_ROT | 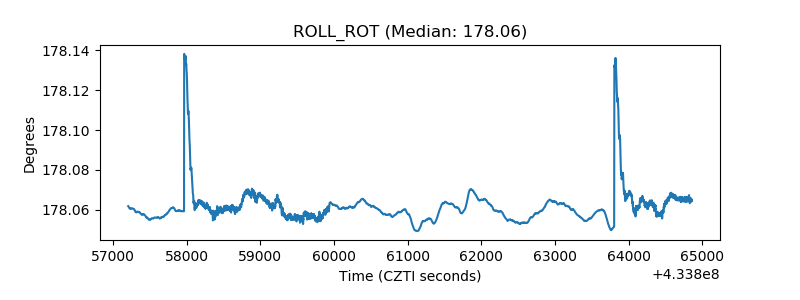 |
| _Roll_DEC | 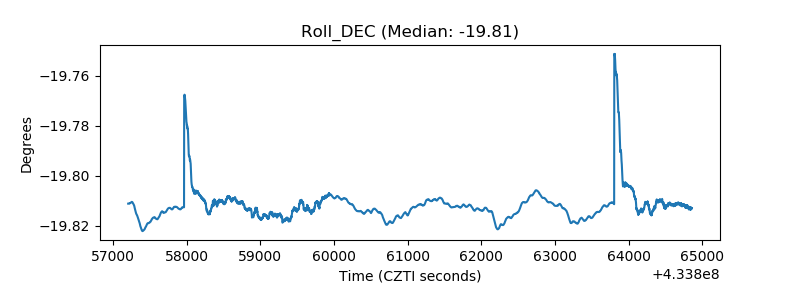 |
| _Roll_RA | 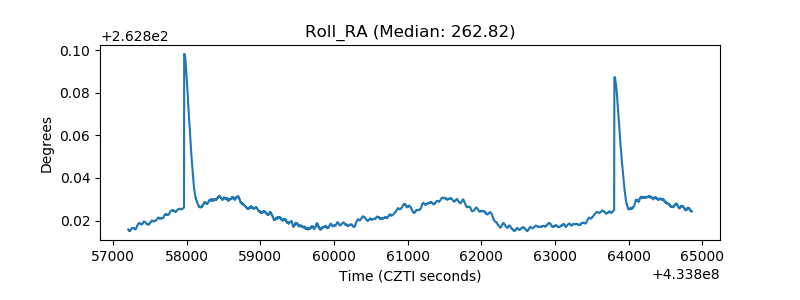 |
| Veto Counter | 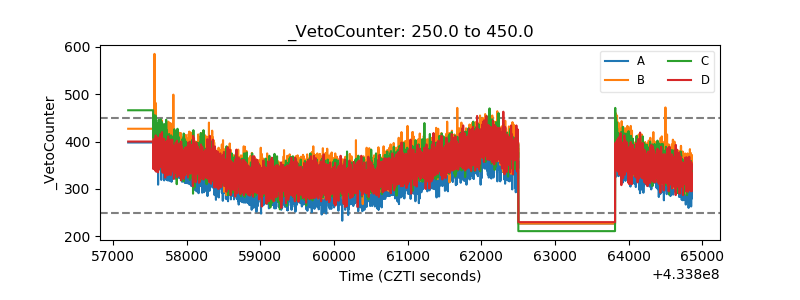 |