| Param | Original file | Final file |
|---|---|---|
| Filename | modeM0/AS1A12_088T25_9000005866_43309cztM0_level2.fits | modeM0/AS1A12_088T25_9000005866_43309cztM0_level2_quad_clean.evt |
| Size (bytes) | 346,173,120 | 92,914,560 |
| Size | 330.1 MB | 88.6 MB |
| Events in quadrant A | 3,699,538 | 611,934 |
| Events in quadrant B | 2,601,392 | 642,419 |
| Events in quadrant C | 2,835,785 | 609,339 |
| Events in quadrant D | 3,236,568 | 553,519 |
| Mode SS | |||
|---|---|---|---|
| Quadrant | BADHDUFLAG | Total packets | Discarded packets |
| A | 0 | 116 | 0 |
| B | 0 | 116 | 0 |
| C | 0 | 116 | 0 |
| D | 0 | 116 | 0 |
| Mode M0 | |||
|---|---|---|---|
| Quadrant | BADHDUFLAG | Total packets | Discarded packets |
| A | 0 | 14595 | 2 |
| B | 0 | 11605 | 2 |
| C | 0 | 11996 | 2 |
| D | 0 | 13695 | 2 |
| Mode M9 | |||
|---|---|---|---|
| Quadrant | BADHDUFLAG | Total packets | Discarded packets |
| A | 0 | 27 | 0 |
| B | 0 | 28 | 0 |
| C | 0 | 28 | 0 |
| D | 0 | 28 | 0 |
| Quadrant | Total seconds | Saturated seconds | Saturation percentage |
|---|---|---|---|
| A | 5659 | 185 | 3.269129% |
| B | 5659 | 17 | 0.300406% |
| C | 5659 | 31 | 0.547800% |
| D | 5659 | 140 | 2.473935% |
Noise dominated data is calculated using 1-second bins in cleaned event files. If a bin has >2000 counts, and if more than 50% of those come from <1% of pixels, then it is considered to be noise-dominated and hence unusable.
| Quadrant | # 1 sec bins | Bins with >0 counts | Bins with >2000 counts | High rate bins dominated by noise | Noise dominated (total time) | Noise dominated (detector-on time) | Marked lightcurve |
|---|---|---|---|---|---|---|---|
| A | 7212 | 5660 | 129 | 129 | 1.79% | 2.28% | 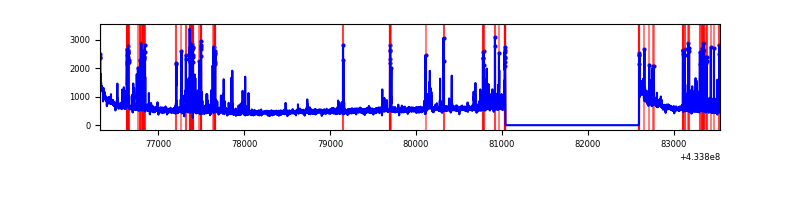 |
| B | 7212 | 5660 | 4 | 4 | 0.06% | 0.07% | 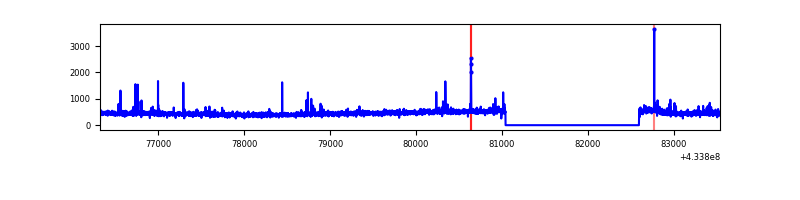 |
| C | 7212 | 5660 | 25 | 25 | 0.35% | 0.44% | 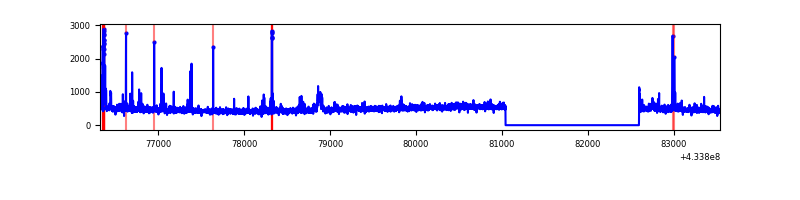 |
| D | 7212 | 5660 | 148 | 148 | 2.05% | 2.61% | 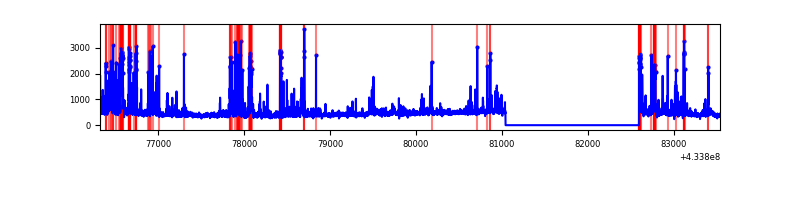 |
Top three noisy pixels from each quadrant. If the there are fewer than three noisy pixels in the level2.evt file, extra rows are filled as -1
| Pixel properties | Quadrant properties | ||||||
|---|---|---|---|---|---|---|---|
| Quadrant | DetID | PixID | Counts | Sigma | Mean | Median | Sigma |
| A | 10 | 83 | 628293 | 4800.05 | 617 | 602 | 130.8 |
| A | 15 | 237 | 599998 | 4583.67 | 617 | 602 | 130.8 |
| A | 12 | 189 | 30262 | 226.81 | 617 | 602 | 130.8 |
| B | 0 | 189 | 29608 | 227.43 | 628 | 609 | 127.5 |
| B | 0 | 186 | 23371 | 178.52 | 628 | 609 | 127.5 |
| B | 5 | 255 | 20449 | 155.6 | 628 | 609 | 127.5 |
| C | 15 | 214 | 238490 | 1614.03 | 612 | 613 | 147.4 |
| C | 14 | 254 | 74337 | 500.23 | 612 | 613 | 147.4 |
| C | 2 | 16 | 61567 | 413.58 | 612 | 613 | 147.4 |
| D | 1 | 52 | 257804 | 1709.56 | 601 | 581 | 150.5 |
| D | 12 | 233 | 235437 | 1560.9 | 601 | 581 | 150.5 |
| D | 2 | 249 | 209212 | 1386.6 | 601 | 581 | 150.5 |
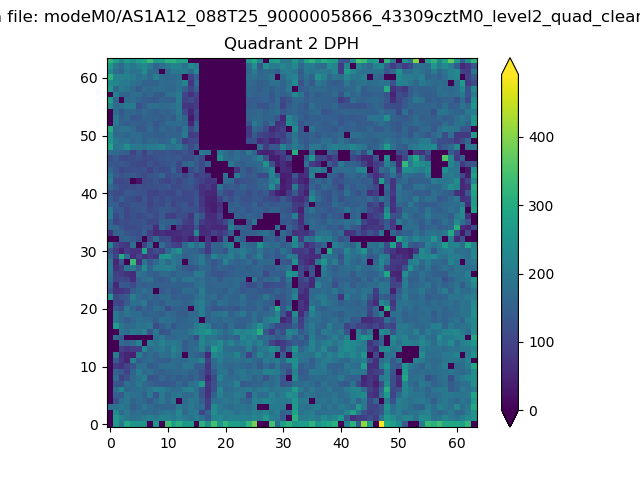
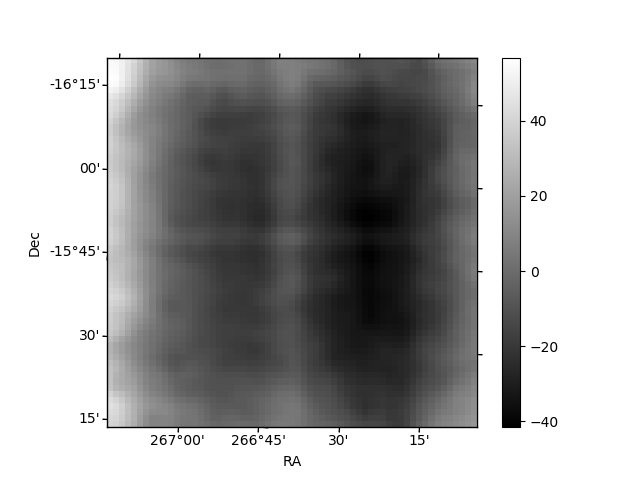
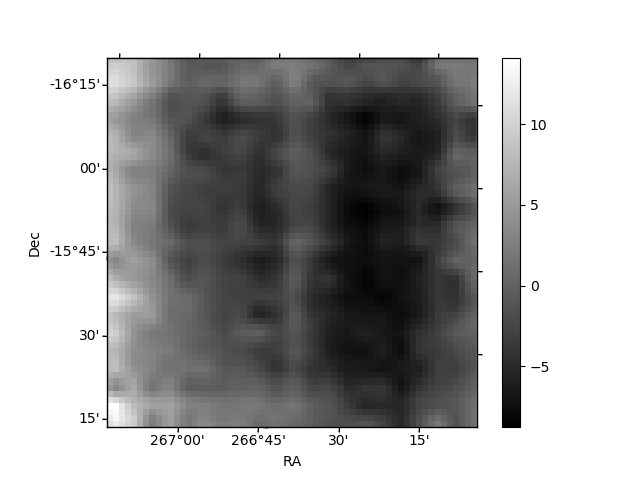
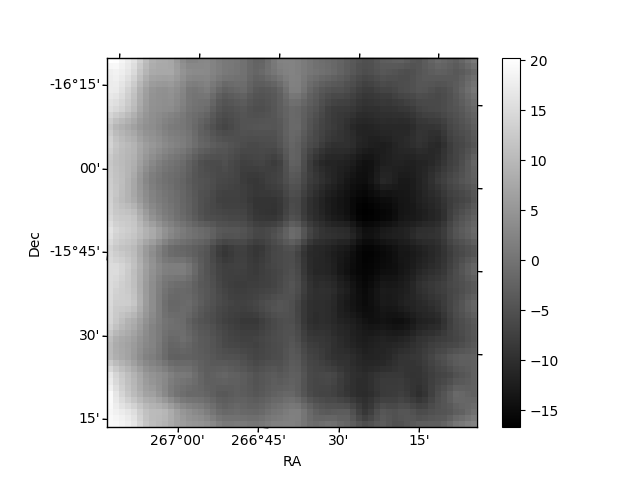
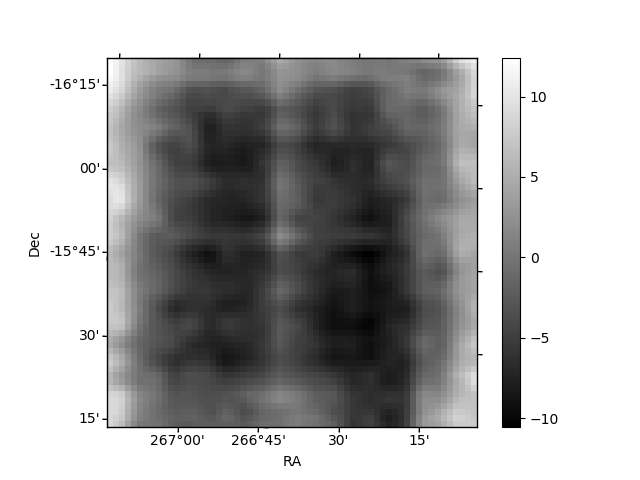
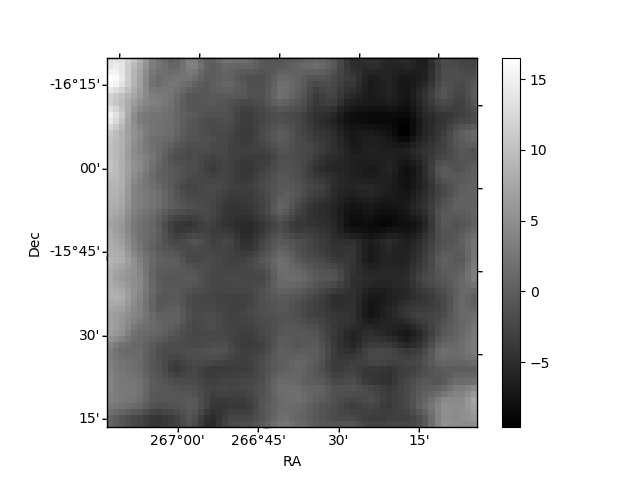
Histogram calculated using DETX and DETY for each event in the final _common_clean file
| Quadrant A | 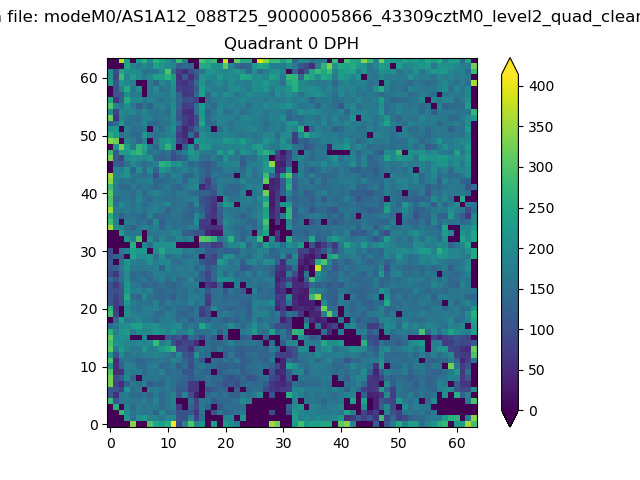 |
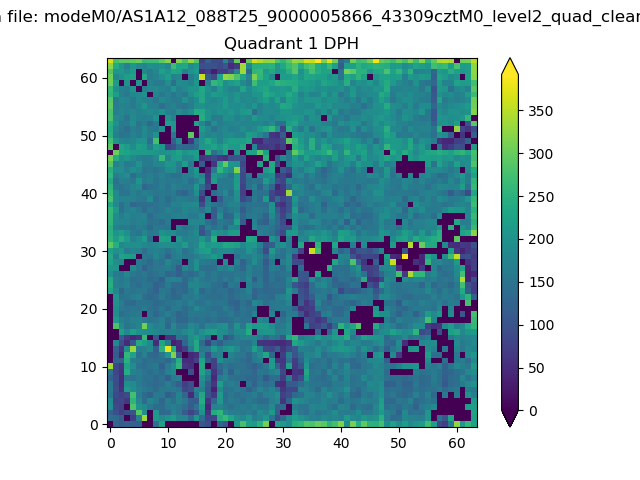 |
Quadrant B |
|---|---|---|---|
| Quadrant D | 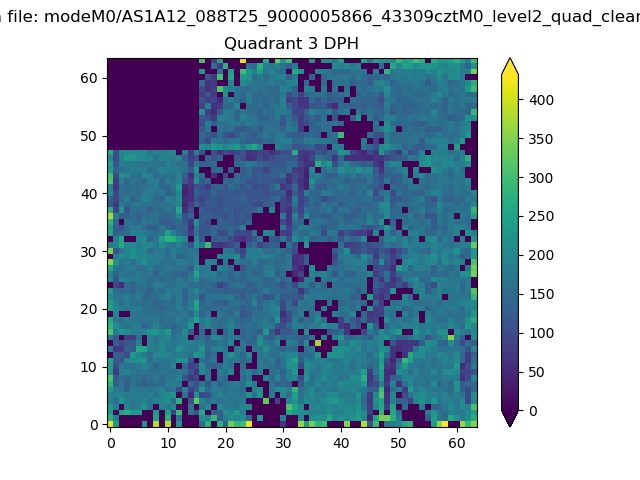 |
 |
Quadrant C |
| Plot type | Count rate plots | Images |
|---|---|---|
| Comparison with Poisson distribution Blue bars denote a histogram of data divided into 1 sec bins. Red curve is a Poisson curve with rate = median count rate of data. |
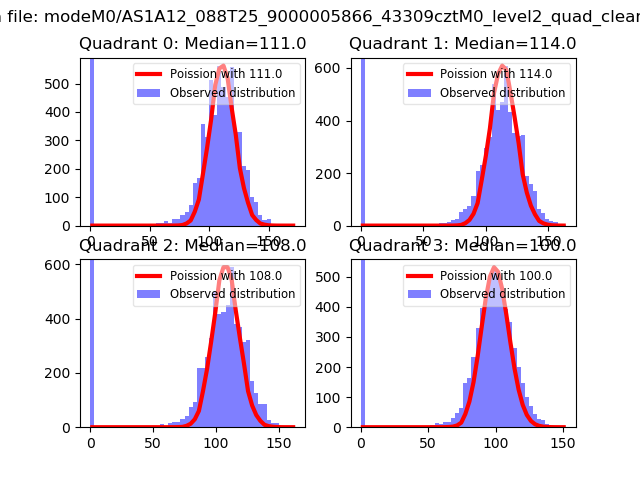 |
 |
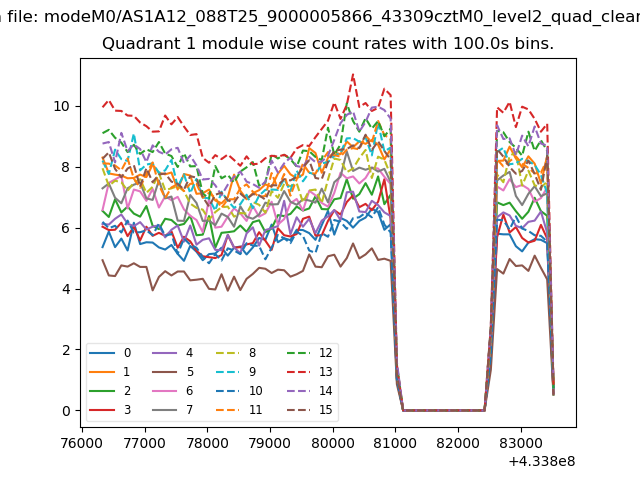
| Quadrant-wise count rates Data is divided into 100 sec bins |
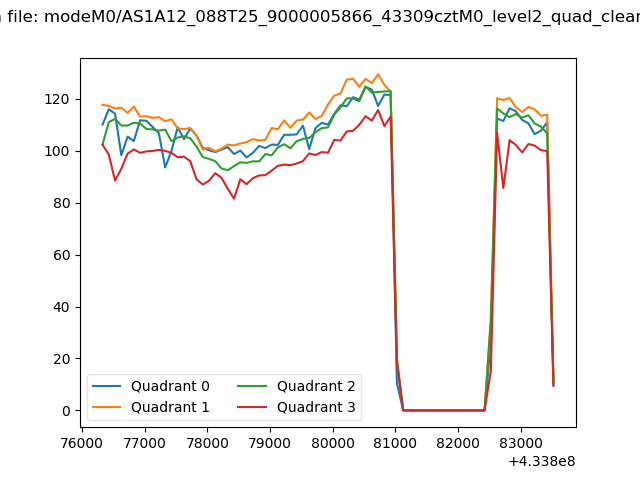 |
|
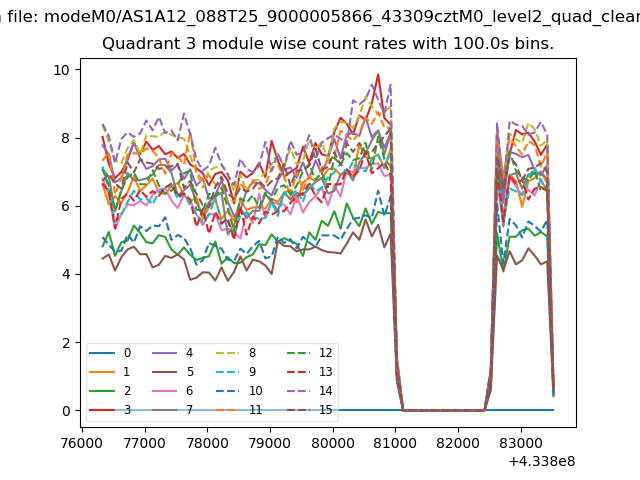
| Module-wise count rates for Quadrant A Data is divided into 100 sec bins |
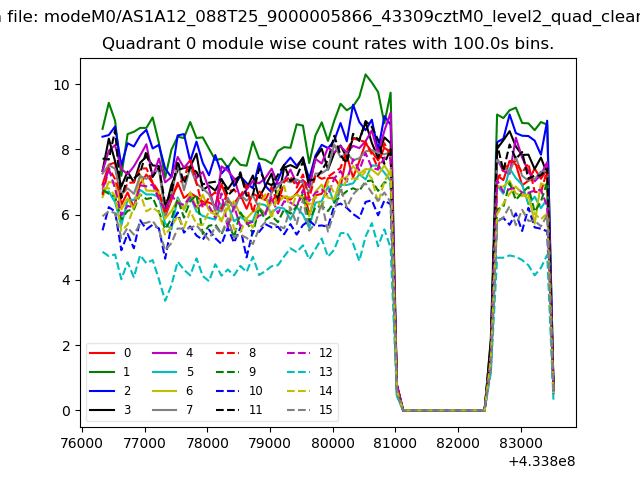 |
 |
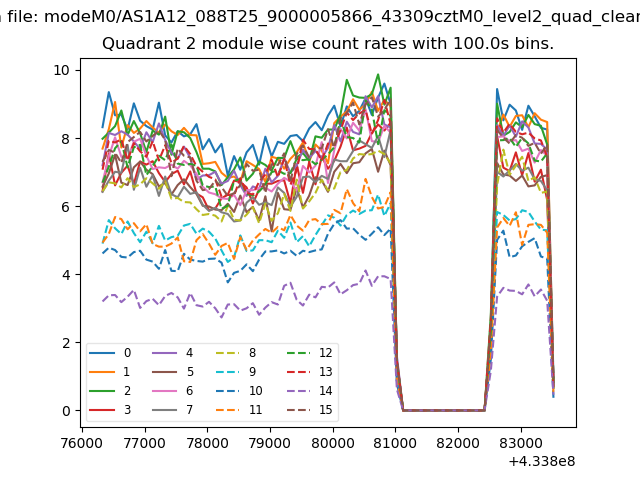
| Module-wise count rates for Quadrant B Data is divided into 100 sec bins |
 |
 |
| Module-wise count rates for Quadrant C Data is divided into 100 sec bins |
 |
 |
| Module-wise count rates for Quadrant D Data is divided into 100 sec bins |
 |
 |
| Parameter | Plot |
|---|---|
| CZT HV Monitor | 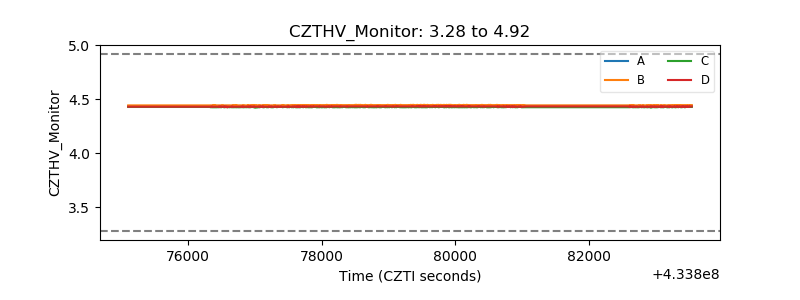 |
| D_VDD | 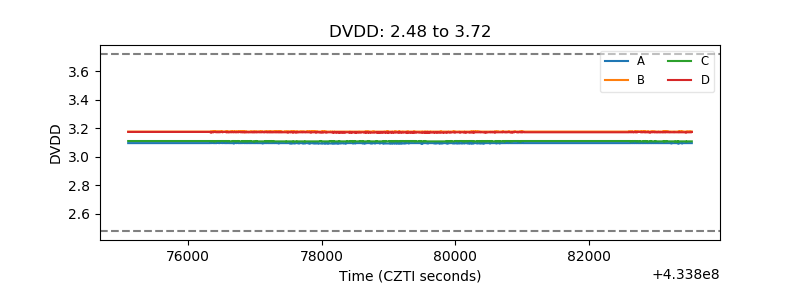 |
| Temperature 1 | 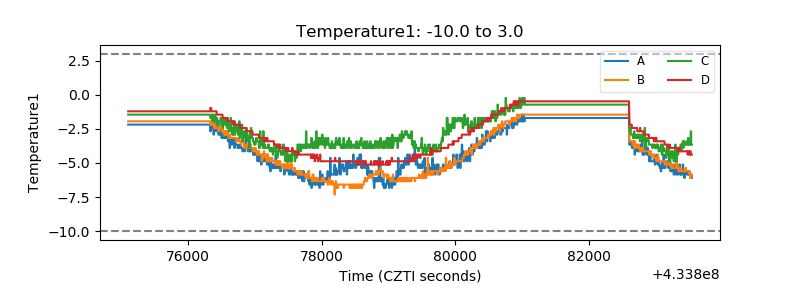 |
| Veto HV Monitor | 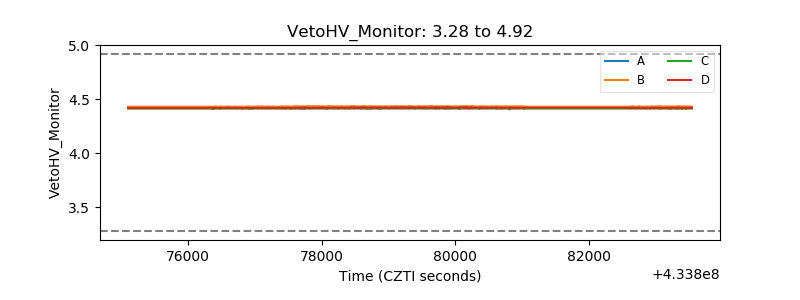 |
| Veto LLD | 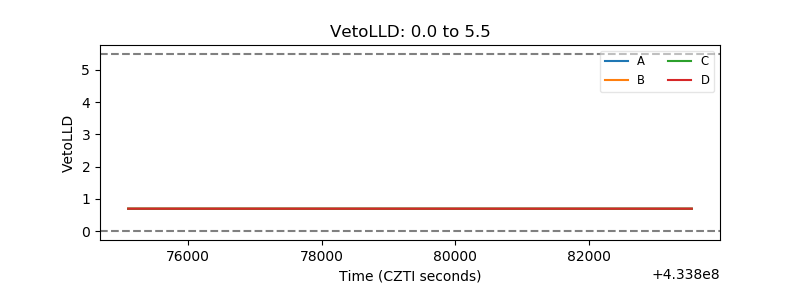 |
| Alpha Counter | 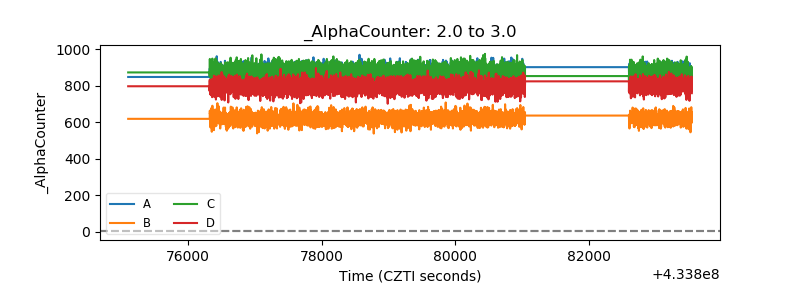 |
| _CPM_Rate | 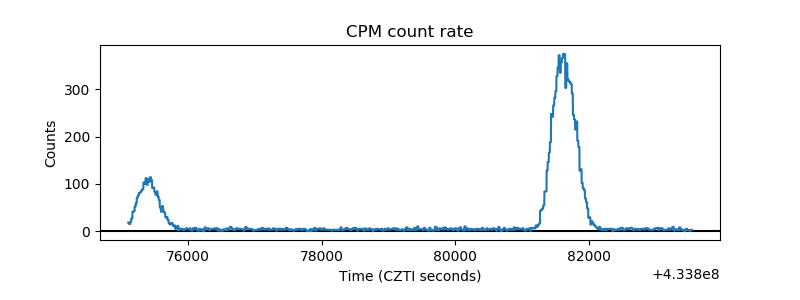 |
| CZT Counter | 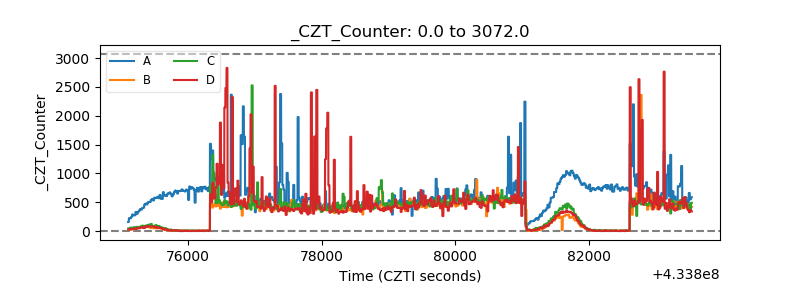 |
| +2.5 Volts monitor | 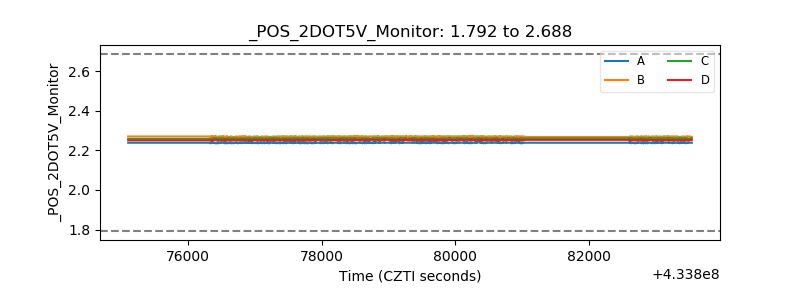 |
| +5 Volts monitor | 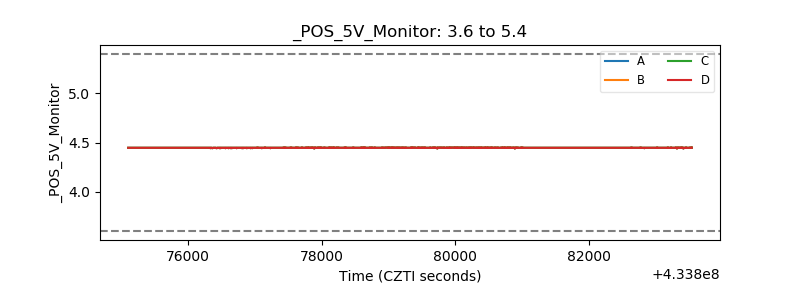 |
| _ROLL_ROT |  |
| _Roll_DEC | 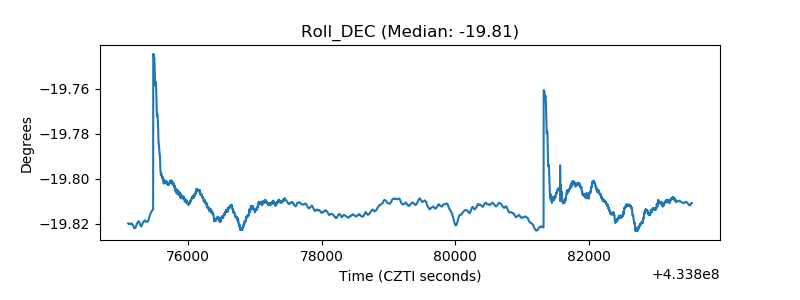 |
| _Roll_RA | 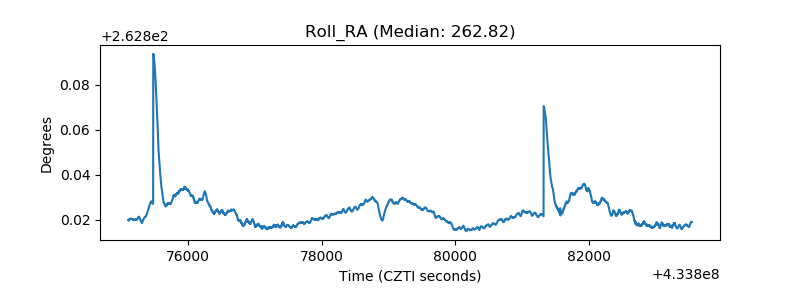 |
| Veto Counter | 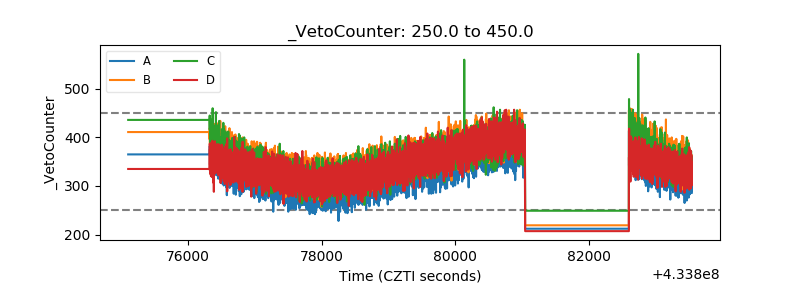 |