| Param | Original file | Final file |
|---|---|---|
| Filename | modeM0/AS1A12_088T25_9000005866_43313cztM0_level2.fits | modeM0/AS1A12_088T25_9000005866_43313cztM0_level2_quad_clean.evt |
| Size (bytes) | 343,434,240 | 94,962,240 |
| Size | 327.5 MB | 90.6 MB |
| Events in quadrant A | 3,589,204 | 640,386 |
| Events in quadrant B | 2,705,455 | 670,530 |
| Events in quadrant C | 2,762,766 | 629,299 |
| Events in quadrant D | 3,233,547 | 556,198 |
| Mode SS | |||
|---|---|---|---|
| Quadrant | BADHDUFLAG | Total packets | Discarded packets |
| A | 0 | 110 | 0 |
| B | 0 | 110 | 0 |
| C | 0 | 110 | 0 |
| D | 0 | 110 | 0 |
| Mode M0 | |||
|---|---|---|---|
| Quadrant | BADHDUFLAG | Total packets | Discarded packets |
| A | 0 | 14138 | 3 |
| B | 0 | 11444 | 2 |
| C | 0 | 11295 | 2 |
| D | 0 | 13408 | 2 |
| Mode M9 | |||
|---|---|---|---|
| Quadrant | BADHDUFLAG | Total packets | Discarded packets |
| A | 0 | 30 | 0 |
| B | 0 | 31 | 0 |
| C | 0 | 31 | 0 |
| D | 0 | 31 | 0 |
| Quadrant | Total seconds | Saturated seconds | Saturation percentage |
|---|---|---|---|
| A | 5418 | 105 | 1.937984% |
| B | 5418 | 35 | 0.645995% |
| C | 5418 | 12 | 0.221484% |
| D | 5418 | 197 | 3.636028% |
Noise dominated data is calculated using 1-second bins in cleaned event files. If a bin has >2000 counts, and if more than 50% of those come from <1% of pixels, then it is considered to be noise-dominated and hence unusable.
| Quadrant | # 1 sec bins | Bins with >0 counts | Bins with >2000 counts | High rate bins dominated by noise | Noise dominated (total time) | Noise dominated (detector-on time) | Marked lightcurve |
|---|---|---|---|---|---|---|---|
| A | 7332 | 5418 | 81 | 81 | 1.10% | 1.50% | 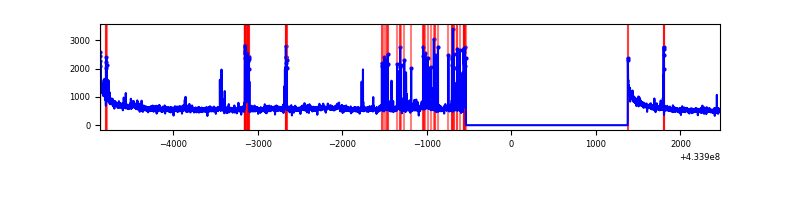 |
| B | 7332 | 5419 | 24 | 24 | 0.33% | 0.44% | 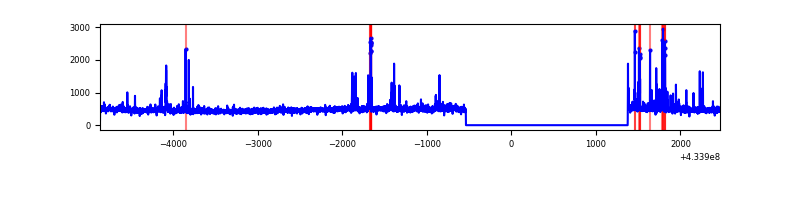 |
| C | 7332 | 5419 | 8 | 8 | 0.11% | 0.15% |  |
| D | 7332 | 5419 | 182 | 182 | 2.48% | 3.36% | 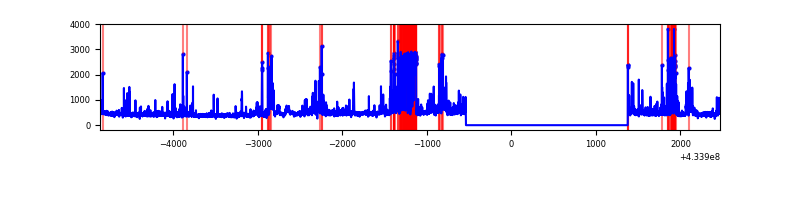 |
Top three noisy pixels from each quadrant. If the there are fewer than three noisy pixels in the level2.evt file, extra rows are filled as -1
| Pixel properties | Quadrant properties | ||||||
|---|---|---|---|---|---|---|---|
| Quadrant | DetID | PixID | Counts | Sigma | Mean | Median | Sigma |
| A | 10 | 83 | 581286 | 4524.49 | 625 | 613 | 128.3 |
| A | 15 | 237 | 343725 | 2673.46 | 625 | 613 | 128.3 |
| A | 15 | 222 | 200142 | 1554.69 | 625 | 613 | 128.3 |
| B | 5 | 172 | 115259 | 935.63 | 630 | 612 | 122.5 |
| B | 5 | 255 | 62466 | 504.79 | 630 | 612 | 122.5 |
| B | 0 | 190 | 17042 | 134.09 | 630 | 612 | 122.5 |
| C | 15 | 214 | 227875 | 1564.16 | 616 | 620 | 145.3 |
| C | 14 | 254 | 96418 | 659.36 | 616 | 620 | 145.3 |
| C | 3 | 233 | 34729 | 234.77 | 616 | 620 | 145.3 |
| D | 1 | 52 | 517238 | 3465.97 | 599 | 580 | 149.1 |
| D | 13 | 249 | 185887 | 1243.12 | 599 | 580 | 149.1 |
| D | 12 | 6 | 155984 | 1042.52 | 599 | 580 | 149.1 |
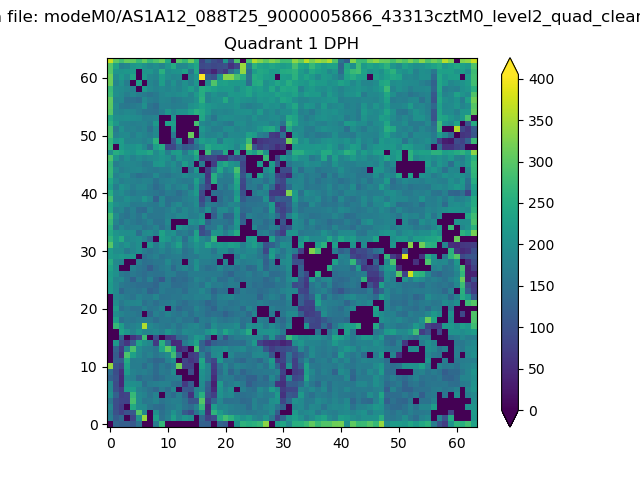
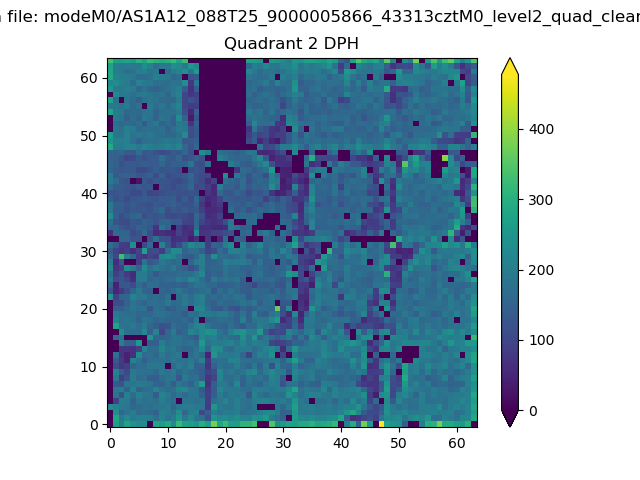
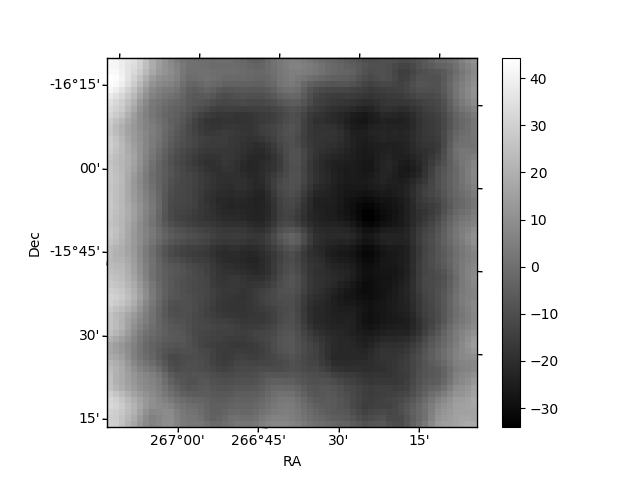
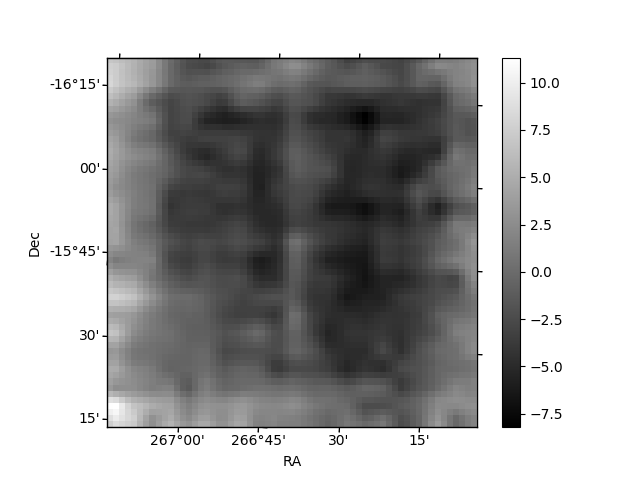
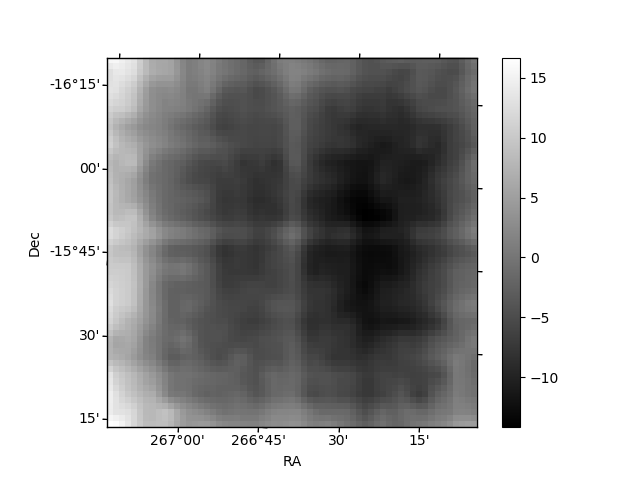
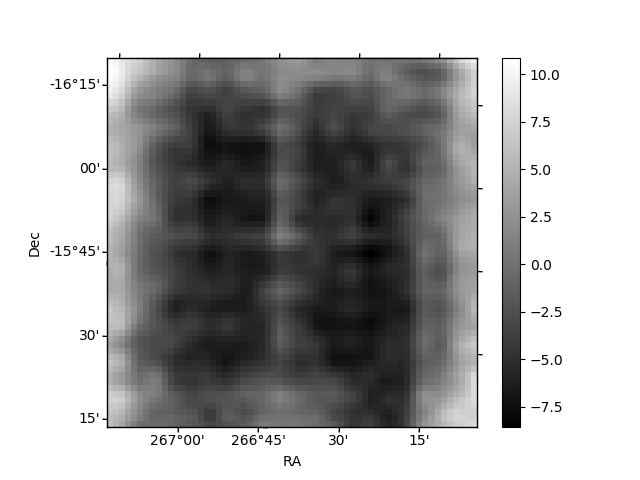
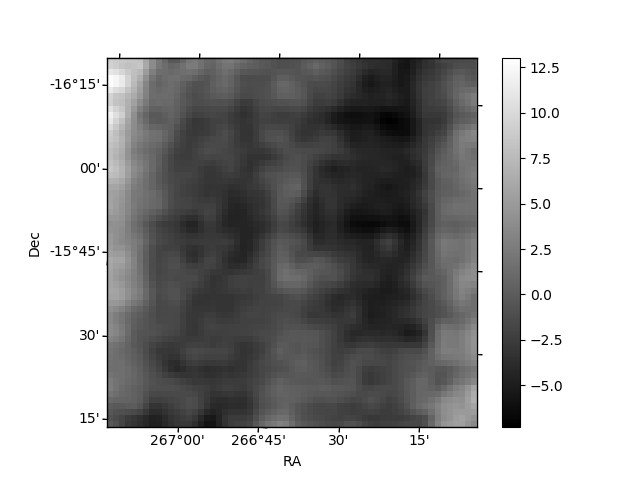
Histogram calculated using DETX and DETY for each event in the final _common_clean file
| Quadrant A | 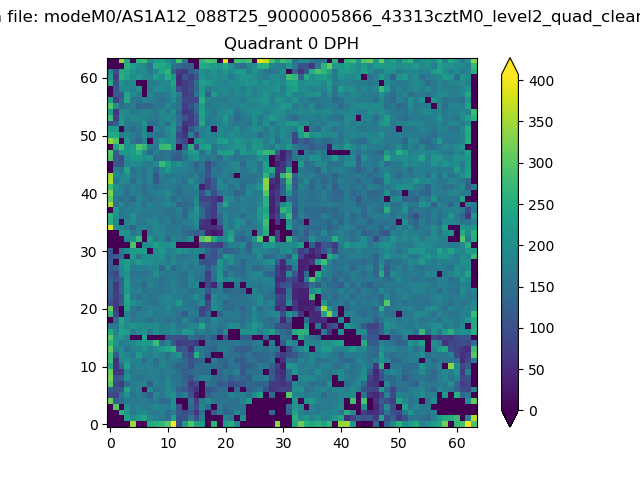 |
 |
Quadrant B |
|---|---|---|---|
| Quadrant D | 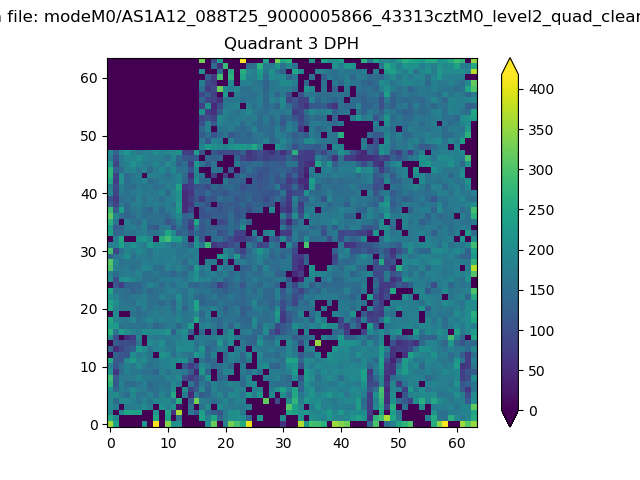 |
 |
Quadrant C |
| Plot type | Count rate plots | Images |
|---|---|---|
| Comparison with Poisson distribution Blue bars denote a histogram of data divided into 1 sec bins. Red curve is a Poisson curve with rate = median count rate of data. |
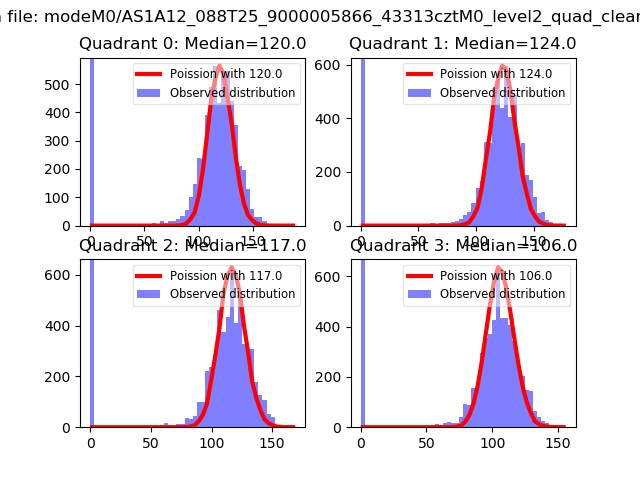 |
 |
| Quadrant-wise count rates Data is divided into 100 sec bins |
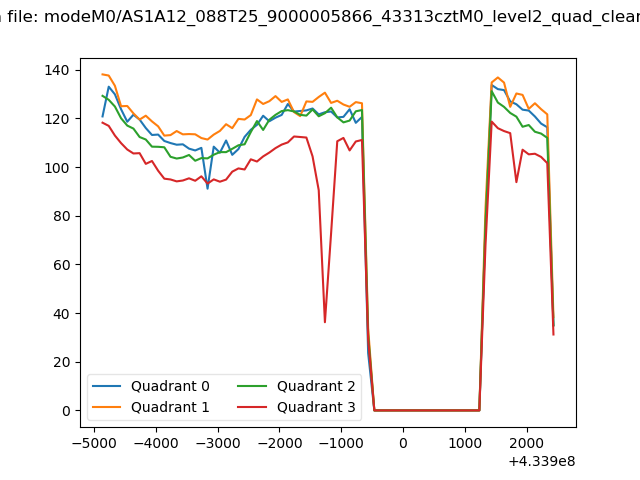 |
|
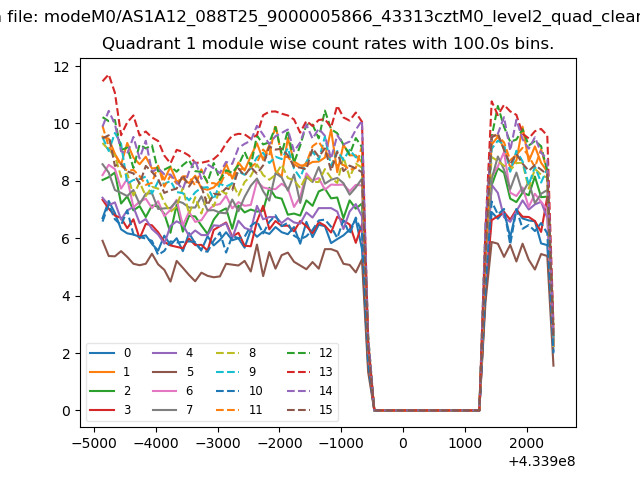
| Module-wise count rates for Quadrant A Data is divided into 100 sec bins |
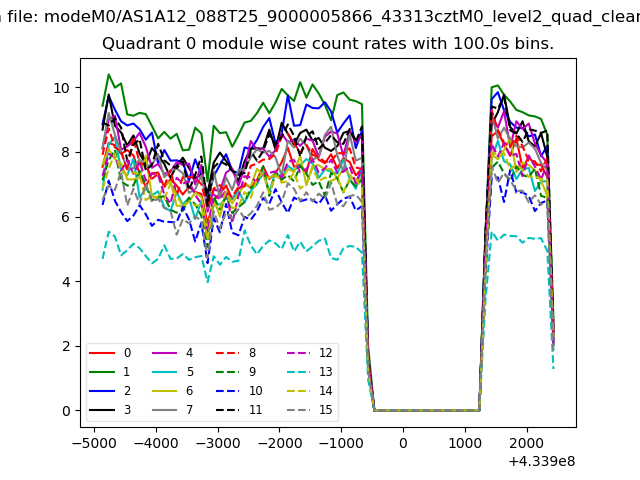 |
 |
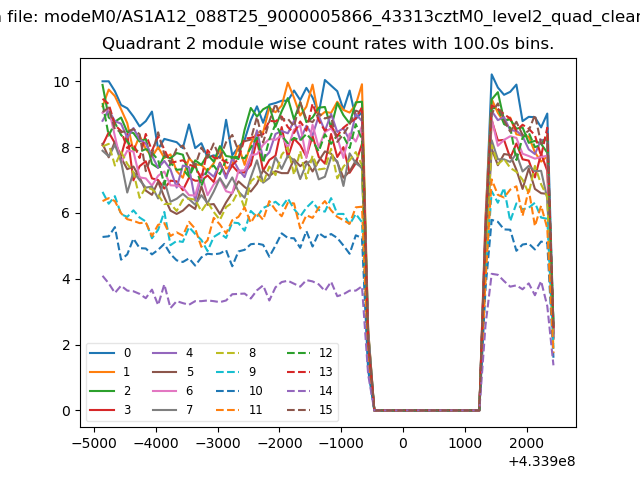
| Module-wise count rates for Quadrant B Data is divided into 100 sec bins |
 |
 |
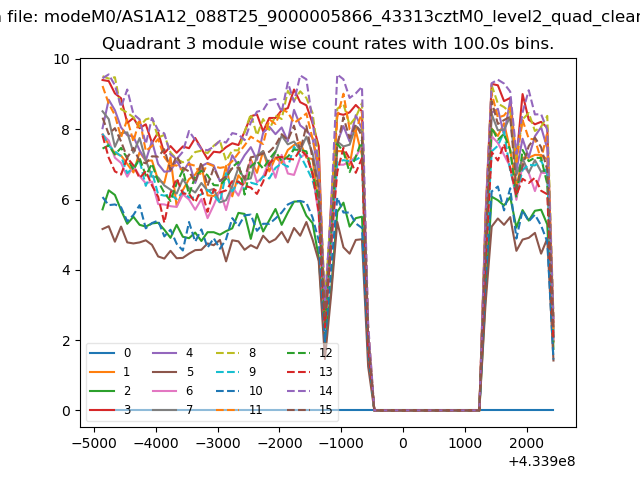
| Module-wise count rates for Quadrant C Data is divided into 100 sec bins |
 |
 |
| Module-wise count rates for Quadrant D Data is divided into 100 sec bins |
 |
 |
| Parameter | Plot |
|---|---|
| CZT HV Monitor | 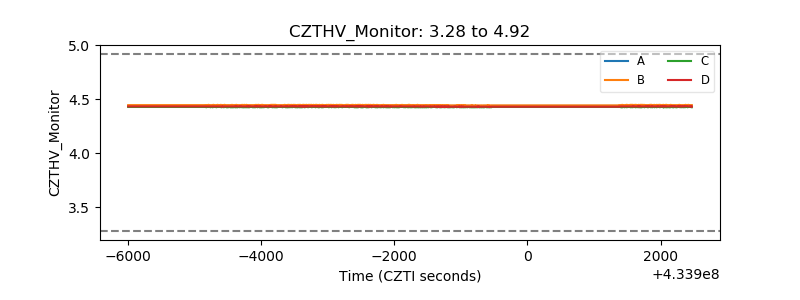 |
| D_VDD | 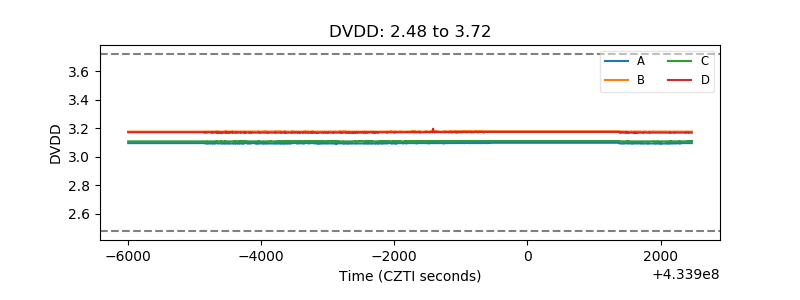 |
| Temperature 1 | 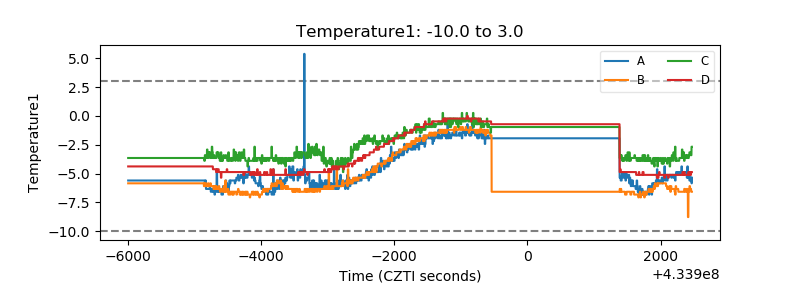 |
| Veto HV Monitor | 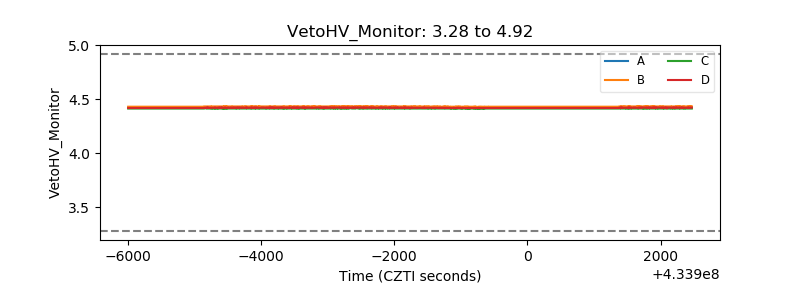 |
| Veto LLD |  |
| Alpha Counter | 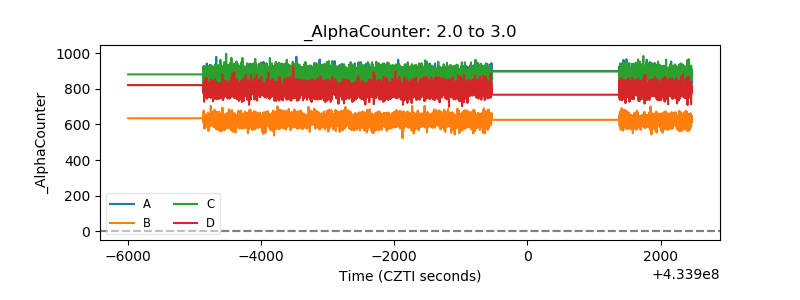 |
| _CPM_Rate | 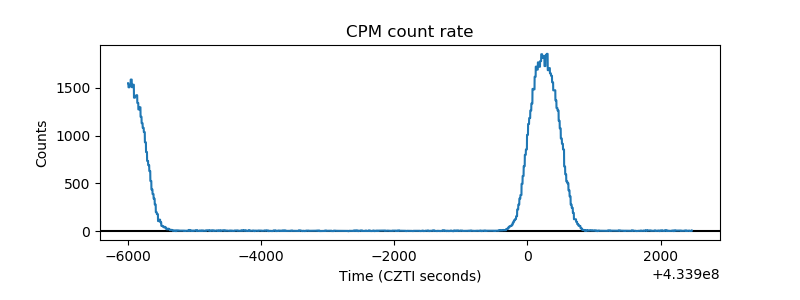 |
| CZT Counter | 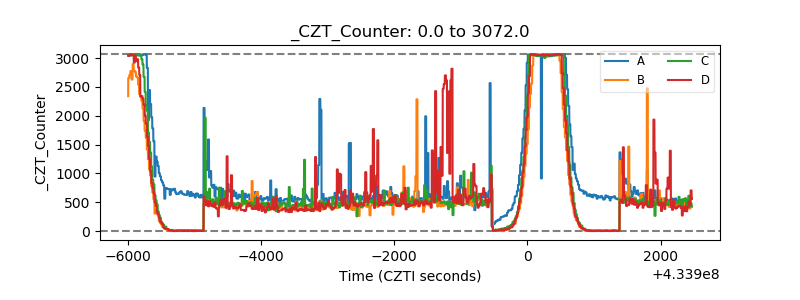 |
| +2.5 Volts monitor | 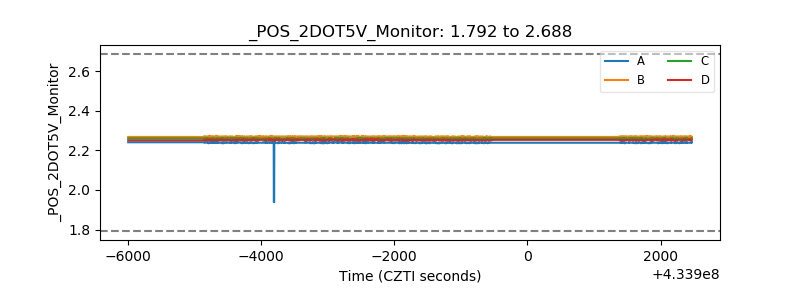 |
| +5 Volts monitor | 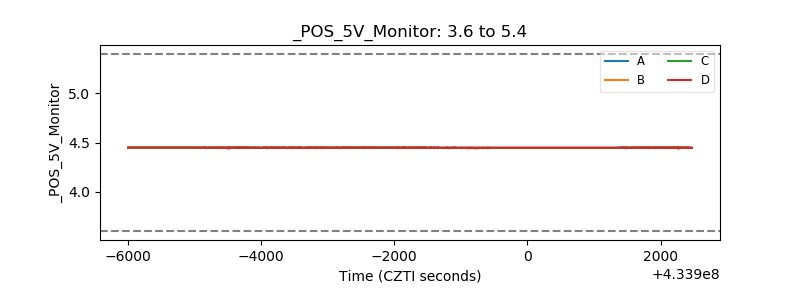 |
| _ROLL_ROT | 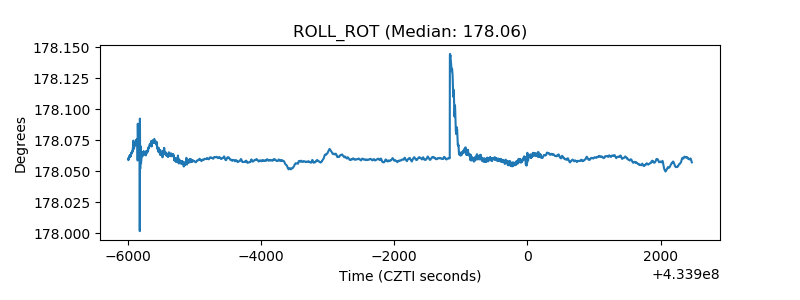 |
| _Roll_DEC | 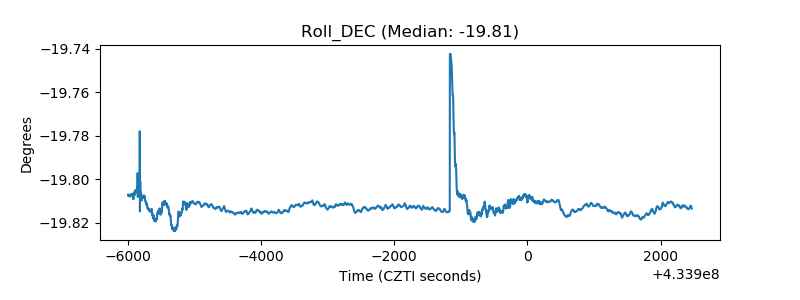 |
| _Roll_RA | 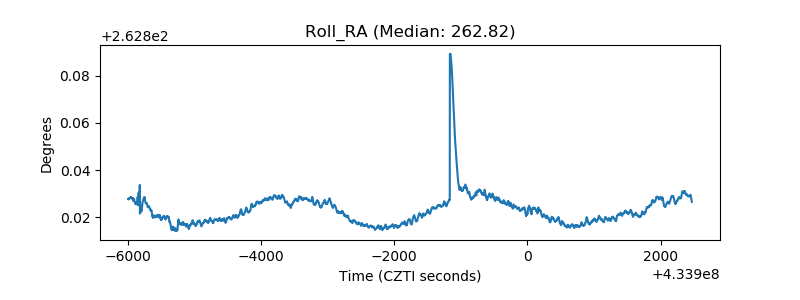 |
| Veto Counter | 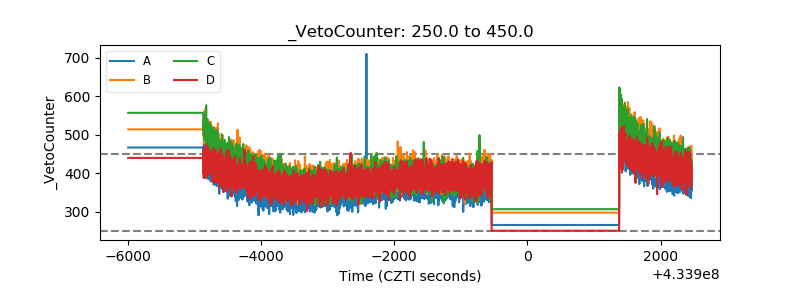 |