| Param | Original file | Final file |
|---|---|---|
| Filename | modeM0/AS1A12_088T25_9000005866_43315cztM0_level2.fits | modeM0/AS1A12_088T25_9000005866_43315cztM0_level2_quad_clean.evt |
| Size (bytes) | 332,334,720 | 92,056,320 |
| Size | 316.9 MB | 87.8 MB |
| Events in quadrant A | 3,584,424 | 611,474 |
| Events in quadrant B | 2,564,433 | 656,412 |
| Events in quadrant C | 2,584,672 | 616,916 |
| Events in quadrant D | 3,172,573 | 547,160 |
| Mode SS | |||
|---|---|---|---|
| Quadrant | BADHDUFLAG | Total packets | Discarded packets |
| A | 0 | 102 | 0 |
| B | 0 | 102 | 0 |
| C | 0 | 102 | 0 |
| D | 0 | 102 | 0 |
| Mode M0 | |||
|---|---|---|---|
| Quadrant | BADHDUFLAG | Total packets | Discarded packets |
| A | 0 | 13812 | 2 |
| B | 0 | 10581 | 2 |
| C | 0 | 10375 | 2 |
| D | 0 | 12748 | 2 |
| Mode M9 | |||
|---|---|---|---|
| Quadrant | BADHDUFLAG | Total packets | Discarded packets |
| A | 0 | 22 | 0 |
| B | 0 | 23 | 0 |
| C | 0 | 23 | 0 |
| D | 0 | 23 | 0 |
| Quadrant | Total seconds | Saturated seconds | Saturation percentage |
|---|---|---|---|
| A | 5081 | 215 | 4.231451% |
| B | 5081 | 24 | 0.472348% |
| C | 5081 | 3 | 0.059043% |
| D | 5081 | 143 | 2.814407% |
Noise dominated data is calculated using 1-second bins in cleaned event files. If a bin has >2000 counts, and if more than 50% of those come from <1% of pixels, then it is considered to be noise-dominated and hence unusable.
| Quadrant | # 1 sec bins | Bins with >0 counts | Bins with >2000 counts | High rate bins dominated by noise | Noise dominated (total time) | Noise dominated (detector-on time) | Marked lightcurve |
|---|---|---|---|---|---|---|---|
| A | 7204 | 5082 | 178 | 178 | 2.47% | 3.50% | 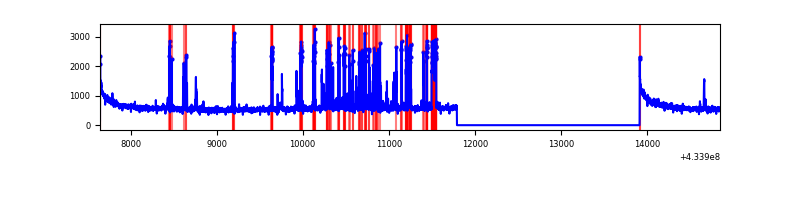 |
| B | 7204 | 5082 | 12 | 12 | 0.17% | 0.24% | 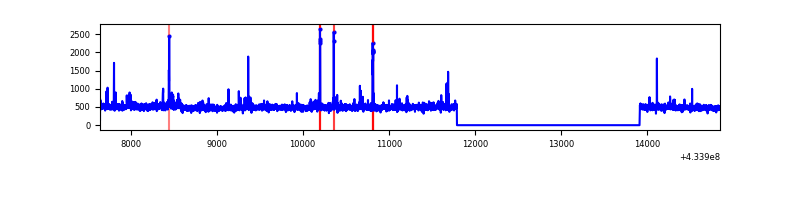 |
| C | 7204 | 5082 | 2 | 2 | 0.03% | 0.04% | 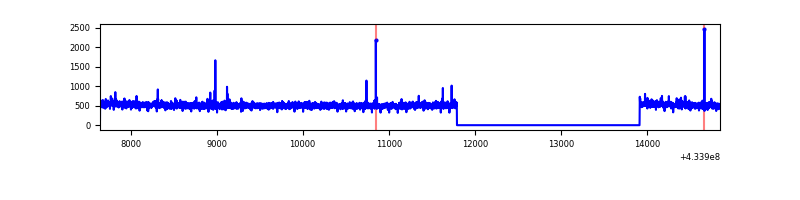 |
| D | 7204 | 5082 | 147 | 147 | 2.04% | 2.89% | 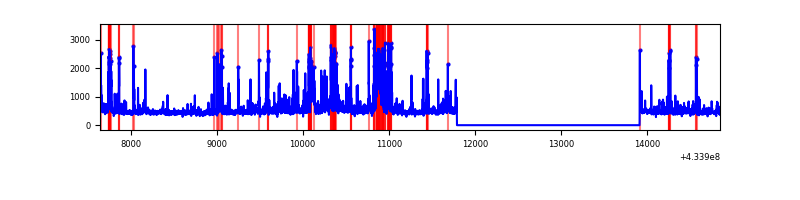 |
Top three noisy pixels from each quadrant. If the there are fewer than three noisy pixels in the level2.evt file, extra rows are filled as -1
| Pixel properties | Quadrant properties | ||||||
|---|---|---|---|---|---|---|---|
| Quadrant | DetID | PixID | Counts | Sigma | Mean | Median | Sigma |
| A | 15 | 237 | 664278 | 5280.15 | 599 | 587 | 125.7 |
| A | 10 | 83 | 562992 | 4474.35 | 599 | 587 | 125.7 |
| A | 12 | 189 | 33123 | 258.85 | 599 | 587 | 125.7 |
| B | 0 | 190 | 33525 | 274.81 | 611 | 593 | 119.8 |
| B | 5 | 255 | 31656 | 259.21 | 611 | 593 | 119.8 |
| B | 5 | 172 | 25424 | 207.21 | 611 | 593 | 119.8 |
| C | 15 | 214 | 214417 | 1524.98 | 596 | 599 | 140.2 |
| C | 15 | 159 | 15803 | 108.44 | 596 | 599 | 140.2 |
| C | 3 | 233 | 13168 | 89.64 | 596 | 599 | 140.2 |
| D | 2 | 249 | 502765 | 3506.61 | 587 | 571 | 143.2 |
| D | 12 | 6 | 143128 | 995.42 | 587 | 571 | 143.2 |
| D | 1 | 52 | 120221 | 835.47 | 587 | 571 | 143.2 |
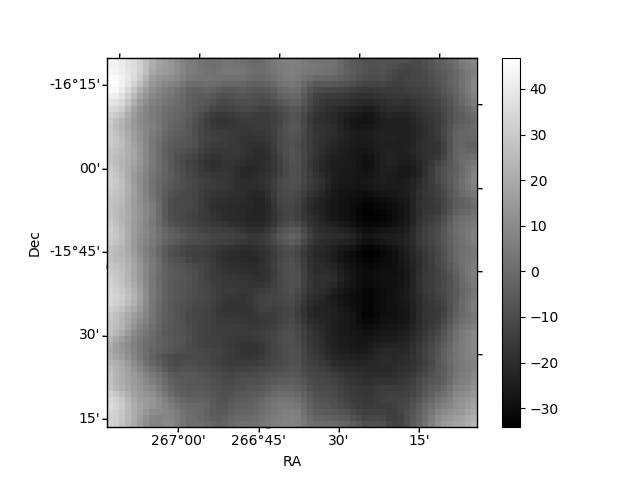
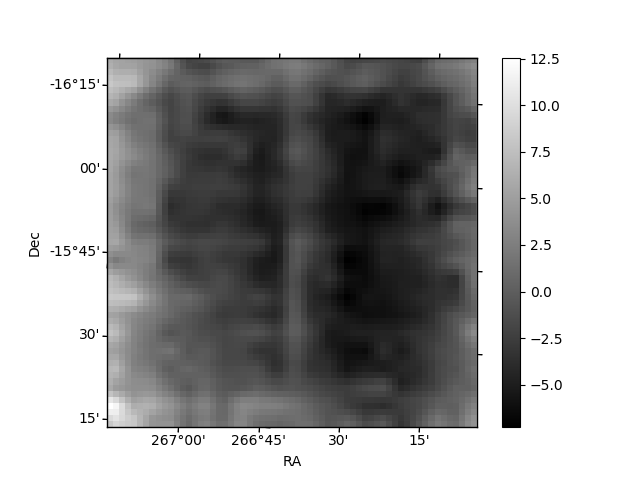
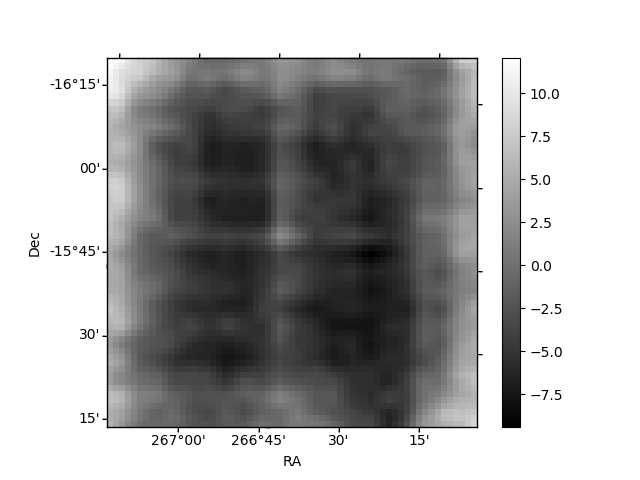
Histogram calculated using DETX and DETY for each event in the final _common_clean file
| Quadrant A | 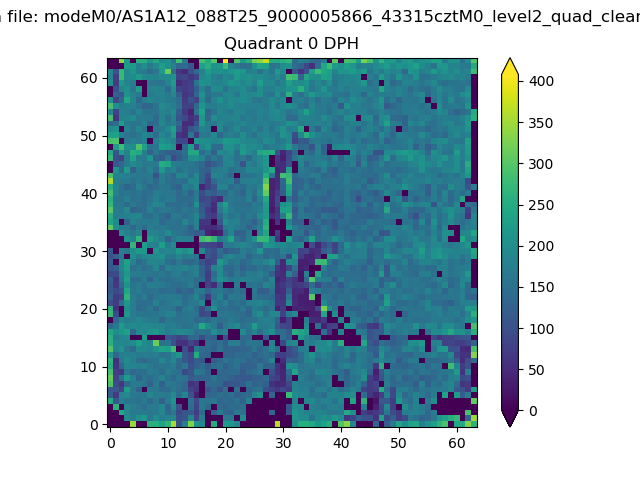 |
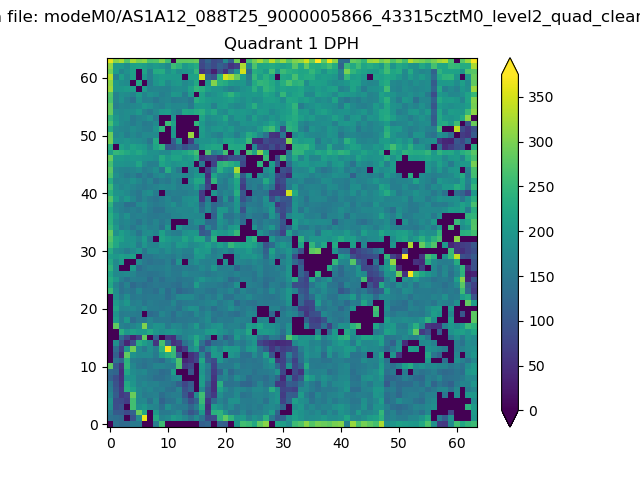 |
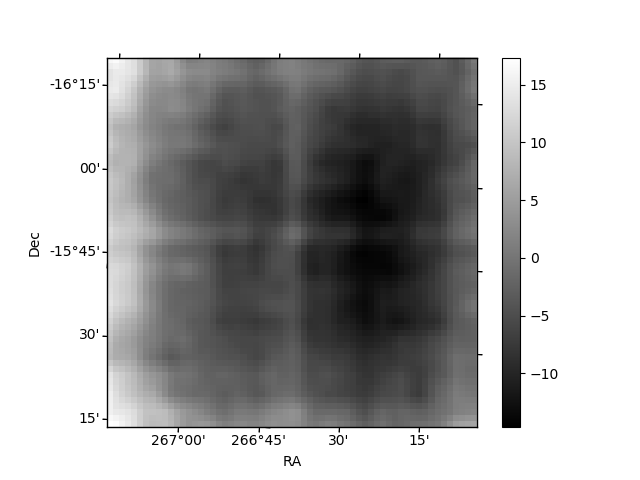
Quadrant B |
|---|---|---|---|
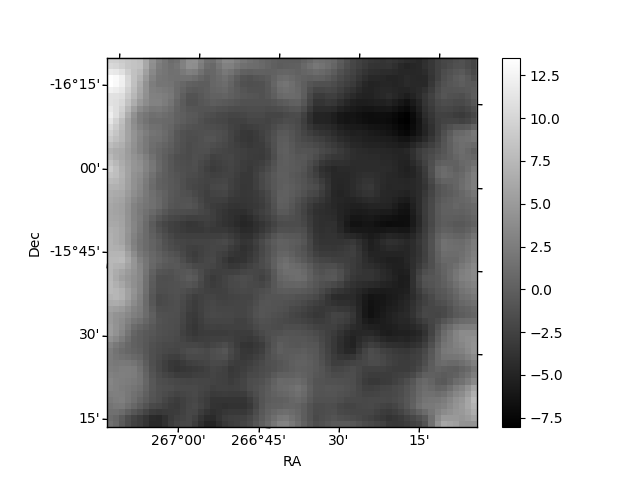
| Quadrant D | 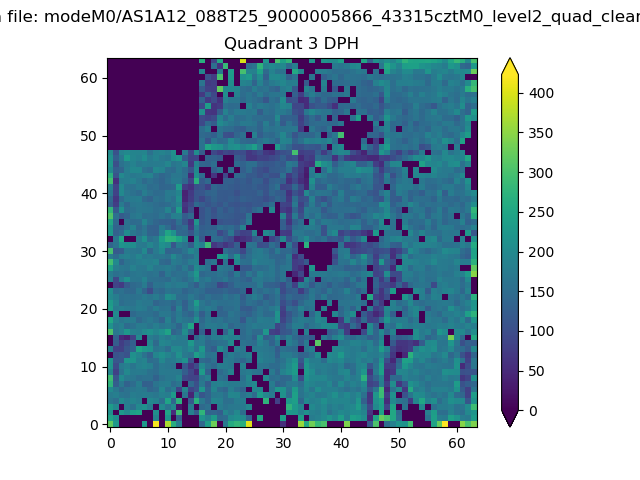 |
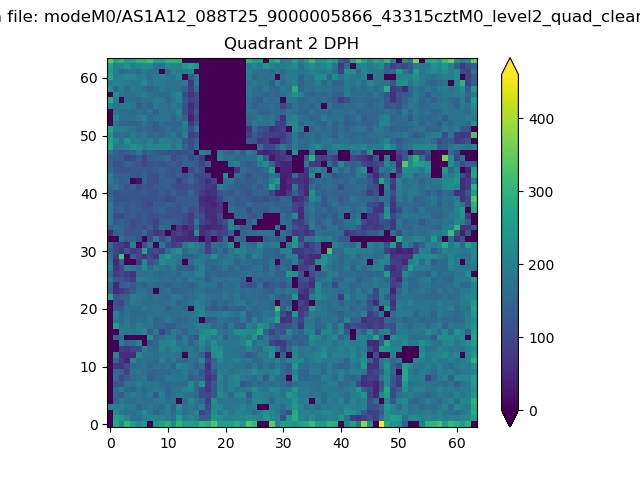 |
Quadrant C |
| Plot type | Count rate plots | Images |
|---|---|---|
| Comparison with Poisson distribution Blue bars denote a histogram of data divided into 1 sec bins. Red curve is a Poisson curve with rate = median count rate of data. |
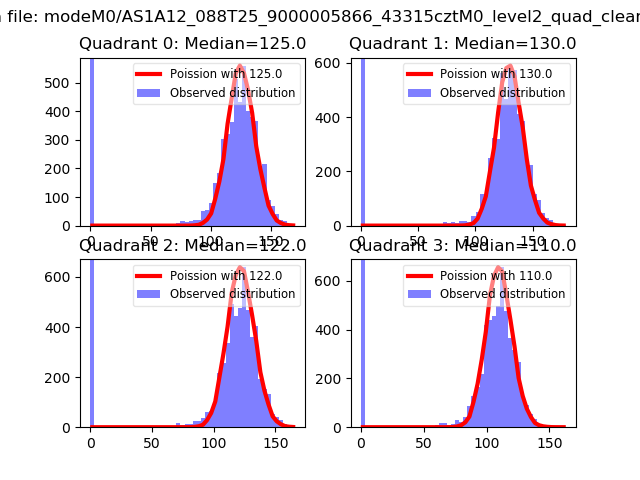 |
 |
| Quadrant-wise count rates Data is divided into 100 sec bins |
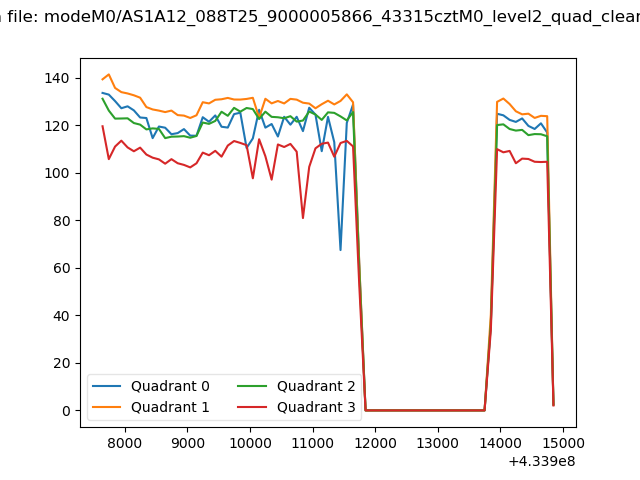 |
|
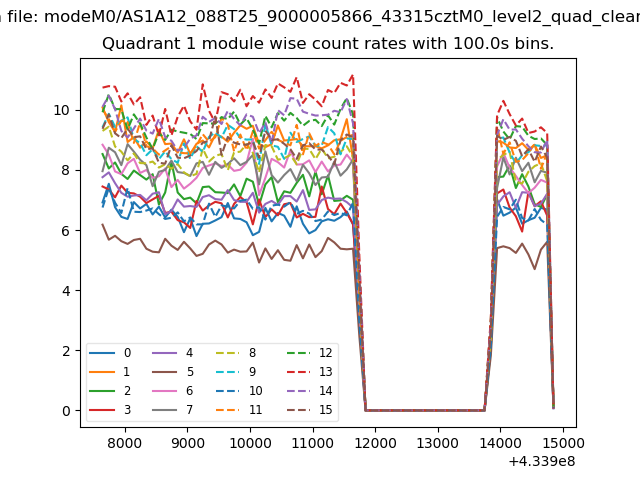
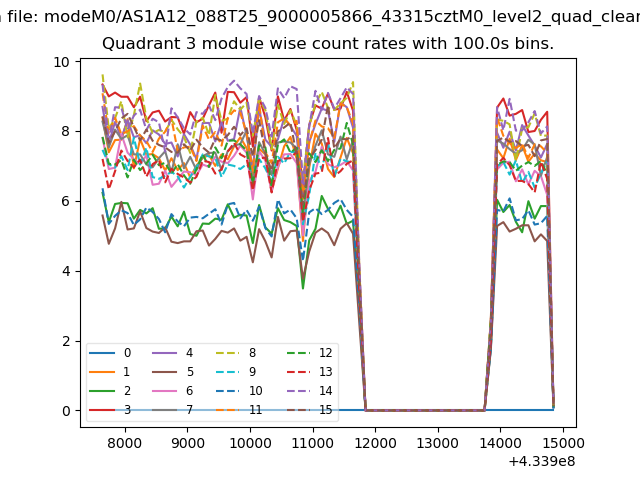
| Module-wise count rates for Quadrant A Data is divided into 100 sec bins |
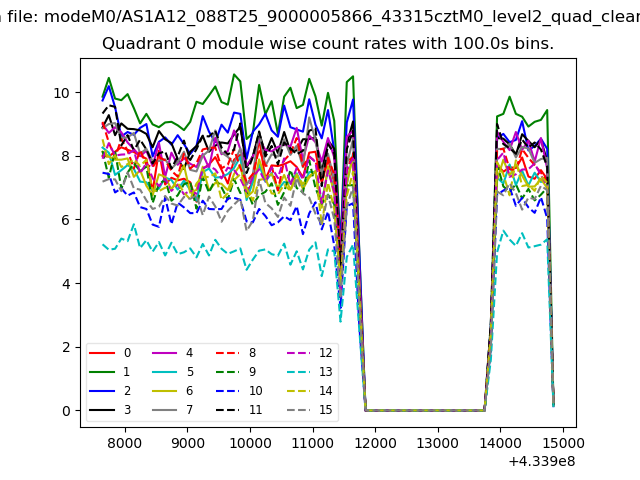 |
 |
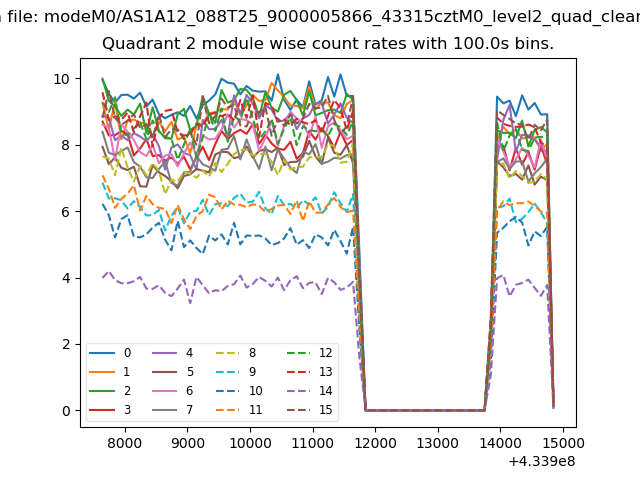
| Module-wise count rates for Quadrant B Data is divided into 100 sec bins |
 |
 |
| Module-wise count rates for Quadrant C Data is divided into 100 sec bins |
 |
 |
| Module-wise count rates for Quadrant D Data is divided into 100 sec bins |
 |
 |
| Parameter | Plot |
|---|---|
| CZT HV Monitor | 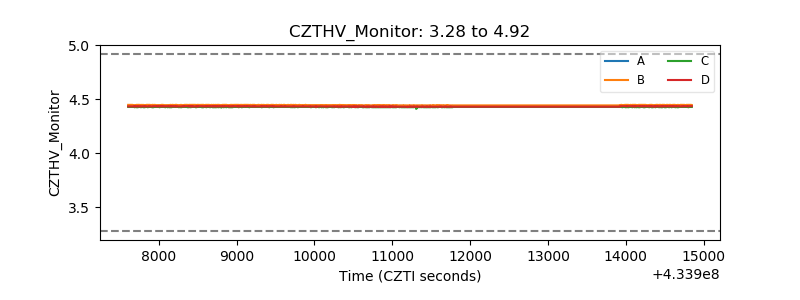 |
| D_VDD | 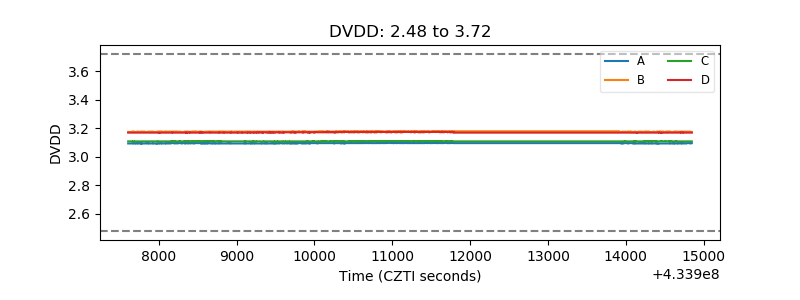 |
| Temperature 1 | 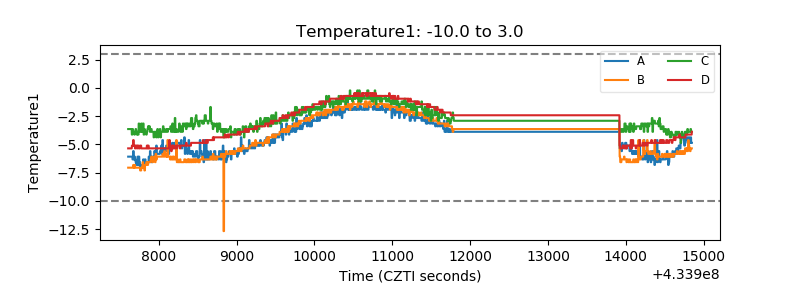 |
| Veto HV Monitor | 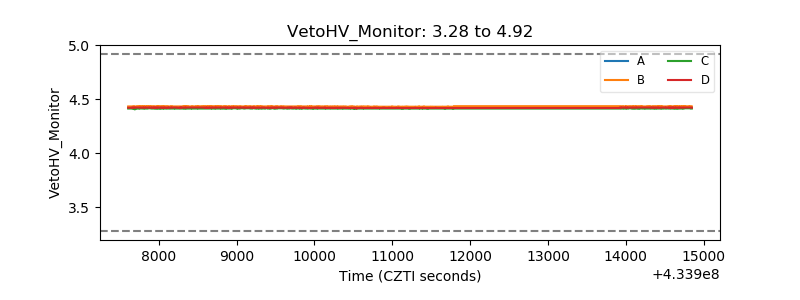 |
| Veto LLD | 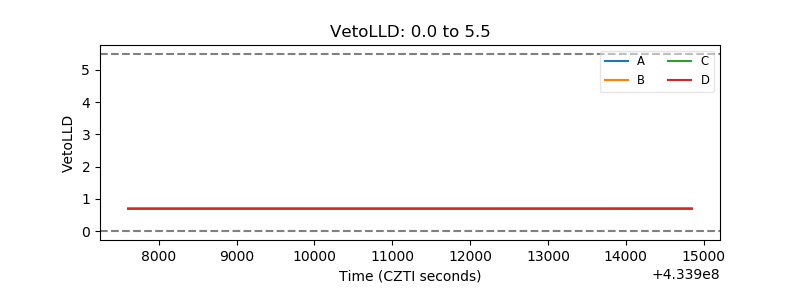 |
| Alpha Counter | 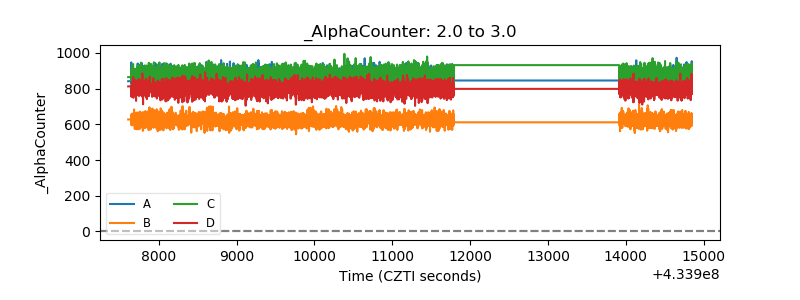 |
| _CPM_Rate | 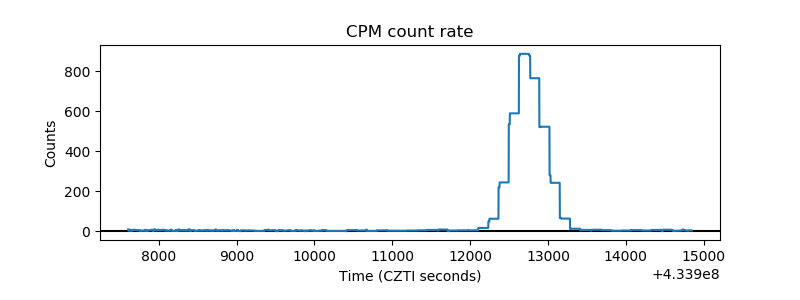 |
| CZT Counter | 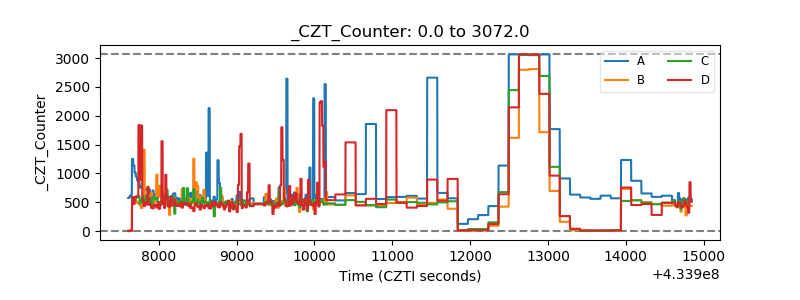 |
| +2.5 Volts monitor | 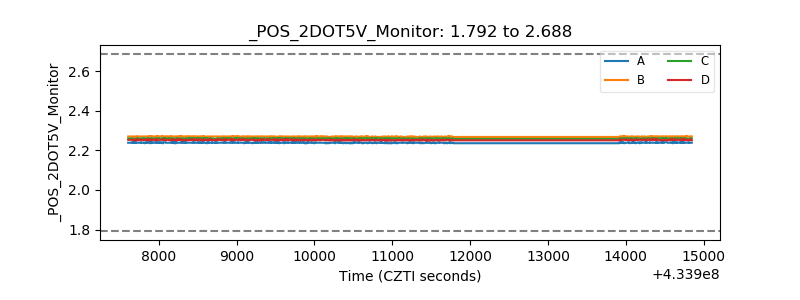 |
| +5 Volts monitor | 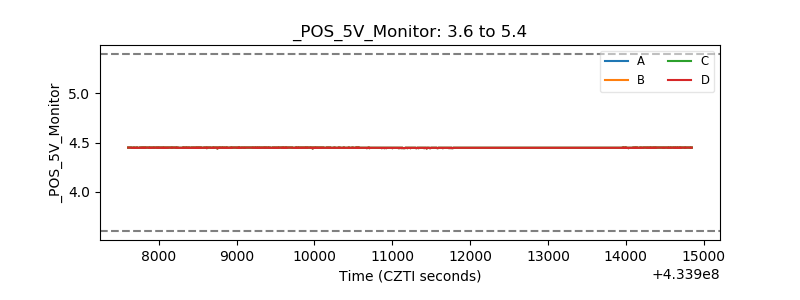 |
| _ROLL_ROT | 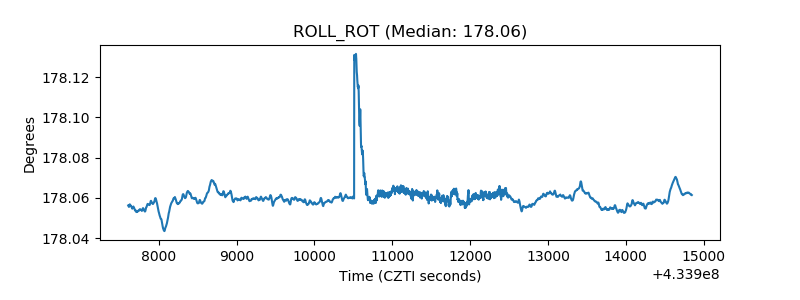 |
| _Roll_DEC | 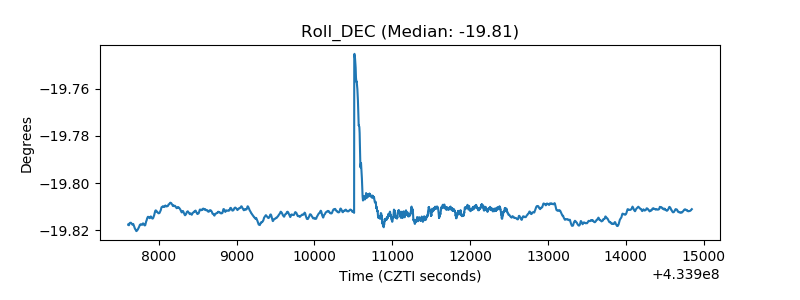 |
| _Roll_RA | 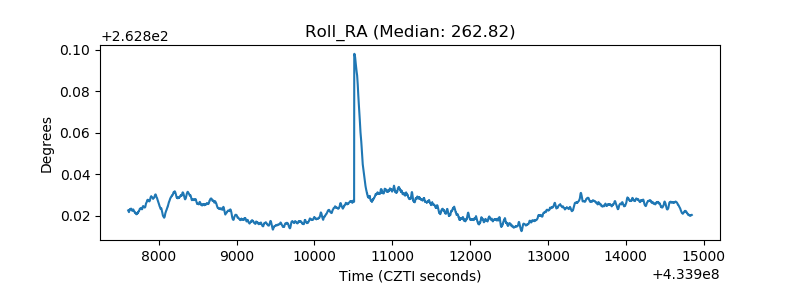 |
| Veto Counter | 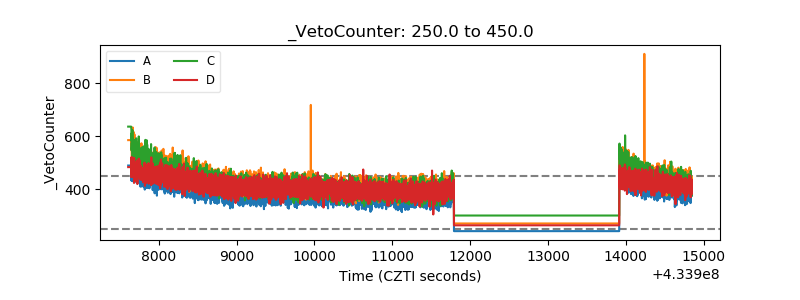 |