| Param | Original file | Final file |
|---|---|---|
| Filename | modeM0/AS1A12_088T25_9000005866_43317cztM0_level2.fits | modeM0/AS1A12_088T25_9000005866_43317cztM0_level2_quad_clean.evt |
| Size (bytes) | 321,554,880 | 86,558,400 |
| Size | 306.7 MB | 82.5 MB |
| Events in quadrant A | 3,597,134 | 567,175 |
| Events in quadrant B | 2,539,383 | 606,521 |
| Events in quadrant C | 2,451,794 | 579,409 |
| Events in quadrant D | 2,924,450 | 516,990 |
| Mode SS | |||
|---|---|---|---|
| Quadrant | BADHDUFLAG | Total packets | Discarded packets |
| A | 0 | 102 | 0 |
| B | 0 | 102 | 0 |
| C | 0 | 102 | 0 |
| D | 0 | 102 | 0 |
| Mode M0 | |||
|---|---|---|---|
| Quadrant | BADHDUFLAG | Total packets | Discarded packets |
| A | 0 | 13765 | 2 |
| B | 0 | 10624 | 2 |
| C | 0 | 10147 | 2 |
| D | 0 | 12085 | 2 |
| Mode M9 | |||
|---|---|---|---|
| Quadrant | BADHDUFLAG | Total packets | Discarded packets |
| A | 0 | 38 | 0 |
| B | 0 | 39 | 0 |
| C | 0 | 39 | 0 |
| D | 0 | 39 | 0 |
| Quadrant | Total seconds | Saturated seconds | Saturation percentage |
|---|---|---|---|
| A | 5007 | 249 | 4.973038% |
| B | 5007 | 18 | 0.359497% |
| C | 5007 | 3 | 0.059916% |
| D | 5007 | 128 | 2.556421% |
Noise dominated data is calculated using 1-second bins in cleaned event files. If a bin has >2000 counts, and if more than 50% of those come from <1% of pixels, then it is considered to be noise-dominated and hence unusable.
| Quadrant | # 1 sec bins | Bins with >0 counts | Bins with >2000 counts | High rate bins dominated by noise | Noise dominated (total time) | Noise dominated (detector-on time) | Marked lightcurve |
|---|---|---|---|---|---|---|---|
| A | 7009 | 5008 | 212 | 212 | 3.02% | 4.23% | 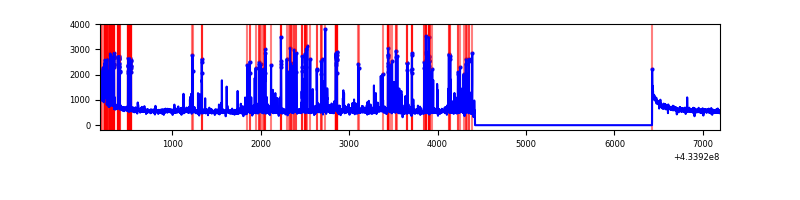 |
| B | 7009 | 5008 | 9 | 9 | 0.13% | 0.18% | 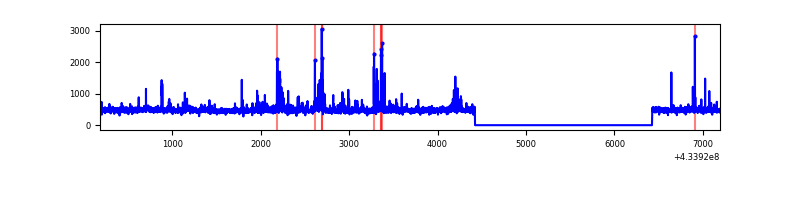 |
| C | 7009 | 5008 | 0 | 0 | 0.00% | 0.00% | 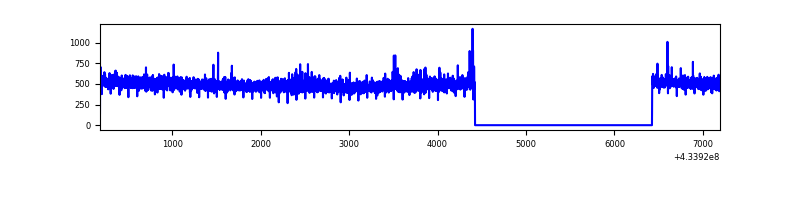 |
| D | 7009 | 5008 | 112 | 112 | 1.60% | 2.24% | 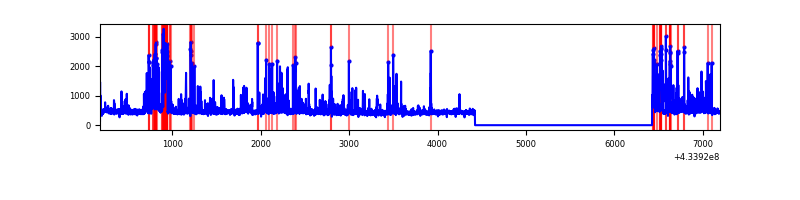 |
Top three noisy pixels from each quadrant. If the there are fewer than three noisy pixels in the level2.evt file, extra rows are filled as -1
| Pixel properties | Quadrant properties | ||||||
|---|---|---|---|---|---|---|---|
| Quadrant | DetID | PixID | Counts | Sigma | Mean | Median | Sigma |
| A | 15 | 237 | 777029 | 6500.53 | 565 | 552 | 119.4 |
| A | 10 | 83 | 576463 | 4821.43 | 565 | 552 | 119.4 |
| A | 12 | 189 | 43202 | 357.06 | 565 | 552 | 119.4 |
| B | 0 | 186 | 76485 | 658.24 | 574 | 557 | 115.3 |
| B | 0 | 189 | 62216 | 534.54 | 574 | 557 | 115.3 |
| B | 0 | 245 | 59857 | 514.09 | 574 | 557 | 115.3 |
| C | 15 | 214 | 216549 | 1608.83 | 561 | 564 | 134.2 |
| C | 3 | 233 | 14365 | 102.8 | 561 | 564 | 134.2 |
| C | 0 | 207 | 12260 | 87.12 | 561 | 564 | 134.2 |
| D | 1 | 47 | 231112 | 1647.59 | 555 | 537 | 139.9 |
| D | 12 | 6 | 182863 | 1302.83 | 555 | 537 | 139.9 |
| D | 13 | 249 | 132435 | 942.49 | 555 | 537 | 139.9 |
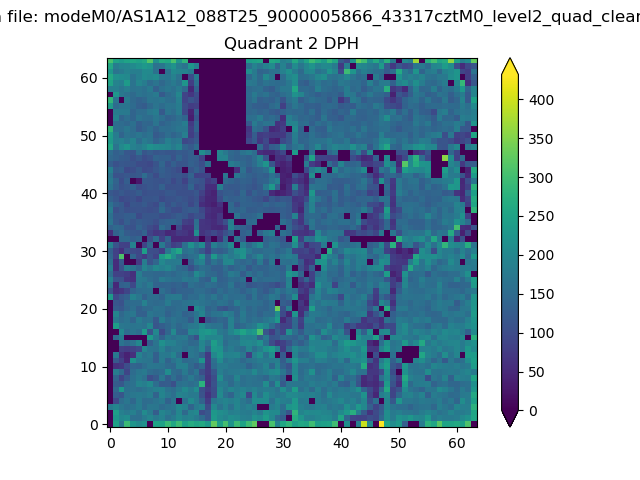
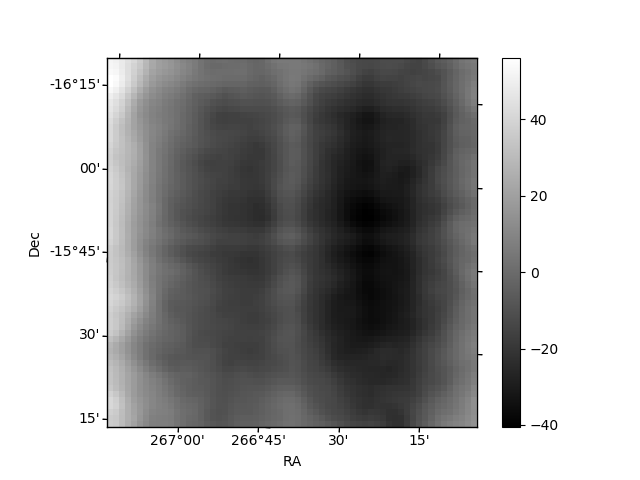
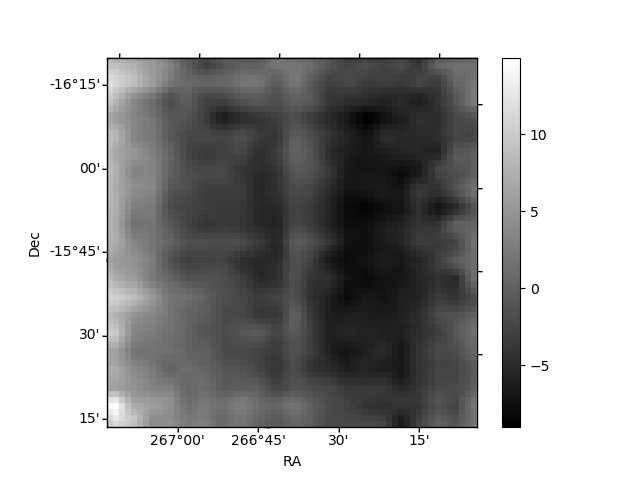
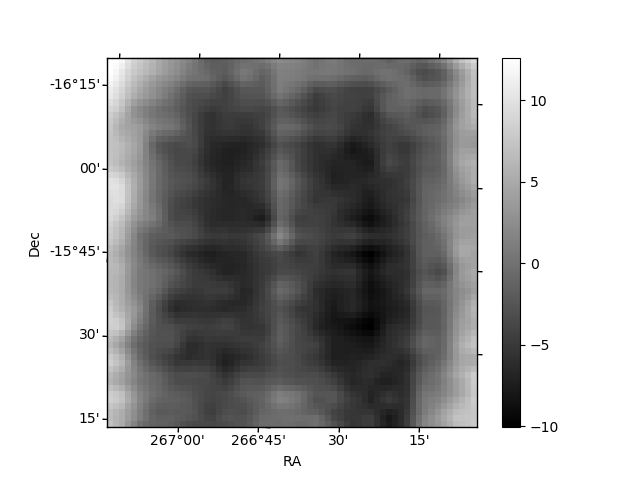
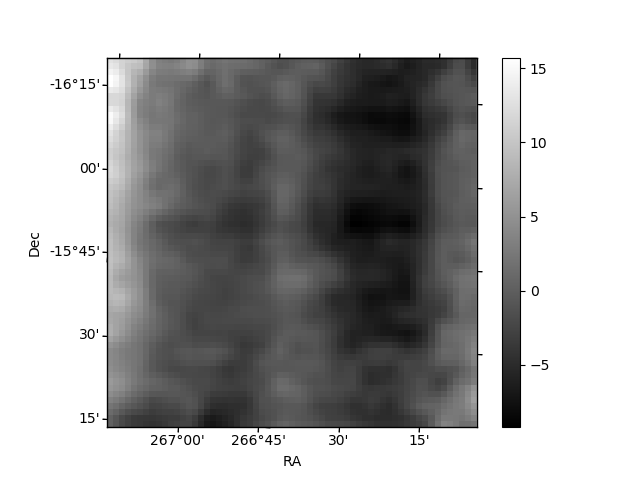
Histogram calculated using DETX and DETY for each event in the final _common_clean file
| Quadrant A | 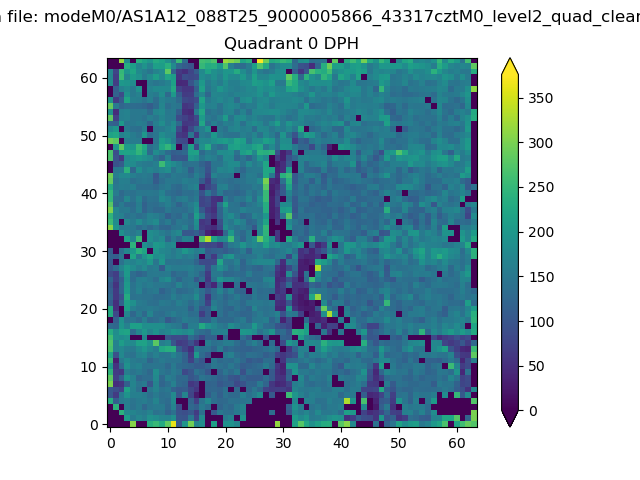 |
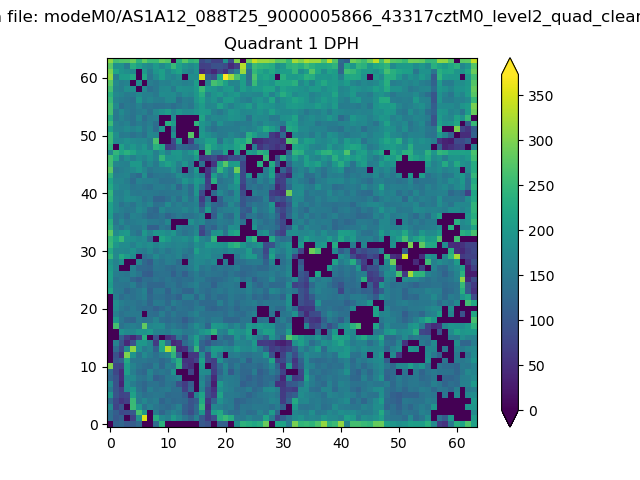 |
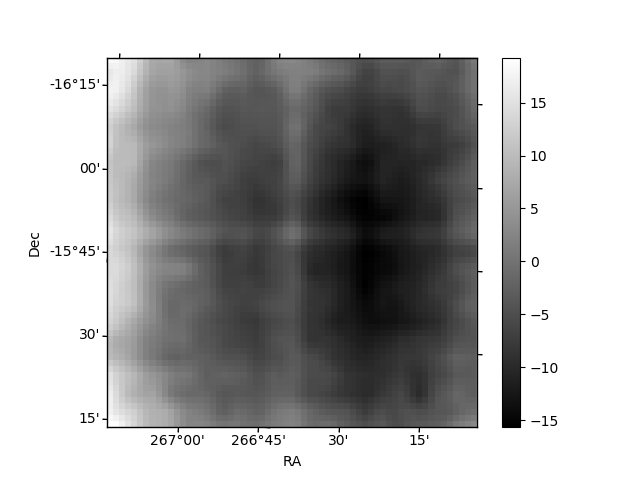
Quadrant B |
|---|---|---|---|
| Quadrant D | 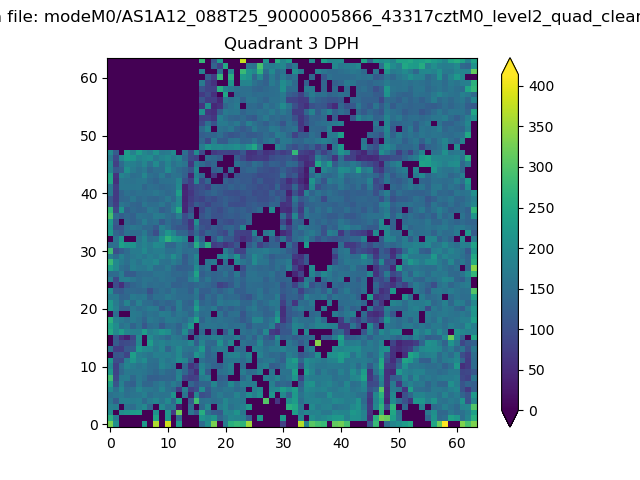 |
 |
Quadrant C |
| Plot type | Count rate plots | Images |
|---|---|---|
| Comparison with Poisson distribution Blue bars denote a histogram of data divided into 1 sec bins. Red curve is a Poisson curve with rate = median count rate of data. |
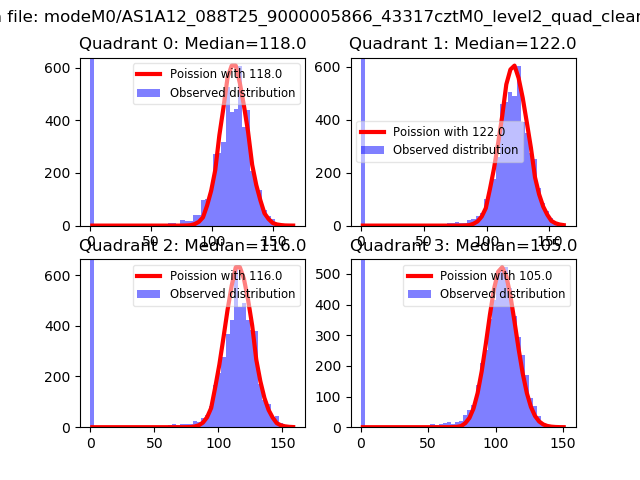 |
 |
| Quadrant-wise count rates Data is divided into 100 sec bins |
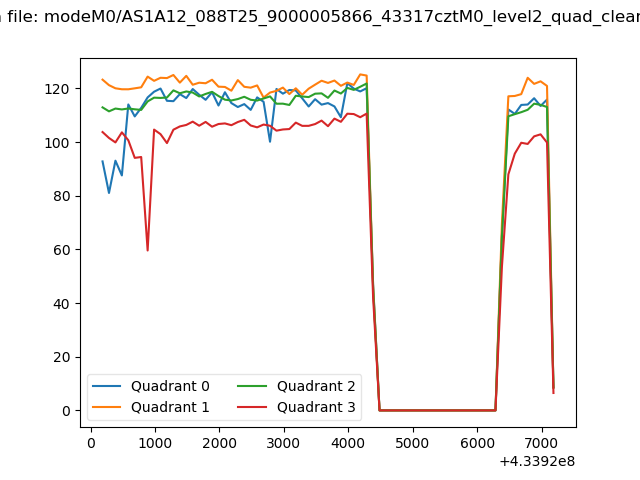 |
|
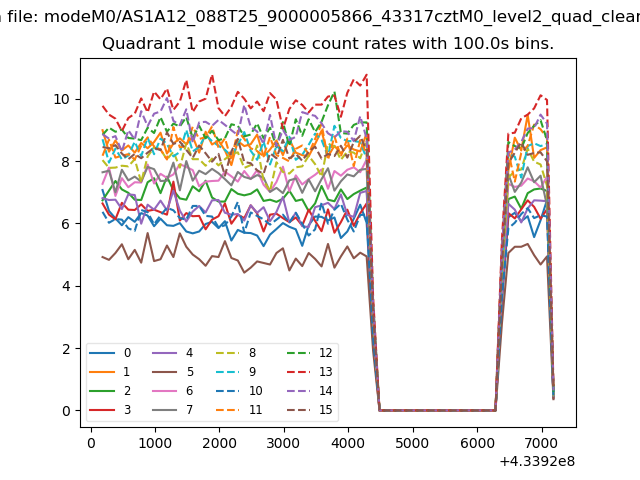
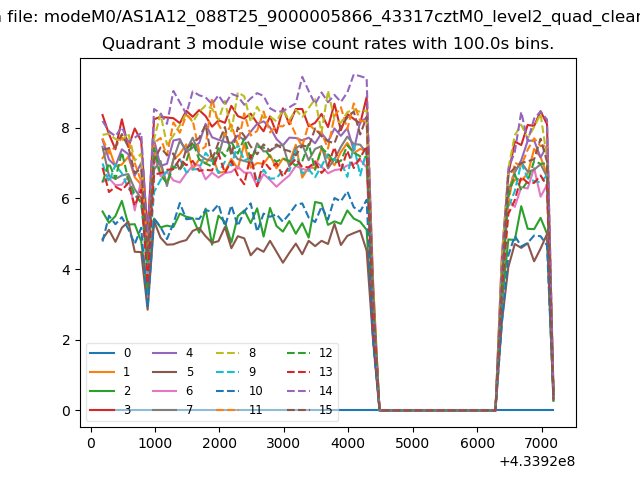
| Module-wise count rates for Quadrant A Data is divided into 100 sec bins |
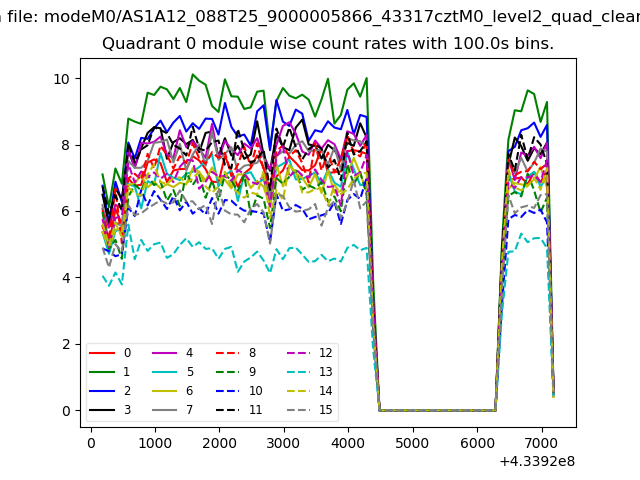 |
 |
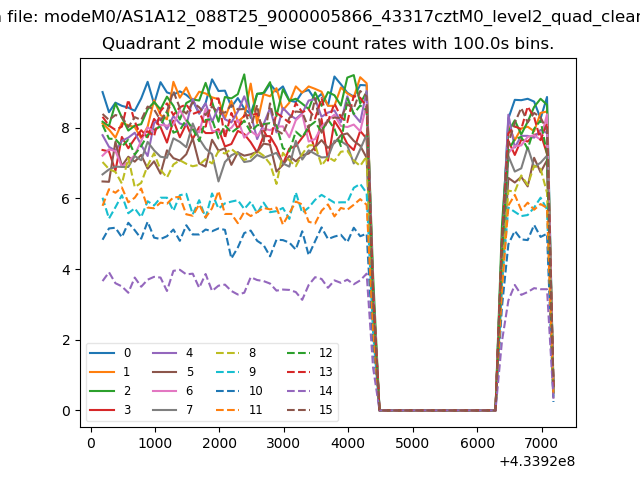
| Module-wise count rates for Quadrant B Data is divided into 100 sec bins |
 |
 |
| Module-wise count rates for Quadrant C Data is divided into 100 sec bins |
 |
 |
| Module-wise count rates for Quadrant D Data is divided into 100 sec bins |
 |
 |
| Parameter | Plot |
|---|---|
| CZT HV Monitor | 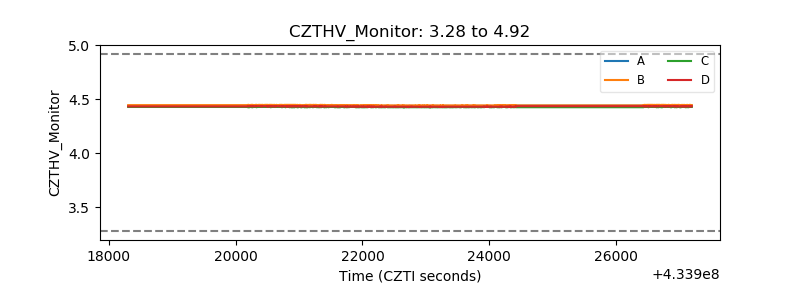 |
| D_VDD | 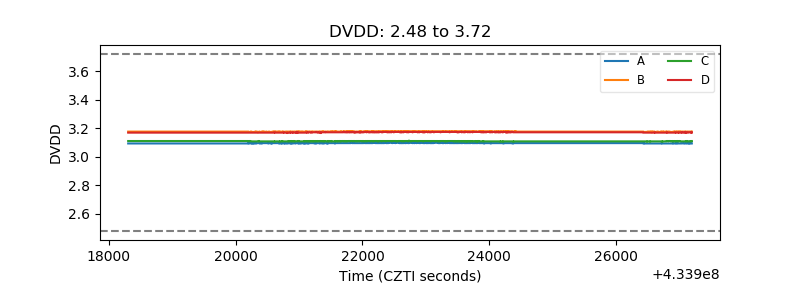 |
| Temperature 1 | 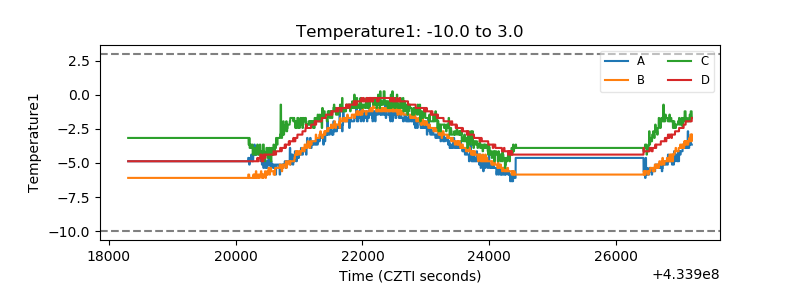 |
| Veto HV Monitor | 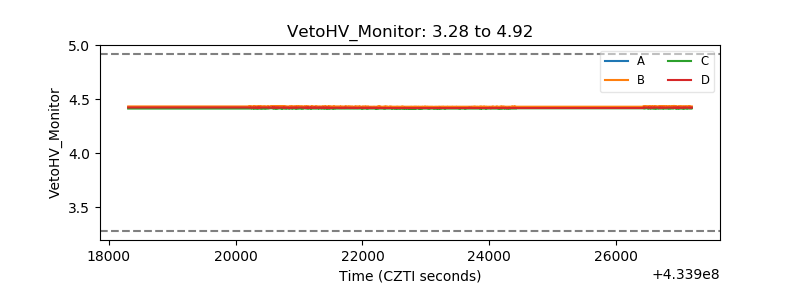 |
| Veto LLD | 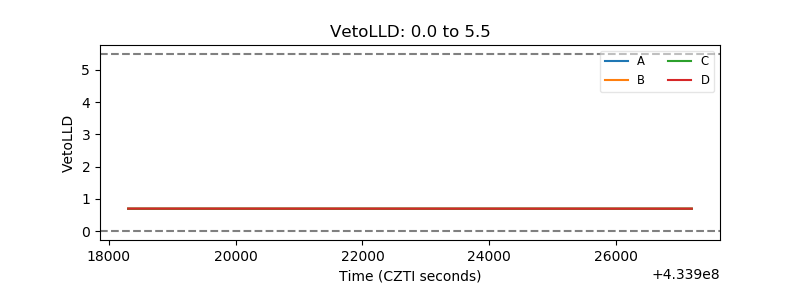 |
| Alpha Counter | 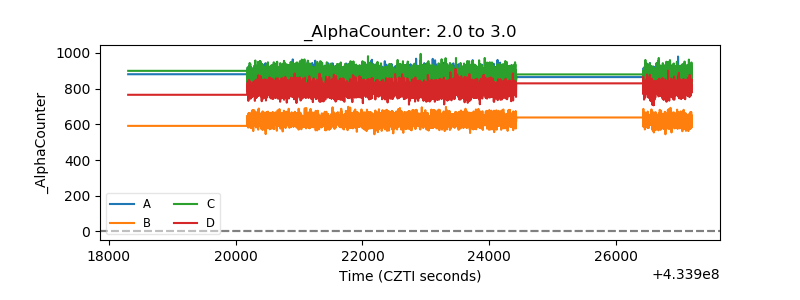 |
| _CPM_Rate | 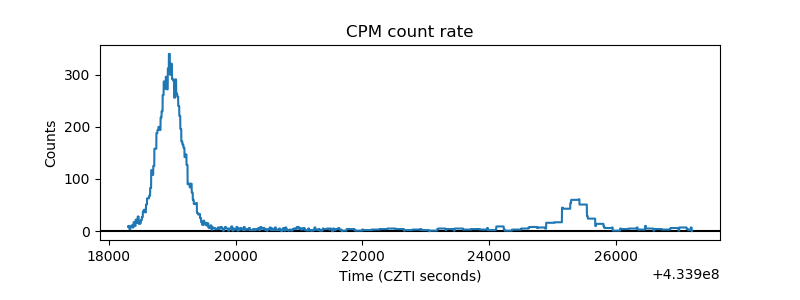 |
| CZT Counter | 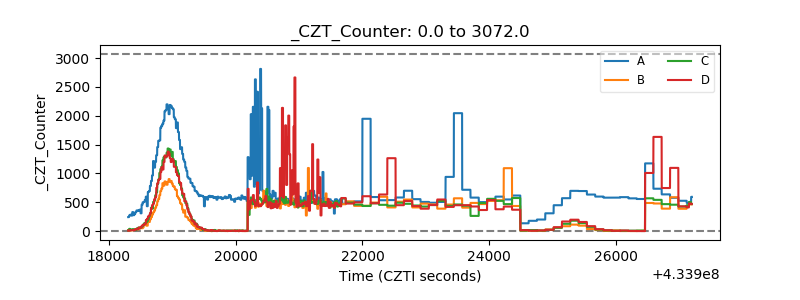 |
| +2.5 Volts monitor | 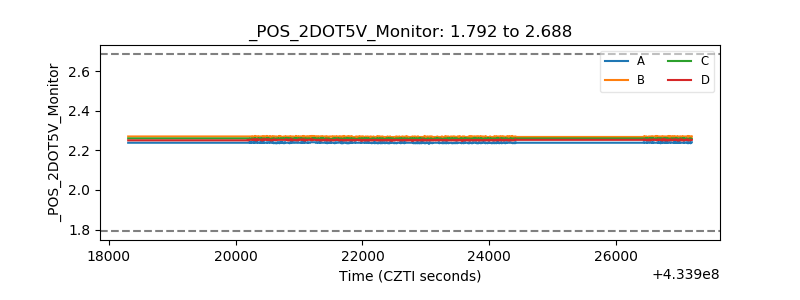 |
| +5 Volts monitor | 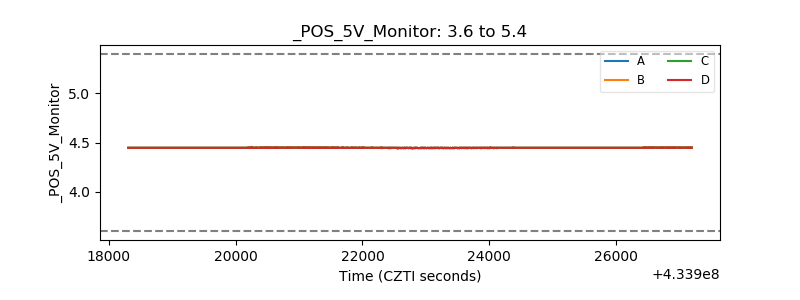 |
| _ROLL_ROT | 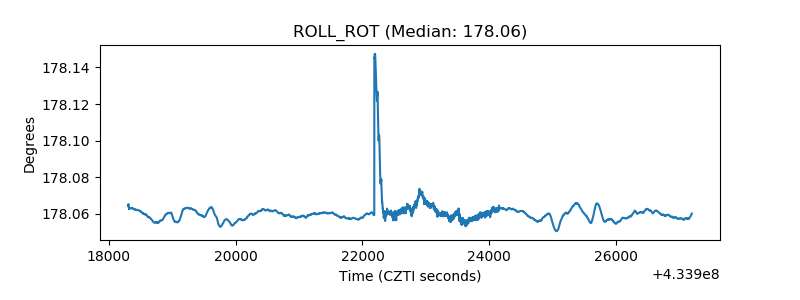 |
| _Roll_DEC | 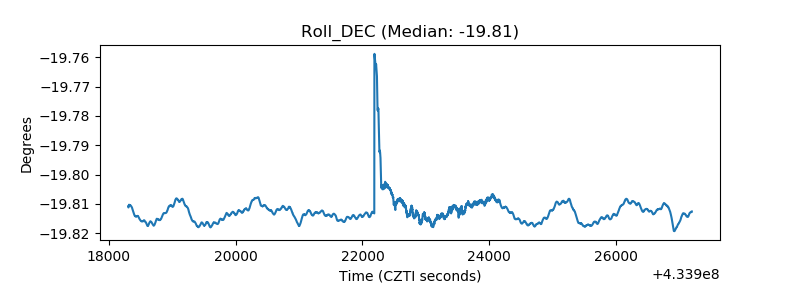 |
| _Roll_RA | 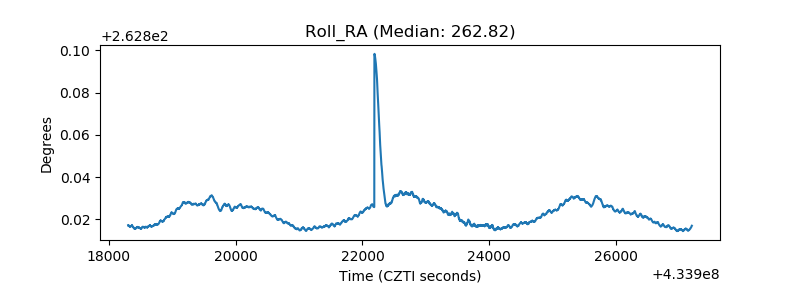 |
| Veto Counter | 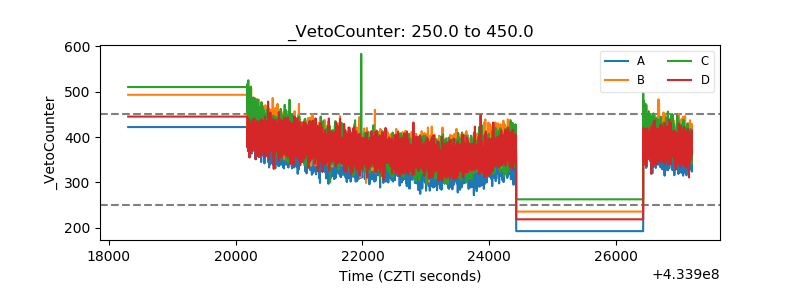 |