| Param | Original file | Final file |
|---|---|---|
| Filename | modeM0/AS1A12_088T25_9000005866_43319cztM0_level2.fits | modeM0/AS1A12_088T25_9000005866_43319cztM0_level2_quad_clean.evt |
| Size (bytes) | 353,131,200 | 94,916,160 |
| Size | 336.8 MB | 90.5 MB |
| Events in quadrant A | 4,102,312 | 618,359 |
| Events in quadrant B | 2,729,885 | 658,397 |
| Events in quadrant C | 2,706,056 | 629,527 |
| Events in quadrant D | 3,092,860 | 571,555 |
| Mode SS | |||
|---|---|---|---|
| Quadrant | BADHDUFLAG | Total packets | Discarded packets |
| A | 0 | 116 | 0 |
| B | 0 | 116 | 0 |
| C | 0 | 116 | 0 |
| D | 0 | 116 | 0 |
| Mode M0 | |||
|---|---|---|---|
| Quadrant | BADHDUFLAG | Total packets | Discarded packets |
| A | 0 | 15679 | 2 |
| B | 0 | 11758 | 2 |
| C | 0 | 11470 | 2 |
| D | 0 | 13015 | 2 |
| Mode M9 | |||
|---|---|---|---|
| Quadrant | BADHDUFLAG | Total packets | Discarded packets |
| A | 0 | 14 | 0 |
| B | 0 | 14 | 0 |
| C | 0 | 14 | 0 |
| D | 0 | 14 | 0 |
| Quadrant | Total seconds | Saturated seconds | Saturation percentage |
|---|---|---|---|
| A | 5658 | 296 | 5.231531% |
| B | 5659 | 23 | 0.406432% |
| C | 5659 | 6 | 0.106026% |
| D | 5659 | 75 | 1.325322% |
Noise dominated data is calculated using 1-second bins in cleaned event files. If a bin has >2000 counts, and if more than 50% of those come from <1% of pixels, then it is considered to be noise-dominated and hence unusable.
| Quadrant | # 1 sec bins | Bins with >0 counts | Bins with >2000 counts | High rate bins dominated by noise | Noise dominated (total time) | Noise dominated (detector-on time) | Marked lightcurve |
|---|---|---|---|---|---|---|---|
| A | 7092 | 5659 | 234 | 234 | 3.30% | 4.14% | 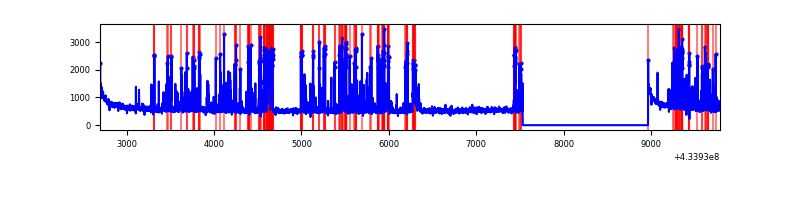 |
| B | 7093 | 5660 | 17 | 17 | 0.24% | 0.30% | 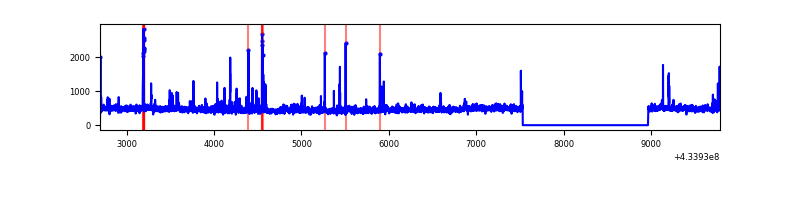 |
| C | 7093 | 5660 | 1 | 1 | 0.01% | 0.02% | 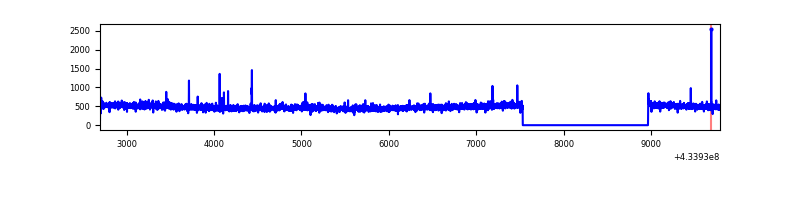 |
| D | 7093 | 5660 | 73 | 73 | 1.03% | 1.29% | 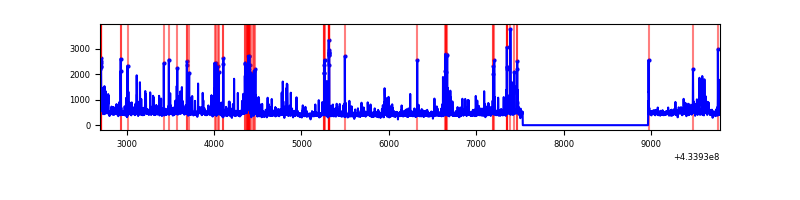 |
Top three noisy pixels from each quadrant. If the there are fewer than three noisy pixels in the level2.evt file, extra rows are filled as -1
| Pixel properties | Quadrant properties | ||||||
|---|---|---|---|---|---|---|---|
| Quadrant | DetID | PixID | Counts | Sigma | Mean | Median | Sigma |
| A | 15 | 237 | 981017 | 7353.76 | 625 | 610 | 133.3 |
| A | 10 | 83 | 648865 | 4862.38 | 625 | 610 | 133.3 |
| A | 12 | 189 | 35098 | 258.69 | 625 | 610 | 133.3 |
| B | 0 | 186 | 66444 | 508.22 | 635 | 614 | 129.5 |
| B | 5 | 172 | 46207 | 351.99 | 635 | 614 | 129.5 |
| B | 0 | 190 | 43194 | 328.73 | 635 | 614 | 129.5 |
| C | 15 | 214 | 239254 | 1603.75 | 619 | 622 | 148.8 |
| C | 3 | 233 | 33766 | 222.75 | 619 | 622 | 148.8 |
| C | 14 | 254 | 8333 | 51.82 | 619 | 622 | 148.8 |
| D | 2 | 249 | 222216 | 1428.37 | 617 | 597 | 155.2 |
| D | 1 | 52 | 199435 | 1281.55 | 617 | 597 | 155.2 |
| D | 12 | 6 | 76276 | 487.76 | 617 | 597 | 155.2 |
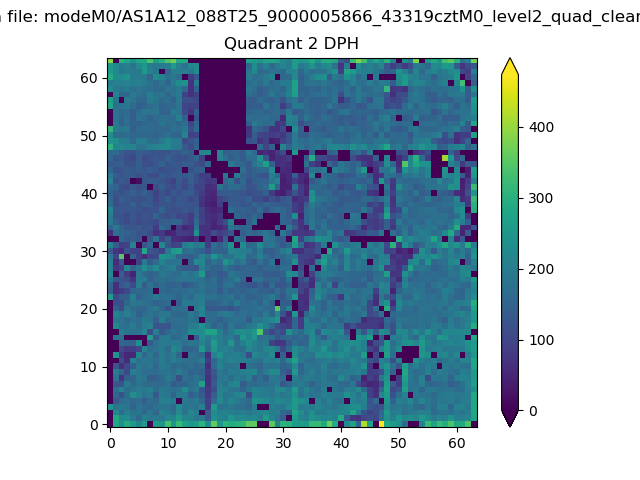
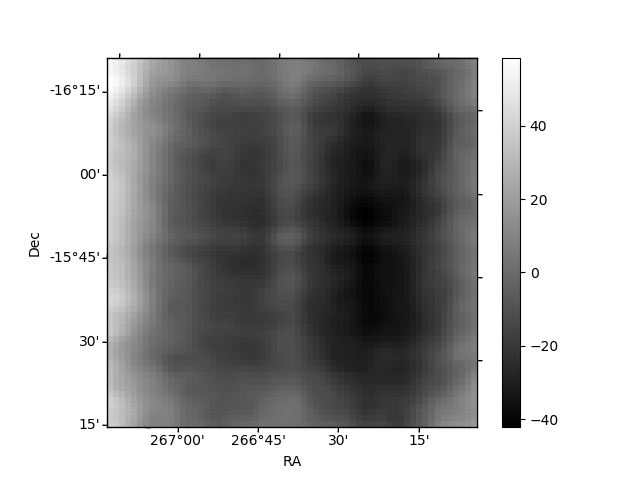
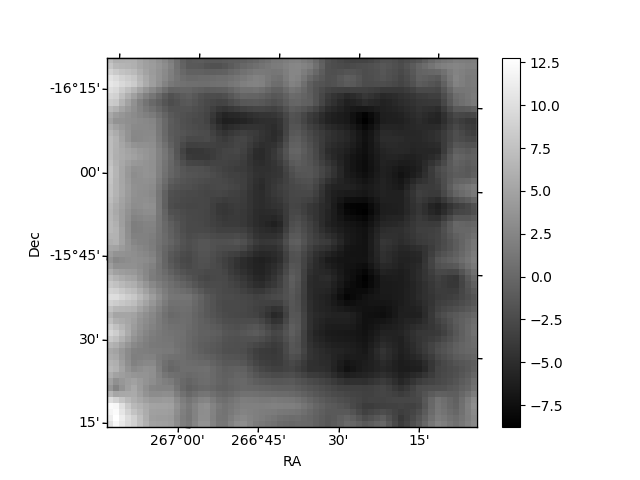
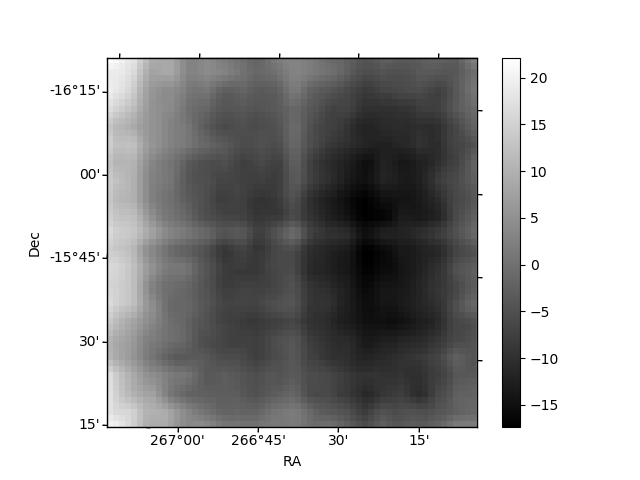
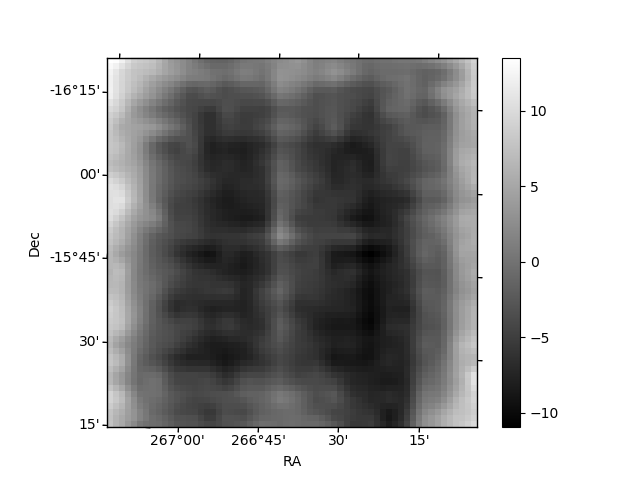
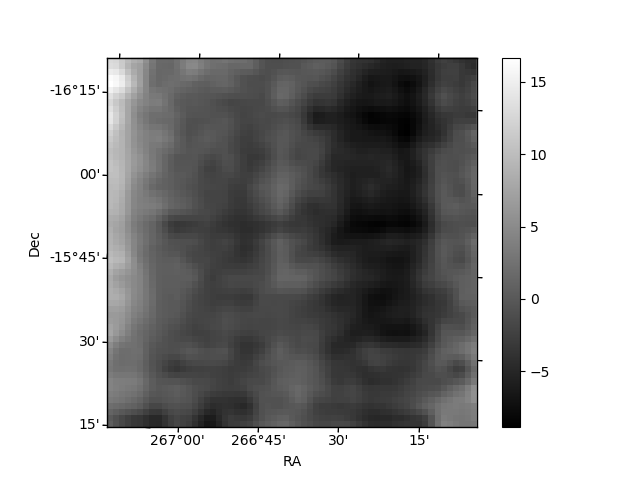
Histogram calculated using DETX and DETY for each event in the final _common_clean file
| Quadrant A | 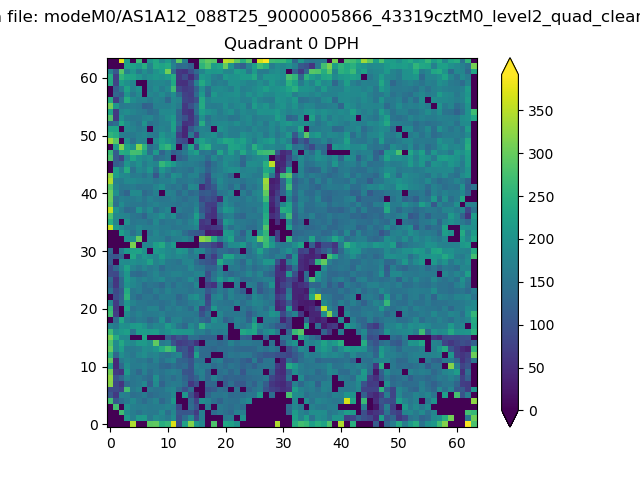 |
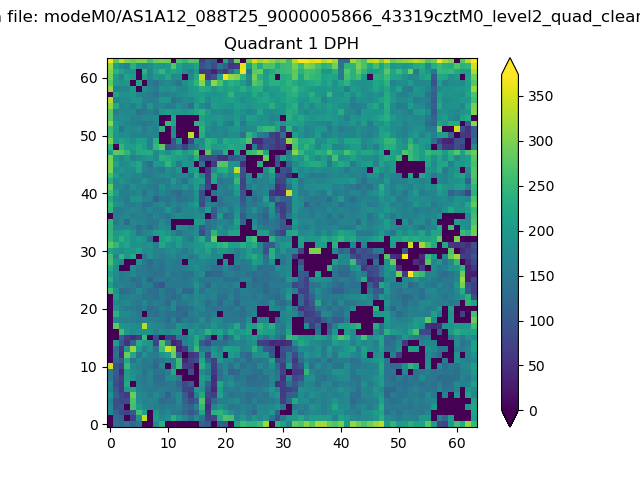 |
Quadrant B |
|---|---|---|---|
| Quadrant D | 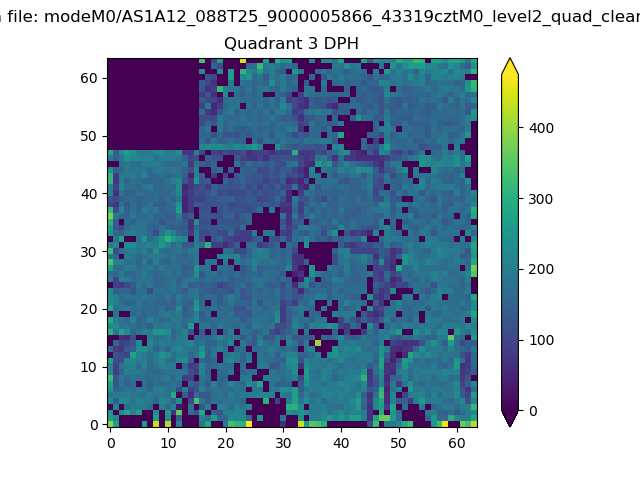 |
 |
Quadrant C |
| Plot type | Count rate plots | Images |
|---|---|---|
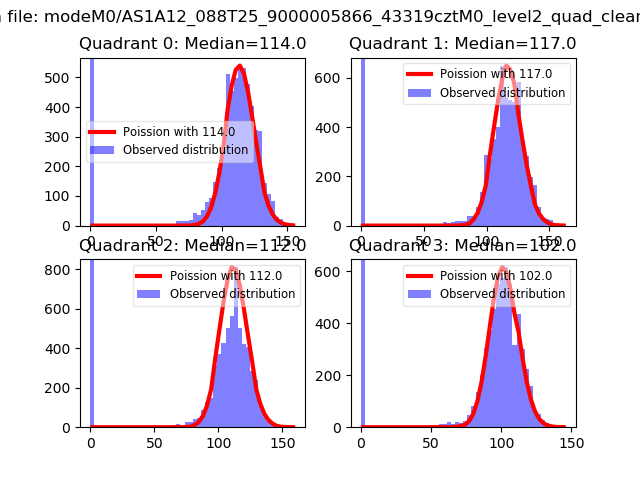
| Comparison with Poisson distribution Blue bars denote a histogram of data divided into 1 sec bins. Red curve is a Poisson curve with rate = median count rate of data. |
 |
 |
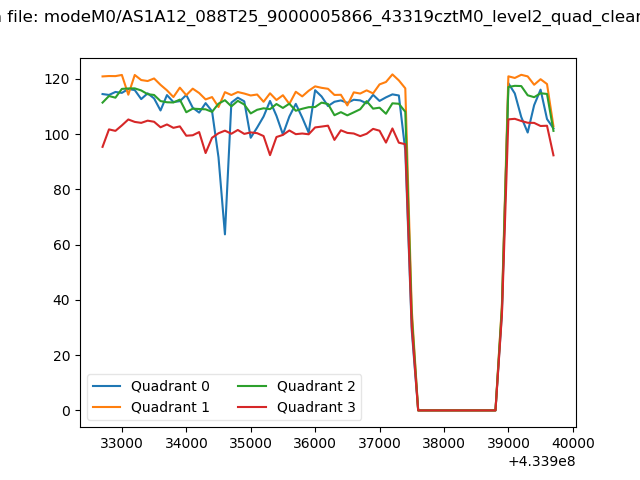
| Quadrant-wise count rates Data is divided into 100 sec bins |
 |
|
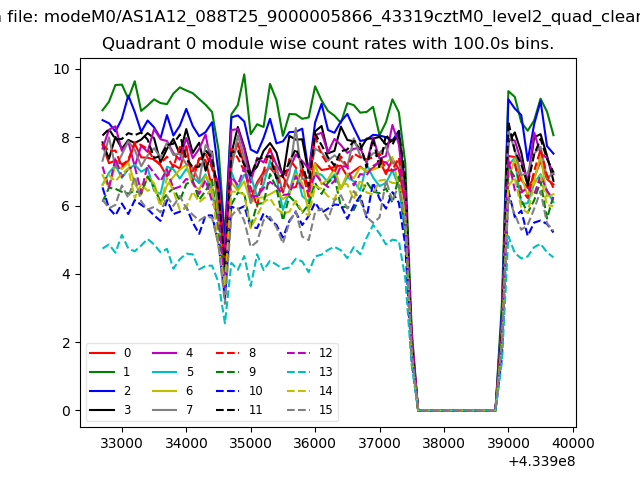
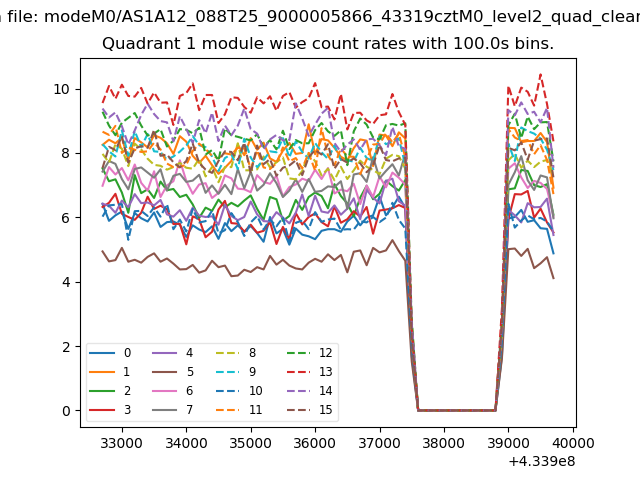
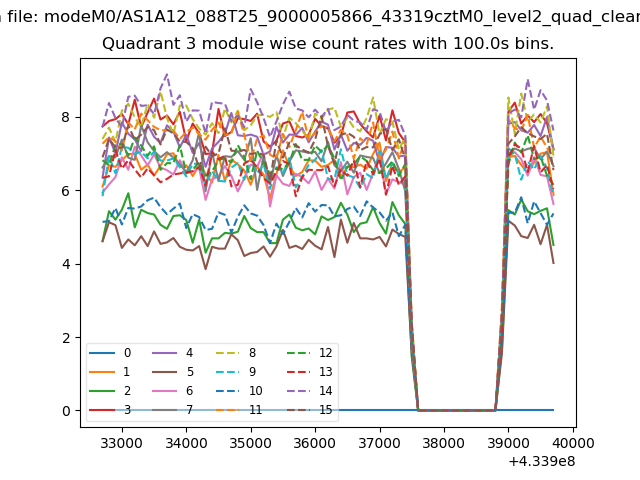
| Module-wise count rates for Quadrant A Data is divided into 100 sec bins |
 |
 |
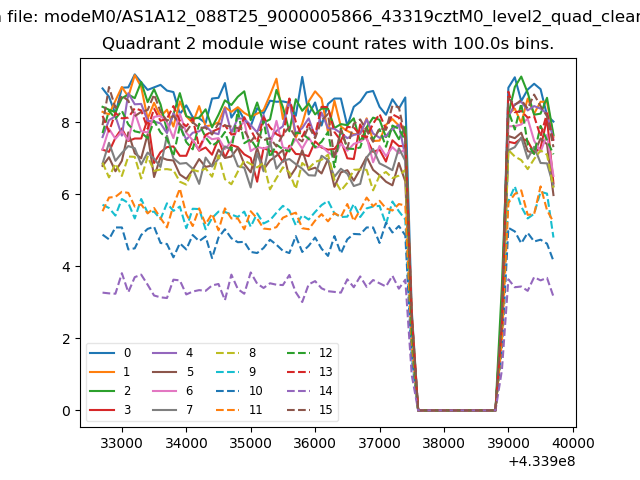
| Module-wise count rates for Quadrant B Data is divided into 100 sec bins |
 |
 |
| Module-wise count rates for Quadrant C Data is divided into 100 sec bins |
 |
 |
| Module-wise count rates for Quadrant D Data is divided into 100 sec bins |
 |
 |
| Parameter | Plot |
|---|---|
| CZT HV Monitor | 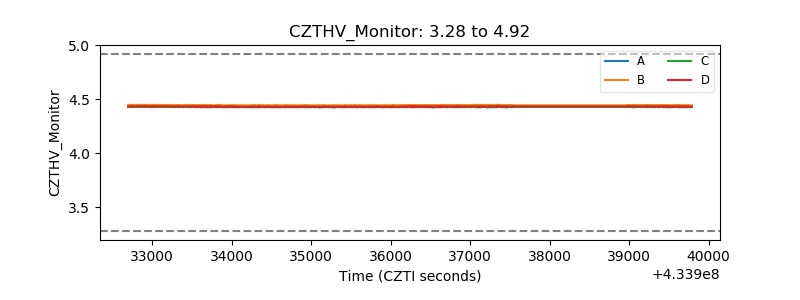 |
| D_VDD | 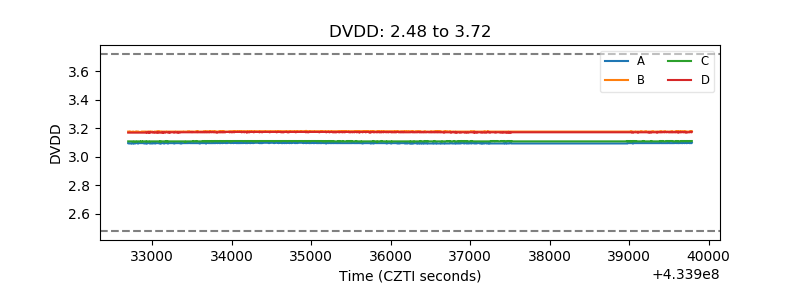 |
| Temperature 1 | 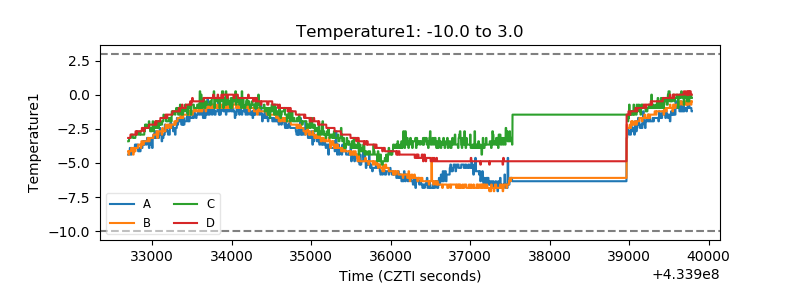 |
| Veto HV Monitor | 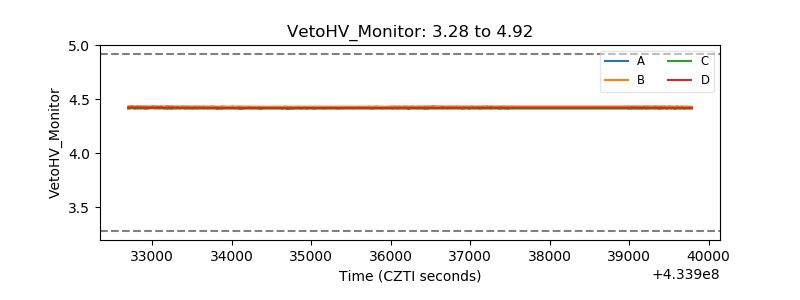 |
| Veto LLD | 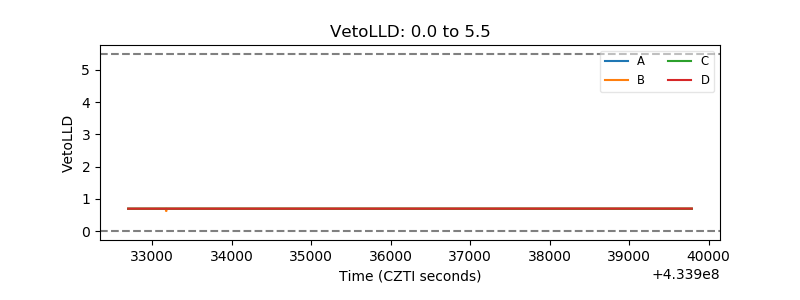 |
| Alpha Counter | 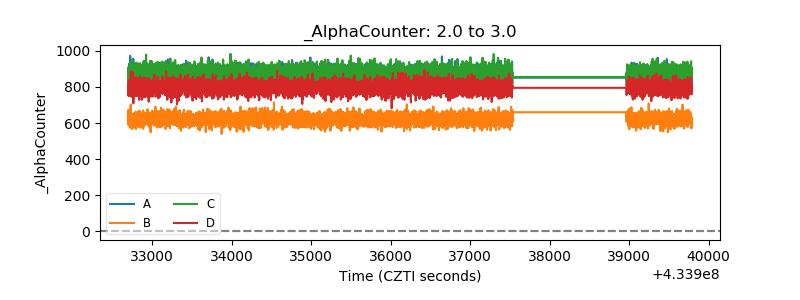 |
| _CPM_Rate | 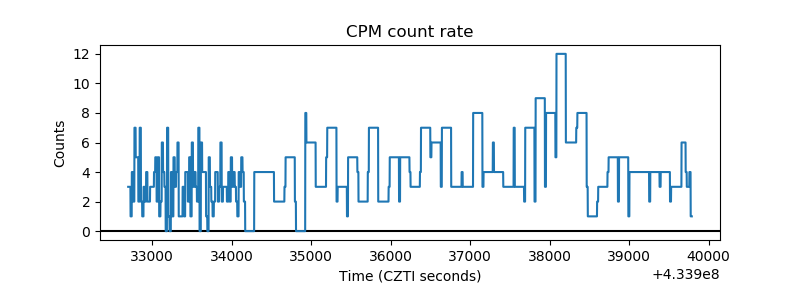 |
| CZT Counter | 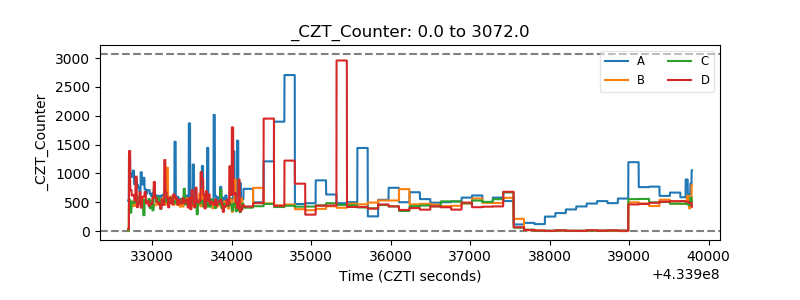 |
| +2.5 Volts monitor | 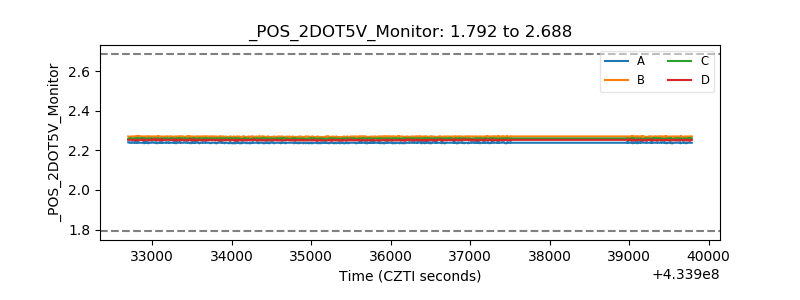 |
| +5 Volts monitor | 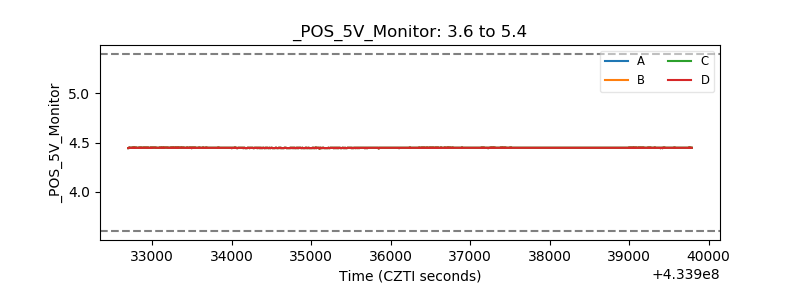 |
| _ROLL_ROT | 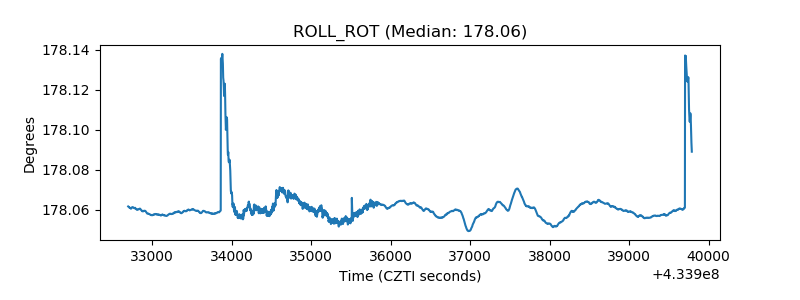 |
| _Roll_DEC | 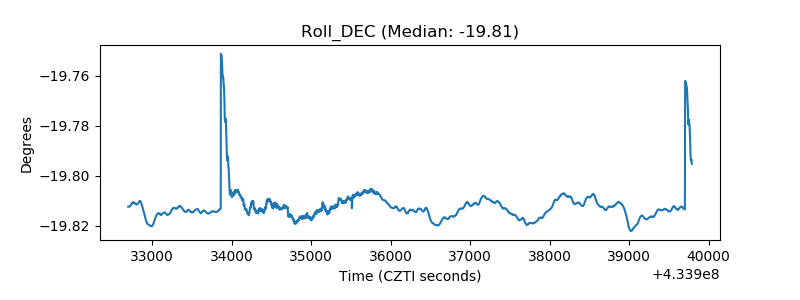 |
| _Roll_RA | 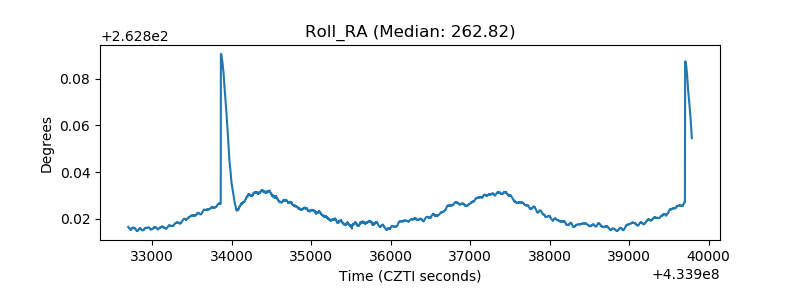 |
| Veto Counter | 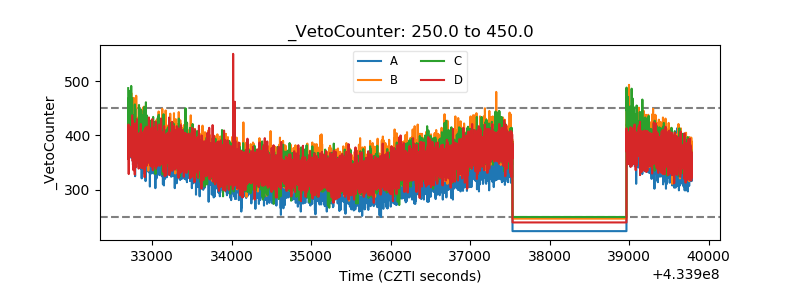 |