| Param | Original file | Final file |
|---|---|---|
| Filename | modeM0/AS1A12_088T25_9000005866_43320cztM0_level2.fits | modeM0/AS1A12_088T25_9000005866_43320cztM0_level2_quad_clean.evt |
| Size (bytes) | 366,085,440 | 99,449,280 |
| Size | 349.1 MB | 94.8 MB |
| Events in quadrant A | 3,762,211 | 663,742 |
| Events in quadrant B | 3,024,576 | 685,992 |
| Events in quadrant C | 2,899,276 | 653,782 |
| Events in quadrant D | 3,401,058 | 590,910 |
| Mode SS | |||
|---|---|---|---|
| Quadrant | BADHDUFLAG | Total packets | Discarded packets |
| A | 0 | 122 | 0 |
| B | 0 | 122 | 0 |
| C | 0 | 122 | 0 |
| D | 0 | 122 | 0 |
| Mode M0 | |||
|---|---|---|---|
| Quadrant | BADHDUFLAG | Total packets | Discarded packets |
| A | 0 | 14743 | 4 |
| B | 0 | 12856 | 2 |
| C | 0 | 12168 | 2 |
| D | 0 | 14278 | 2 |
| Mode M9 | |||
|---|---|---|---|
| Quadrant | BADHDUFLAG | Total packets | Discarded packets |
| A | 0 | 23 | 0 |
| B | 0 | 24 | 0 |
| C | 0 | 24 | 0 |
| D | 0 | 24 | 0 |
| Quadrant | Total seconds | Saturated seconds | Saturation percentage |
|---|---|---|---|
| A | 5965 | 119 | 1.994971% |
| B | 5965 | 18 | 0.301760% |
| C | 5965 | 8 | 0.134116% |
| D | 5965 | 158 | 2.648785% |
Noise dominated data is calculated using 1-second bins in cleaned event files. If a bin has >2000 counts, and if more than 50% of those come from <1% of pixels, then it is considered to be noise-dominated and hence unusable.
| Quadrant | # 1 sec bins | Bins with >0 counts | Bins with >2000 counts | High rate bins dominated by noise | Noise dominated (total time) | Noise dominated (detector-on time) | Marked lightcurve |
|---|---|---|---|---|---|---|---|
| A | 7277 | 5966 | 88 | 88 | 1.21% | 1.48% | 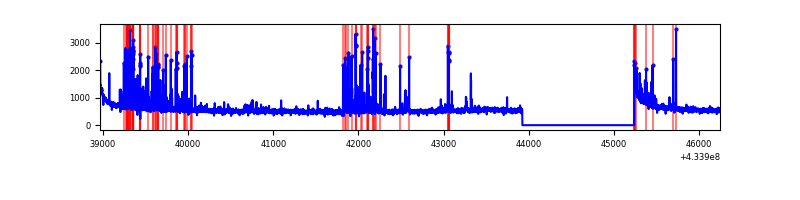 |
| B | 7277 | 5966 | 3 | 3 | 0.04% | 0.05% | 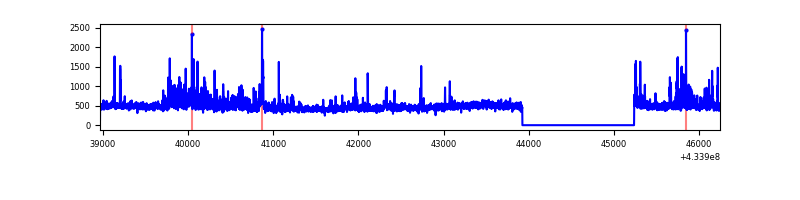 |
| C | 7277 | 5966 | 2 | 2 | 0.03% | 0.03% | 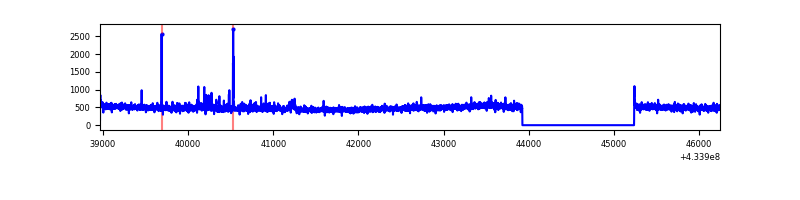 |
| D | 7277 | 5966 | 139 | 139 | 1.91% | 2.33% | 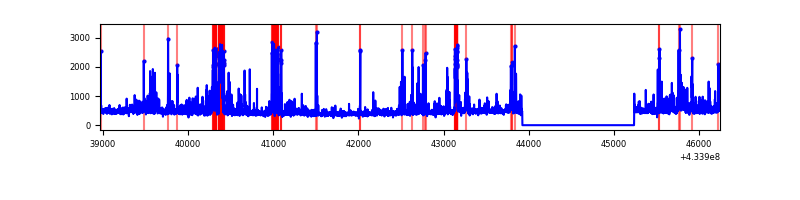 |
Top three noisy pixels from each quadrant. If the there are fewer than three noisy pixels in the level2.evt file, extra rows are filled as -1
| Pixel properties | Quadrant properties | ||||||
|---|---|---|---|---|---|---|---|
| Quadrant | DetID | PixID | Counts | Sigma | Mean | Median | Sigma |
| A | 10 | 83 | 685707 | 4893.2 | 661 | 644 | 140.0 |
| A | 15 | 237 | 425962 | 3037.92 | 661 | 644 | 140.0 |
| A | 12 | 189 | 72123 | 510.55 | 661 | 644 | 140.0 |
| B | 0 | 190 | 154035 | 1150.09 | 664 | 645 | 133.4 |
| B | 0 | 186 | 115740 | 862.96 | 664 | 645 | 133.4 |
| B | 0 | 245 | 47468 | 351.07 | 664 | 645 | 133.4 |
| C | 15 | 214 | 250372 | 1614.26 | 647 | 649 | 154.7 |
| C | 3 | 233 | 102525 | 658.55 | 647 | 649 | 154.7 |
| C | 12 | 2 | 11768 | 71.88 | 647 | 649 | 154.7 |
| D | 10 | 118 | 229108 | 1410.08 | 643 | 623 | 162.0 |
| D | 2 | 249 | 198292 | 1219.9 | 643 | 623 | 162.0 |
| D | 12 | 6 | 166556 | 1024.05 | 643 | 623 | 162.0 |
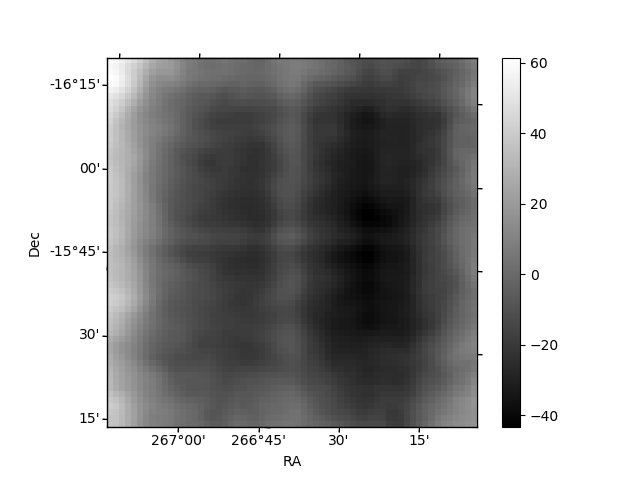
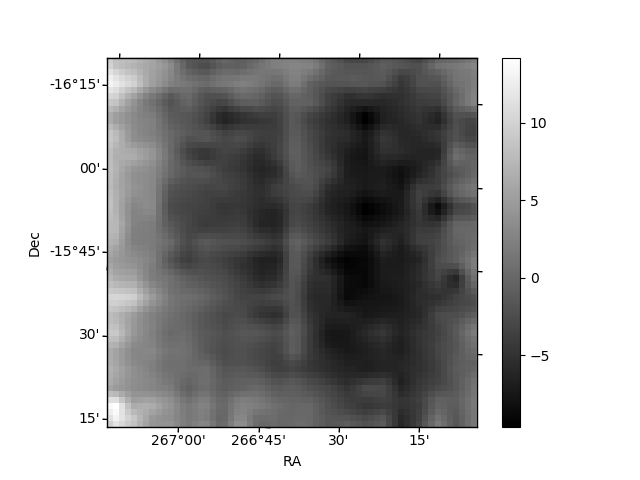
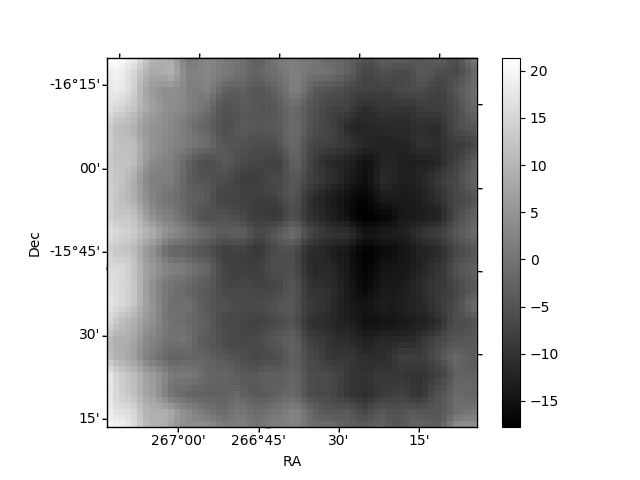
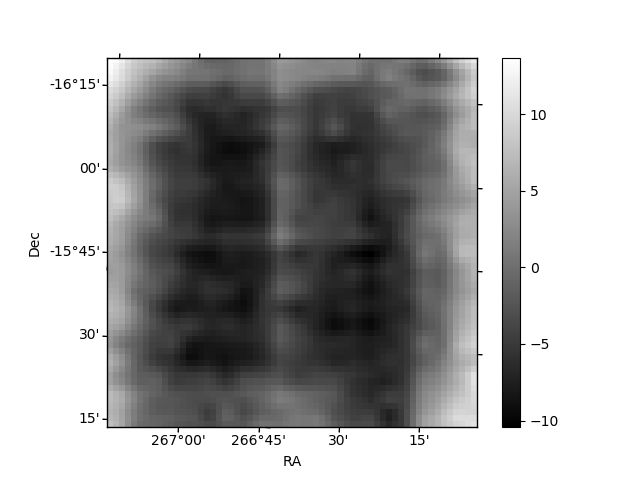
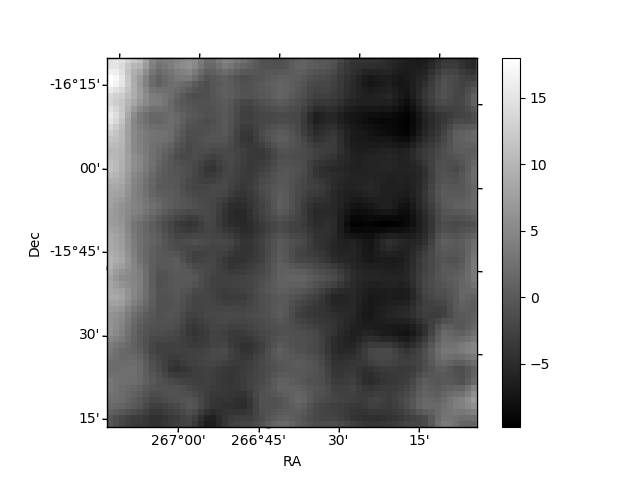
Histogram calculated using DETX and DETY for each event in the final _common_clean file
| Quadrant A | 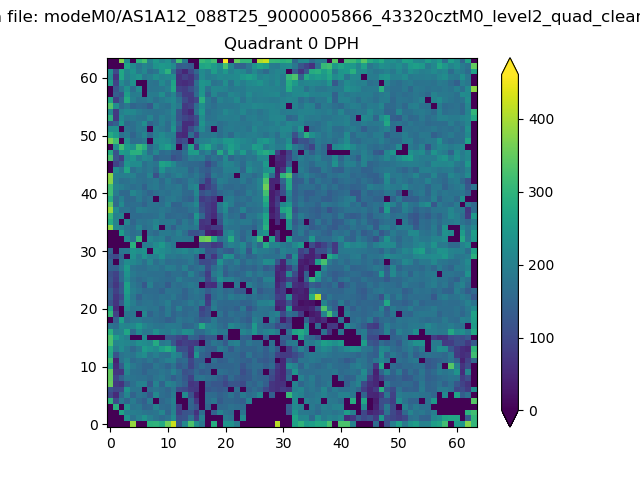 |
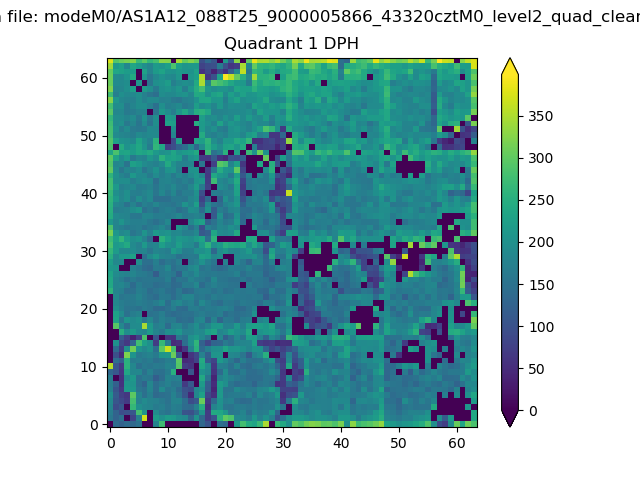 |
Quadrant B |
|---|---|---|---|
| Quadrant D | 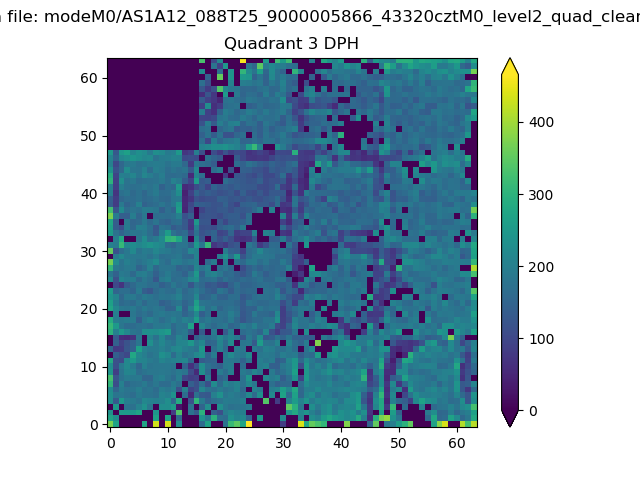 |
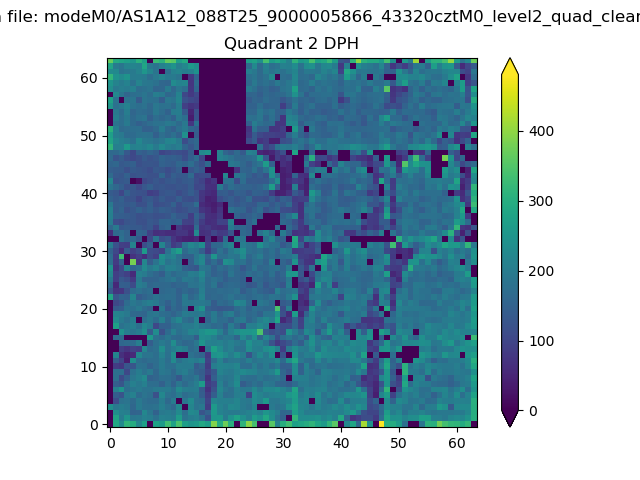 |
Quadrant C |
| Plot type | Count rate plots | Images |
|---|---|---|
| Comparison with Poisson distribution Blue bars denote a histogram of data divided into 1 sec bins. Red curve is a Poisson curve with rate = median count rate of data. |
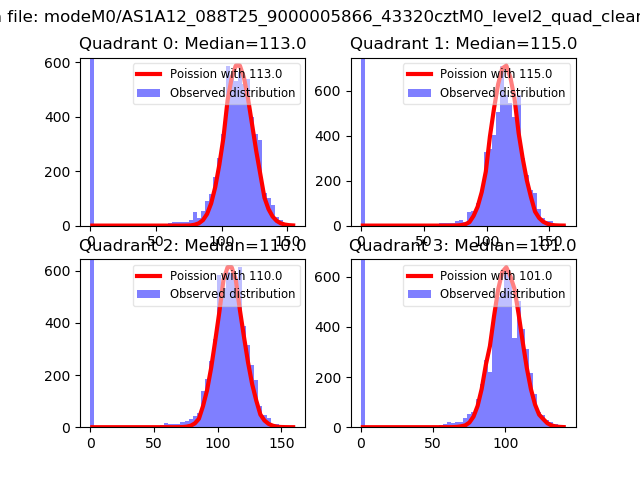 |
 |
| Quadrant-wise count rates Data is divided into 100 sec bins |
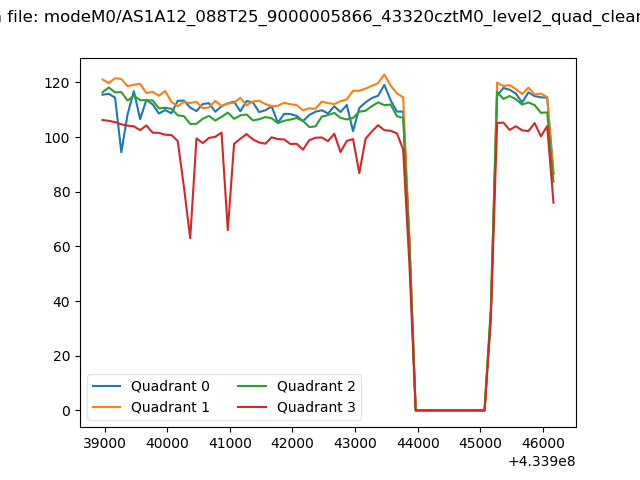 |
|
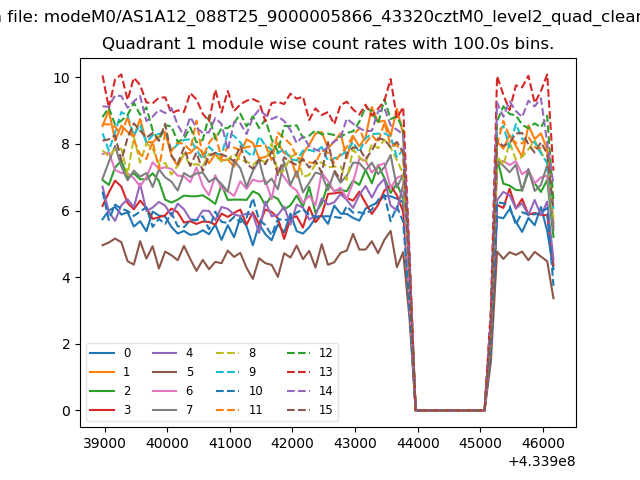
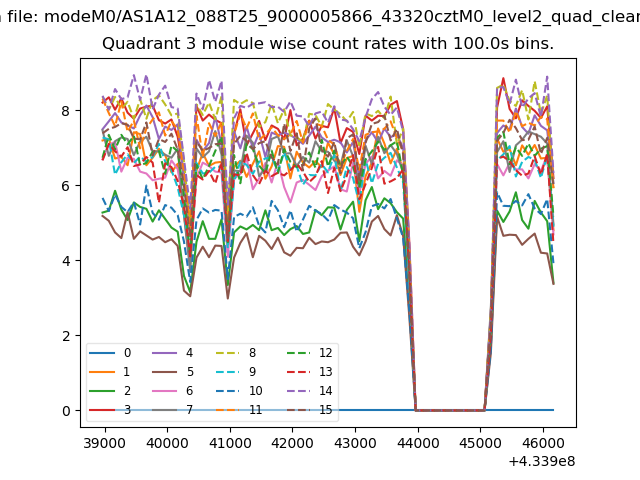
| Module-wise count rates for Quadrant A Data is divided into 100 sec bins |
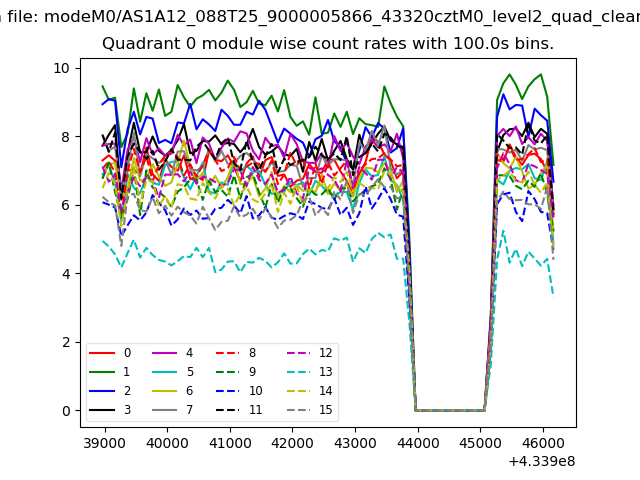 |
 |
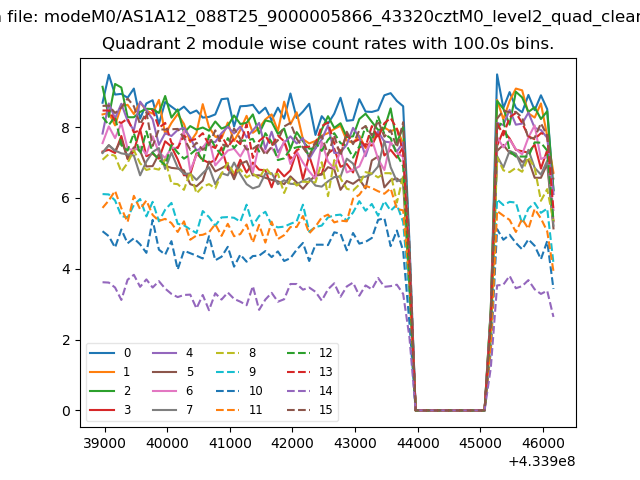
| Module-wise count rates for Quadrant B Data is divided into 100 sec bins |
 |
 |
| Module-wise count rates for Quadrant C Data is divided into 100 sec bins |
 |
 |
| Module-wise count rates for Quadrant D Data is divided into 100 sec bins |
 |
 |
| Parameter | Plot |
|---|---|
| CZT HV Monitor | 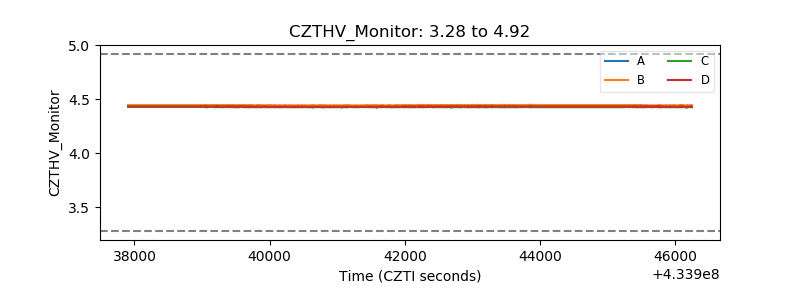 |
| D_VDD | 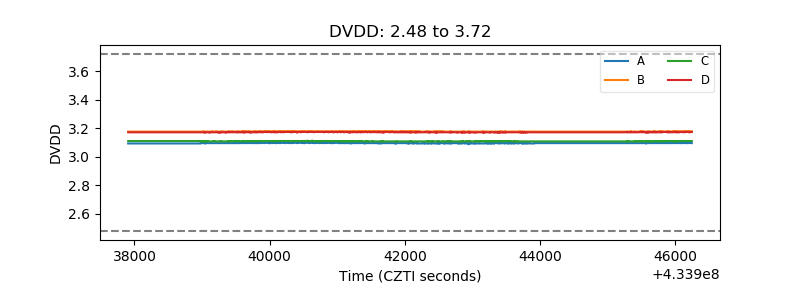 |
| Temperature 1 | 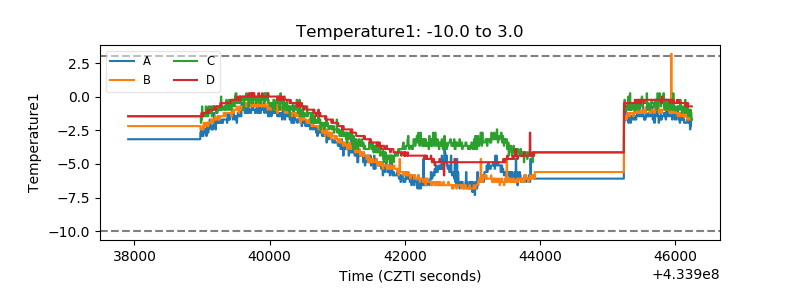 |
| Veto HV Monitor | 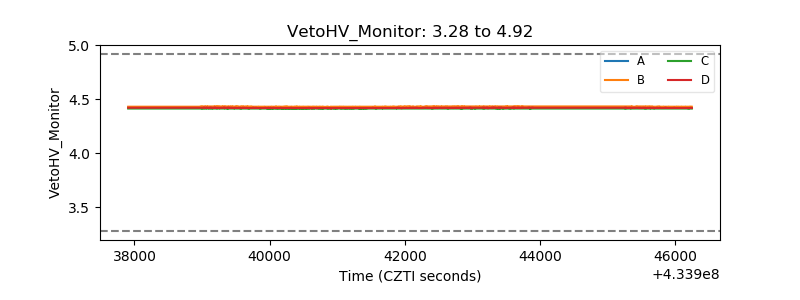 |
| Veto LLD | 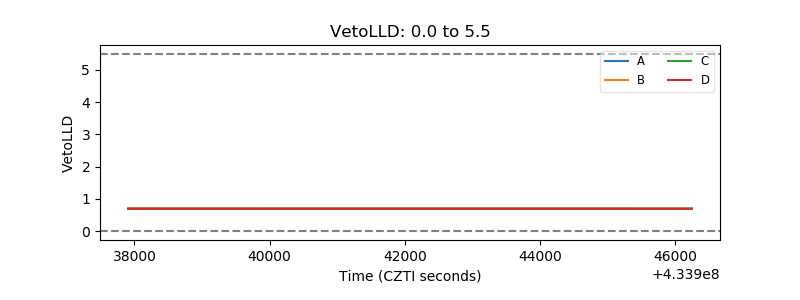 |
| Alpha Counter | 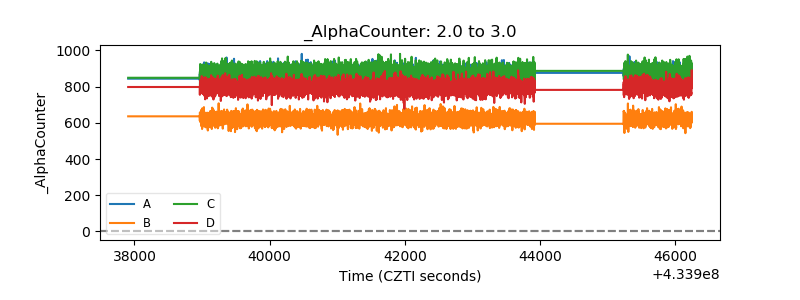 |
| _CPM_Rate | 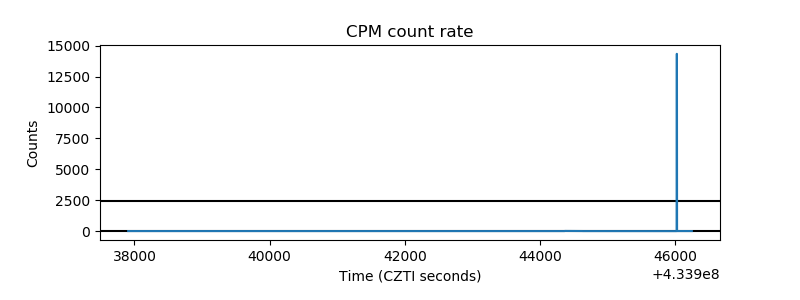 |
| CZT Counter |  |
| +2.5 Volts monitor | 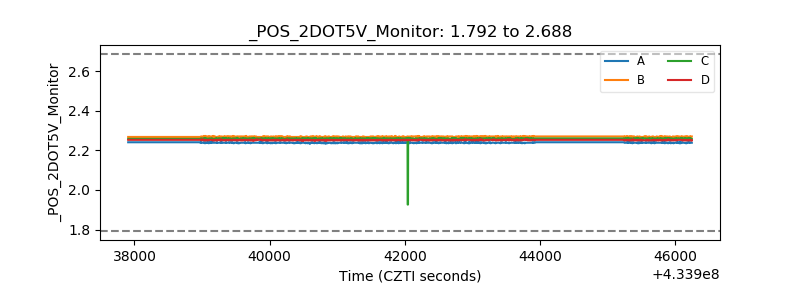 |
| +5 Volts monitor | 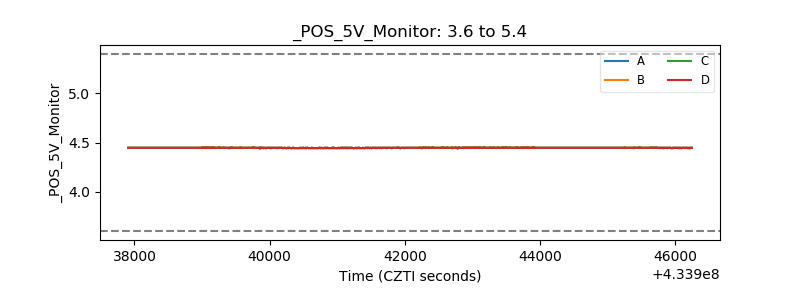 |
| _ROLL_ROT | 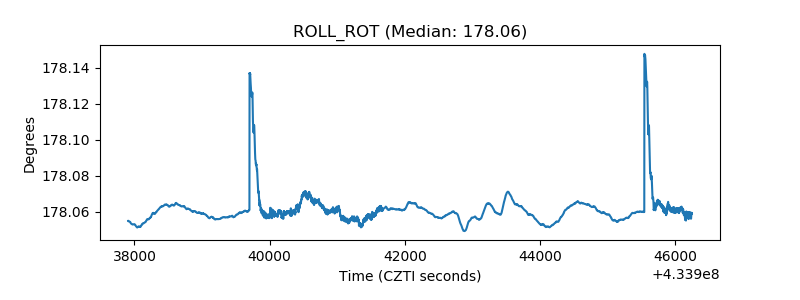 |
| _Roll_DEC | 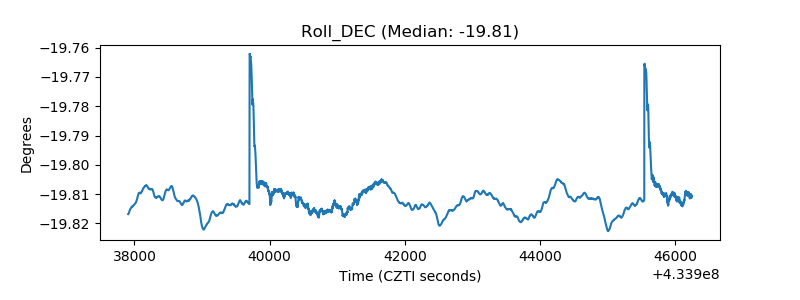 |
| _Roll_RA | 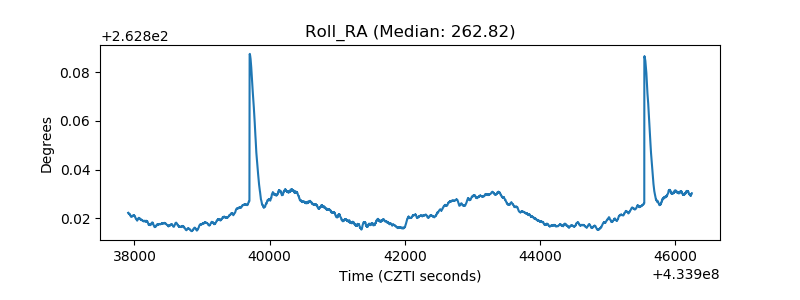 |
| Veto Counter | 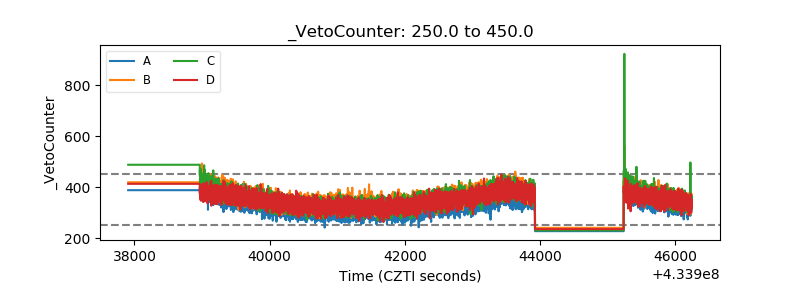 |