| Param | Original file | Final file |
|---|---|---|
| Filename | modeM0/AS1A12_088T25_9000005866_43326cztM0_level2.fits | modeM0/AS1A12_088T25_9000005866_43326cztM0_level2_quad_clean.evt |
| Size (bytes) | 117,558,720 | 31,829,760 |
| Size | 112.1 MB | 30.4 MB |
| Events in quadrant A | 1,126,009 | 213,607 |
| Events in quadrant B | 934,065 | 215,849 |
| Events in quadrant C | 920,262 | 208,206 |
| Events in quadrant D | 1,222,170 | 188,874 |
| Mode SS | |||
|---|---|---|---|
| Quadrant | BADHDUFLAG | Total packets | Discarded packets |
| A | 0 | 38 | 0 |
| B | 0 | 38 | 0 |
| C | 0 | 38 | 0 |
| D | 0 | 38 | 0 |
| Mode M0 | |||
|---|---|---|---|
| Quadrant | BADHDUFLAG | Total packets | Discarded packets |
| A | 0 | 4474 | 1 |
| B | 0 | 4056 | 1 |
| C | 0 | 3848 | 1 |
| D | 0 | 4926 | 1 |
| Mode M9 | |||
|---|---|---|---|
| Quadrant | BADHDUFLAG | Total packets | Discarded packets |
| A | 0 | 2 | 0 |
| B | 0 | 3 | 0 |
| C | 0 | 3 | 0 |
| D | 0 | 3 | 0 |
| Quadrant | Total seconds | Saturated seconds | Saturation percentage |
|---|---|---|---|
| A | 1883 | 18 | 0.955921% |
| B | 1883 | 8 | 0.424854% |
| C | 1883 | 2 | 0.106213% |
| D | 1883 | 44 | 2.336697% |
Noise dominated data is calculated using 1-second bins in cleaned event files. If a bin has >2000 counts, and if more than 50% of those come from <1% of pixels, then it is considered to be noise-dominated and hence unusable.
| Quadrant | # 1 sec bins | Bins with >0 counts | Bins with >2000 counts | High rate bins dominated by noise | Noise dominated (total time) | Noise dominated (detector-on time) | Marked lightcurve |
|---|---|---|---|---|---|---|---|
| A | 1883 | 1883 | 9 | 9 | 0.48% | 0.48% | 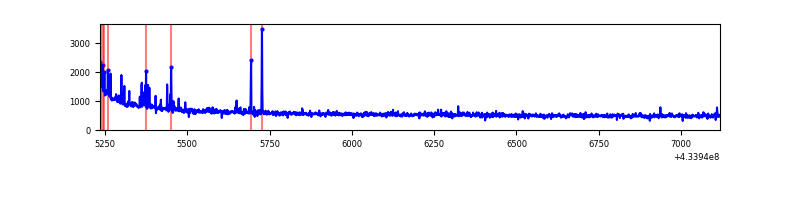 |
| B | 1883 | 1883 | 1 | 1 | 0.05% | 0.05% | 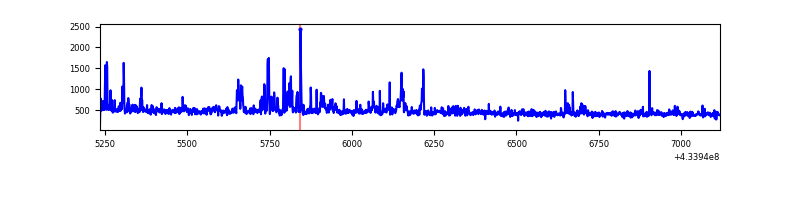 |
| C | 1883 | 1883 | 0 | 0 | 0.00% | 0.00% | 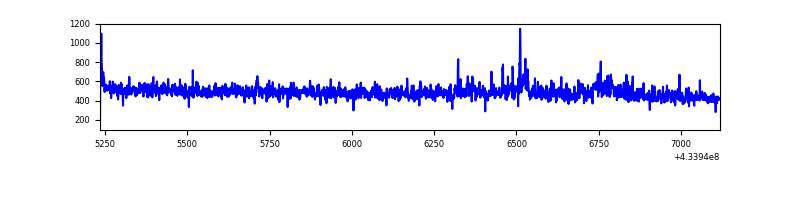 |
| D | 1883 | 1883 | 42 | 42 | 2.23% | 2.23% | 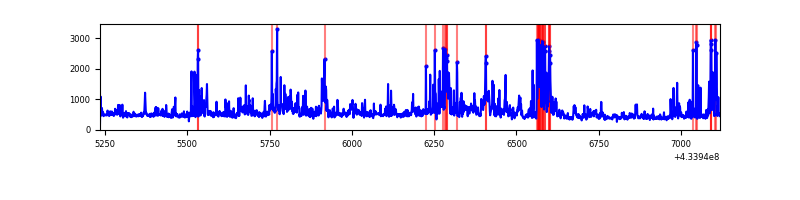 |
Top three noisy pixels from each quadrant. If the there are fewer than three noisy pixels in the level2.evt file, extra rows are filled as -1
| Pixel properties | Quadrant properties | ||||||
|---|---|---|---|---|---|---|---|
| Quadrant | DetID | PixID | Counts | Sigma | Mean | Median | Sigma |
| A | 10 | 83 | 268542 | 5837.81 | 206 | 201 | 46.0 |
| A | 15 | 237 | 37887 | 819.87 | 206 | 201 | 46.0 |
| A | 12 | 189 | 12743 | 272.85 | 206 | 201 | 46.0 |
| B | 0 | 186 | 72529 | 1678.45 | 203 | 197 | 43.1 |
| B | 0 | 245 | 34619 | 798.76 | 203 | 197 | 43.1 |
| B | 0 | 189 | 10443 | 237.76 | 203 | 197 | 43.1 |
| C | 15 | 214 | 81605 | 1666.0 | 197 | 196 | 48.9 |
| C | 3 | 233 | 62979 | 1284.83 | 197 | 196 | 48.9 |
| C | 7 | 220 | 4503 | 88.14 | 197 | 196 | 48.9 |
| D | 2 | 249 | 142528 | 2743.94 | 197 | 191 | 51.9 |
| D | 12 | 218 | 128923 | 2481.66 | 197 | 191 | 51.9 |
| D | 1 | 52 | 124215 | 2390.9 | 197 | 191 | 51.9 |
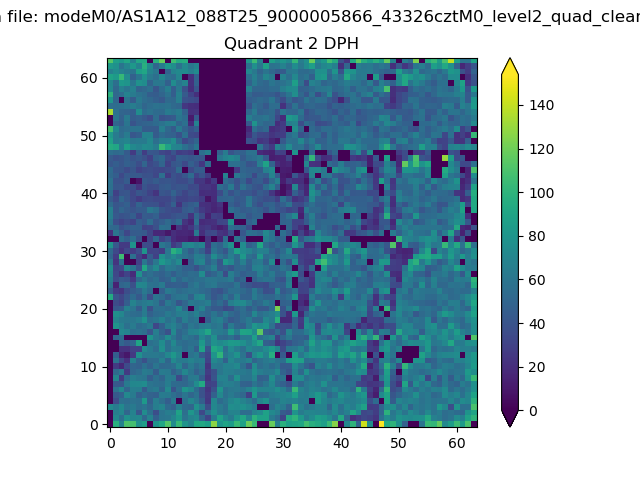
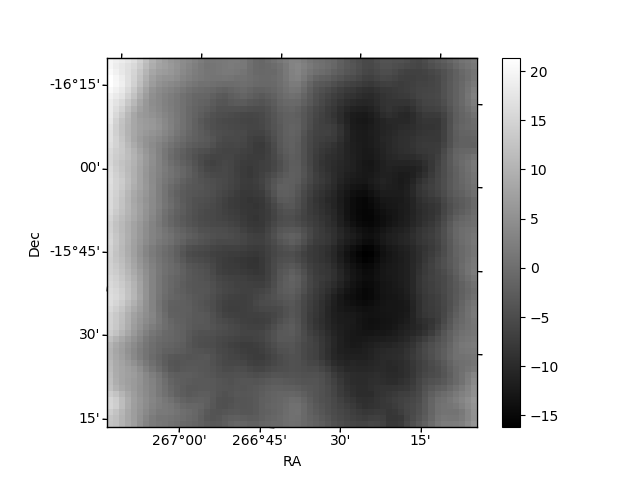
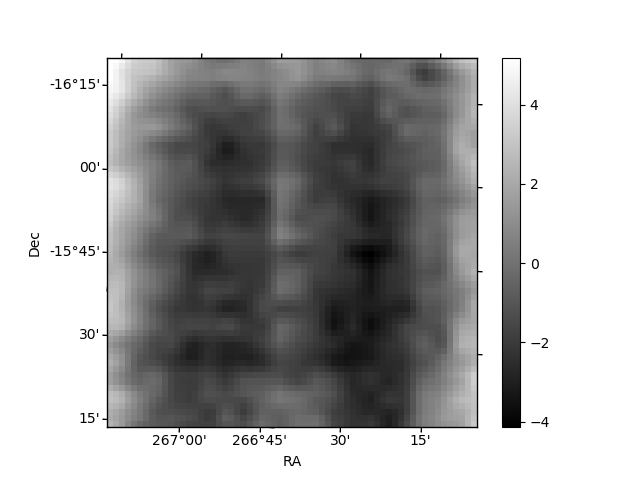
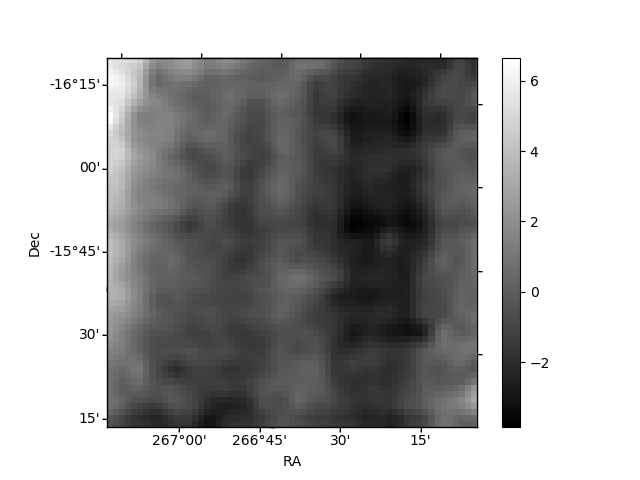
Histogram calculated using DETX and DETY for each event in the final _common_clean file
| Quadrant A | 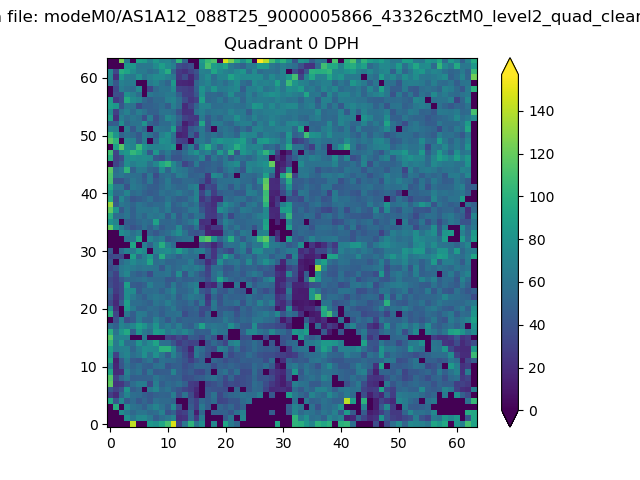 |
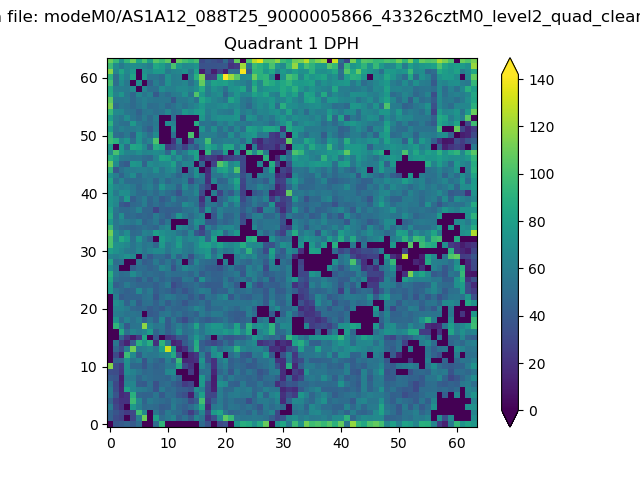 |
Quadrant B |
|---|---|---|---|
| Quadrant D | 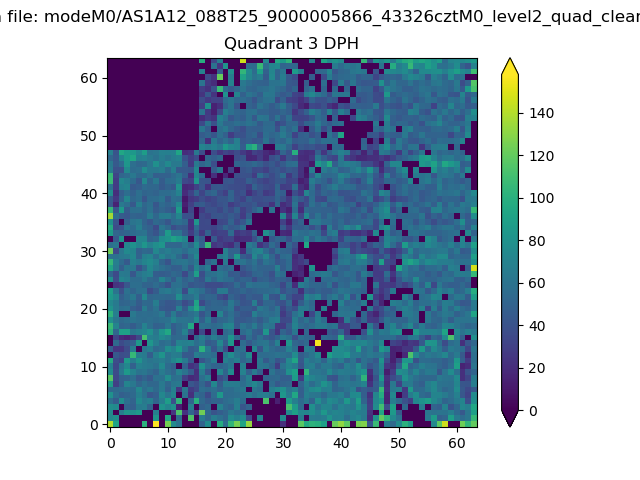 |
 |
Quadrant C |
| Plot type | Count rate plots | Images |
|---|---|---|
| Comparison with Poisson distribution Blue bars denote a histogram of data divided into 1 sec bins. Red curve is a Poisson curve with rate = median count rate of data. |
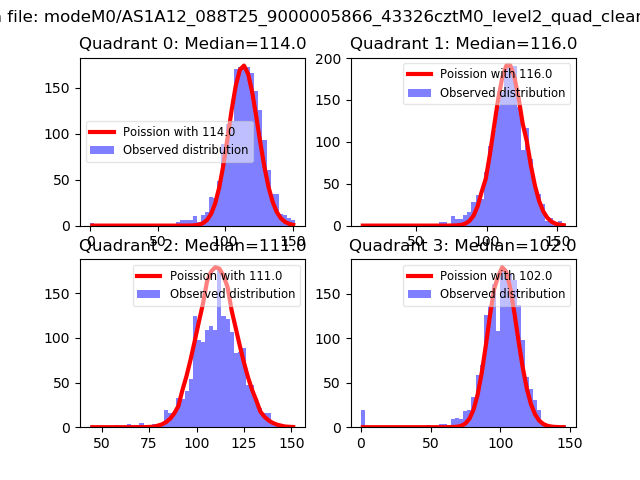 |
 |
| Quadrant-wise count rates Data is divided into 100 sec bins |
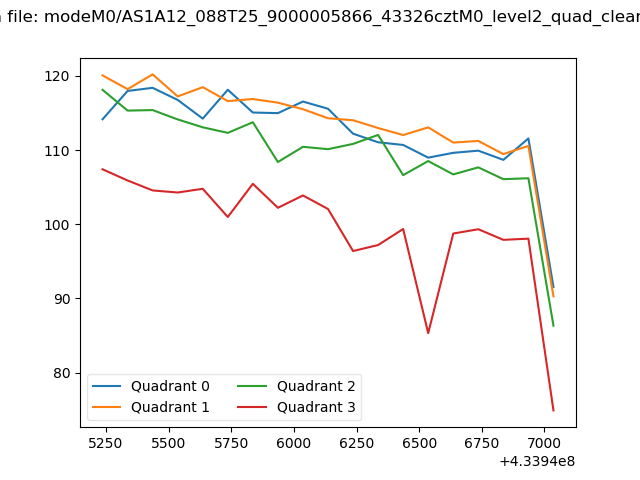 |
|
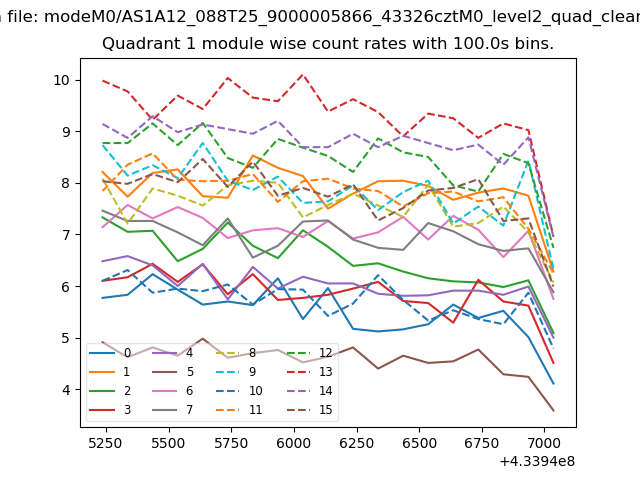
| Module-wise count rates for Quadrant A Data is divided into 100 sec bins |
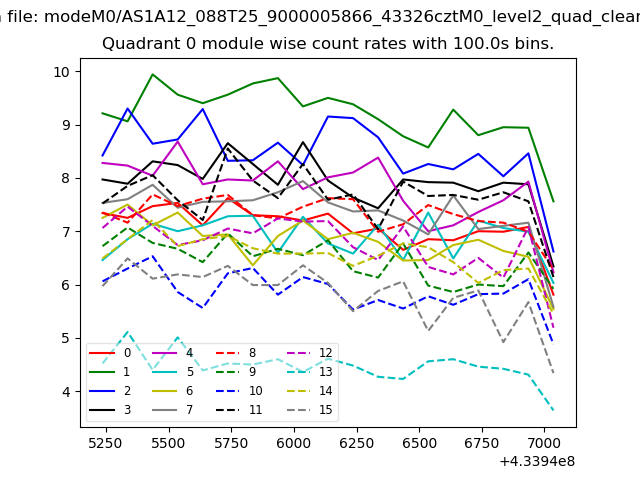 |
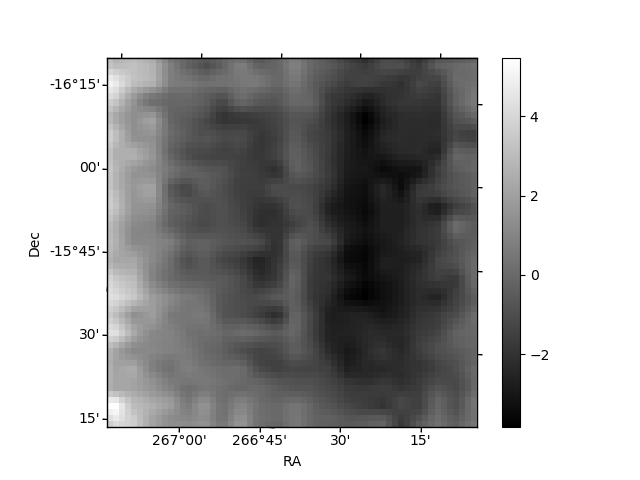 |
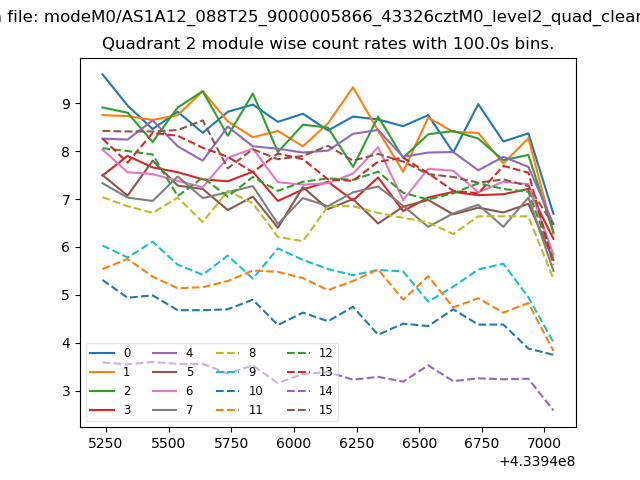
| Module-wise count rates for Quadrant B Data is divided into 100 sec bins |
 |
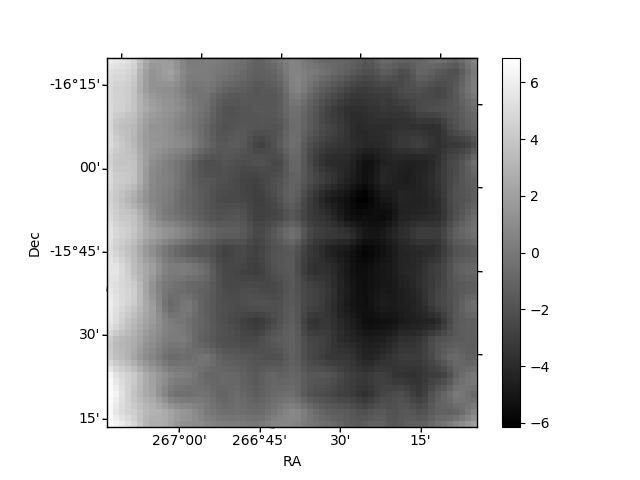 |
| Module-wise count rates for Quadrant C Data is divided into 100 sec bins |
 |
 |
| Module-wise count rates for Quadrant D Data is divided into 100 sec bins |
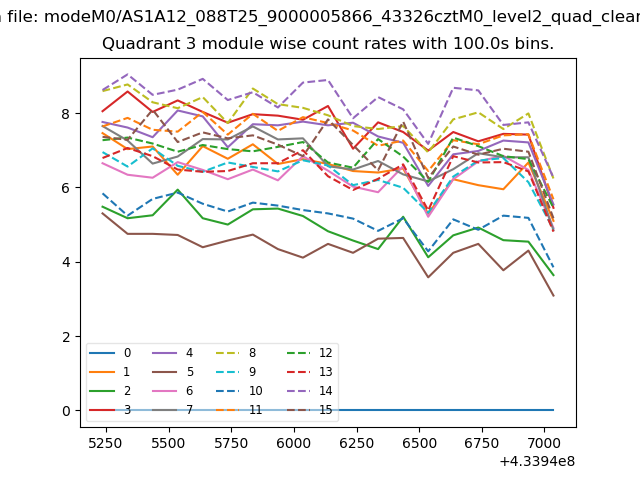 |
 |
| Parameter | Plot |
|---|---|
| CZT HV Monitor | 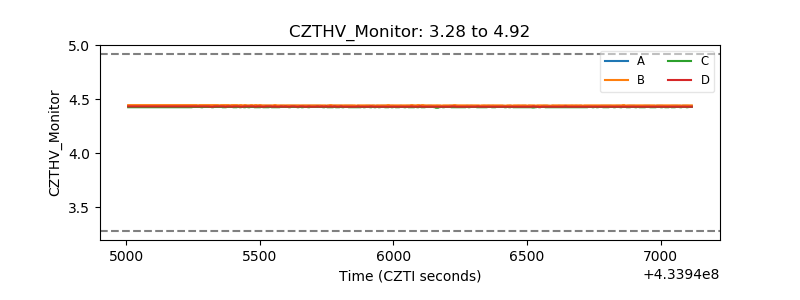 |
| D_VDD | 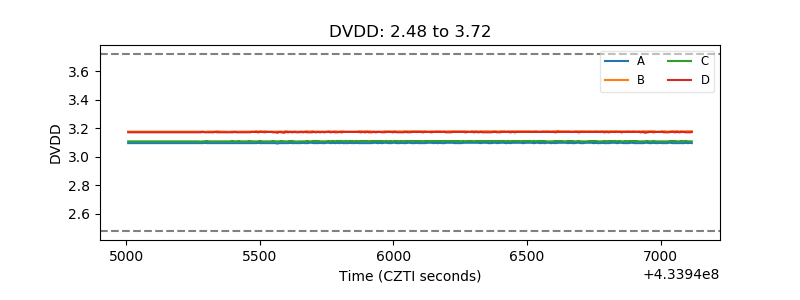 |
| Temperature 1 | 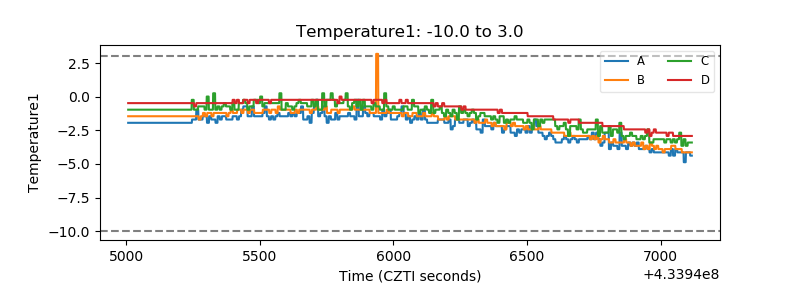 |
| Veto HV Monitor |  |
| Veto LLD | 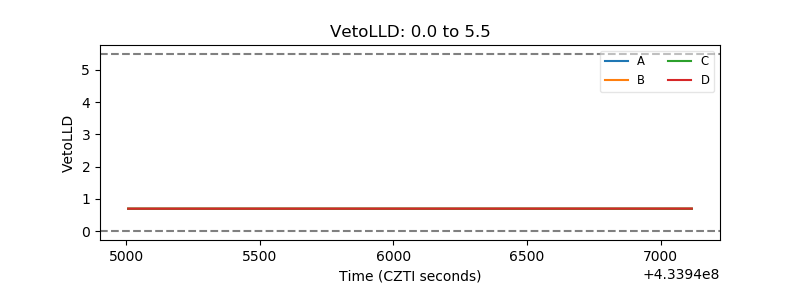 |
| Alpha Counter | 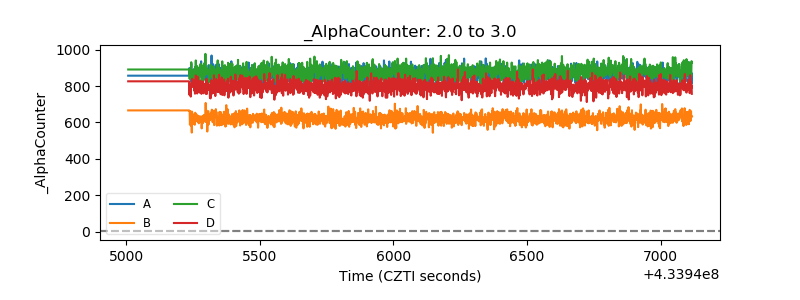 |
| _CPM_Rate | 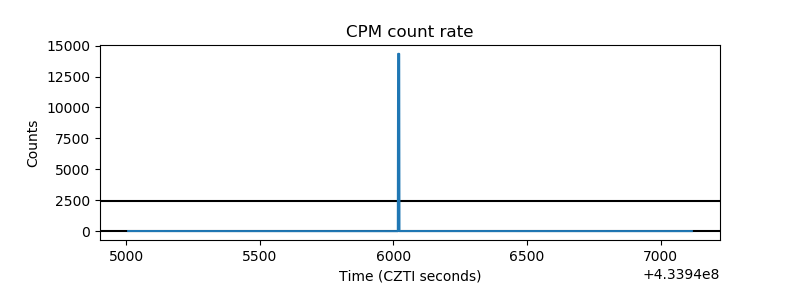 |
| CZT Counter | 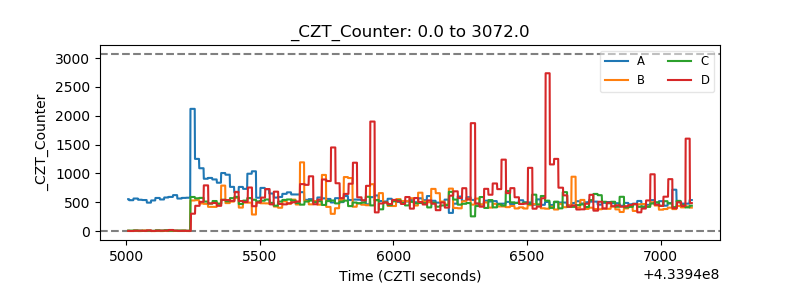 |
| +2.5 Volts monitor | 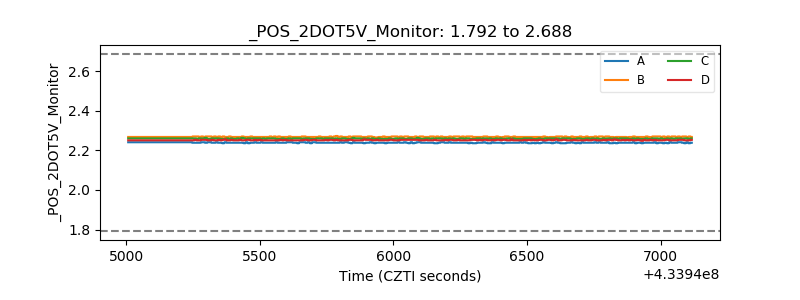 |
| +5 Volts monitor | 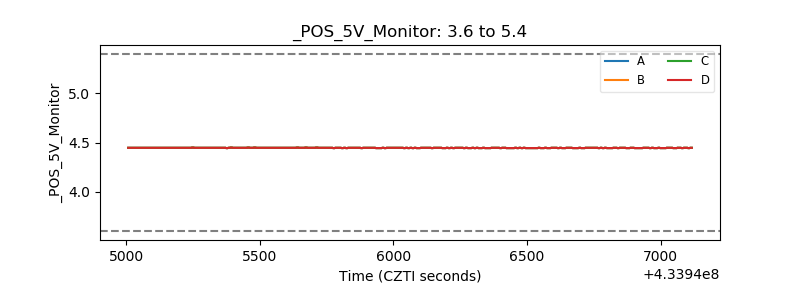 |
| _ROLL_ROT | 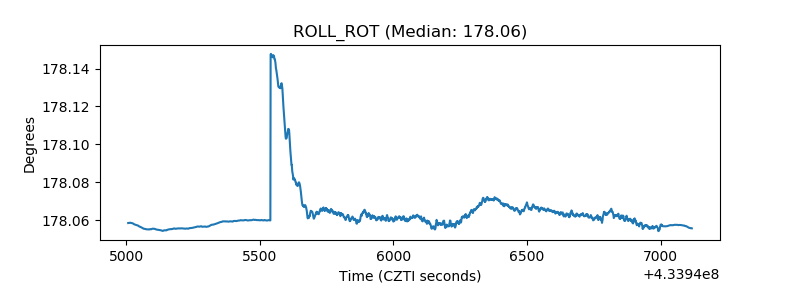 |
| _Roll_DEC | 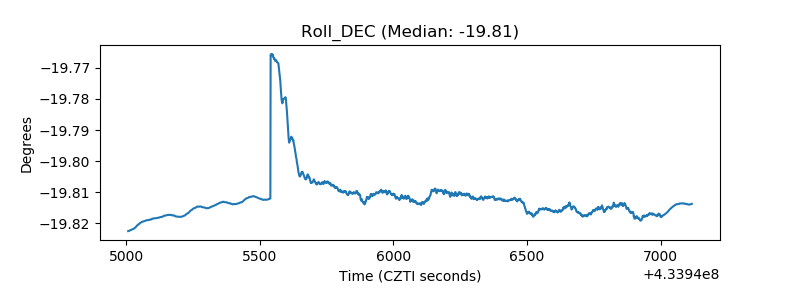 |
| _Roll_RA | 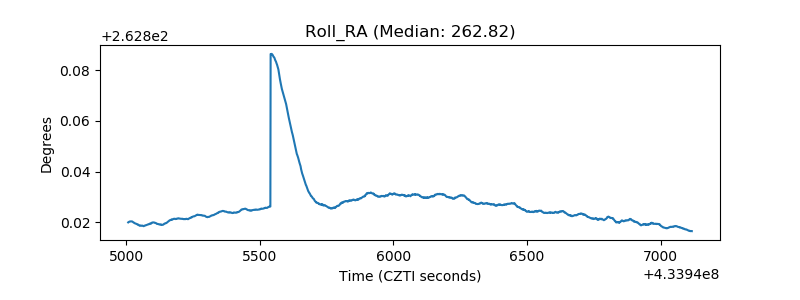 |
| Veto Counter | 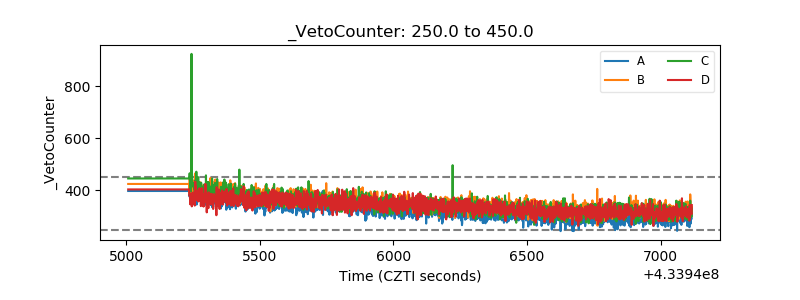 |