| Param | Original file | Final file |
|---|---|---|
| Filename | modeM0/AS1T05_158T01_9000005868_43326cztM0_level2.fits | modeM0/AS1T05_158T01_9000005868_43326cztM0_level2_quad_clean.evt |
| Size (bytes) | 1,215,587,520 | 355,276,800 |
| Size | 1.1 GB | 338.8 MB |
| Events in quadrant A | 12,156,605 | 2,381,590 |
| Events in quadrant B | 10,333,346 | 2,434,426 |
| Events in quadrant C | 10,284,281 | 2,320,162 |
| Events in quadrant D | 10,542,428 | 2,128,117 |
| Mode M0 | |||
|---|---|---|---|
| Quadrant | BADHDUFLAG | Total packets | Discarded packets |
| A | 0 | 49452 | 5 |
| B | 0 | 45865 | 5 |
| C | 0 | 44298 | 5 |
| D | 0 | 47629 | 5 |
| Mode M9 | |||
|---|---|---|---|
| Quadrant | BADHDUFLAG | Total packets | Discarded packets |
| A | 0 | 76 | 0 |
| B | 0 | 76 | 0 |
| C | 0 | 76 | 0 |
| D | 0 | 76 | 0 |
| Mode SS | |||
|---|---|---|---|
| Quadrant | BADHDUFLAG | Total packets | Discarded packets |
| A | 0 | 442 | 0 |
| B | 0 | 442 | 0 |
| C | 0 | 442 | 0 |
| D | 0 | 442 | 0 |
| Quadrant | Total seconds | Saturated seconds | Saturation percentage |
|---|---|---|---|
| A | 21688 | 268 | 1.235706% |
| B | 21688 | 249 | 1.148100% |
| C | 21688 | 16 | 0.073774% |
| D | 21687 | 260 | 1.198875% |
Noise dominated data is calculated using 1-second bins in cleaned event files. If a bin has >2000 counts, and if more than 50% of those come from <1% of pixels, then it is considered to be noise-dominated and hence unusable.
| Quadrant | # 1 sec bins | Bins with >0 counts | Bins with >2000 counts | High rate bins dominated by noise | Noise dominated (total time) | Noise dominated (detector-on time) | Marked lightcurve |
|---|---|---|---|---|---|---|---|
| A | 29241 | 21693 | 147 | 147 | 0.50% | 0.68% | 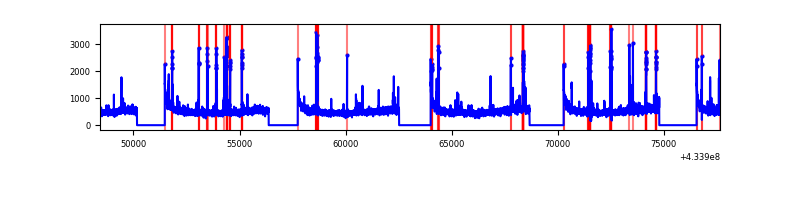 |
| B | 29241 | 21693 | 180 | 180 | 0.62% | 0.83% | 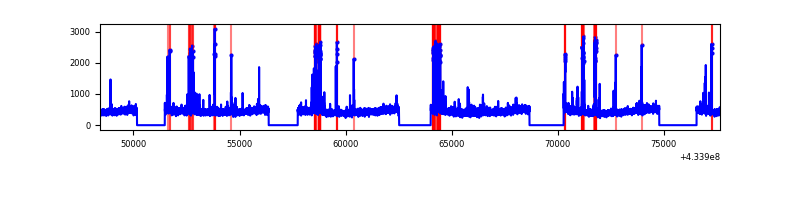 |
| C | 29241 | 21693 | 8 | 8 | 0.03% | 0.04% | 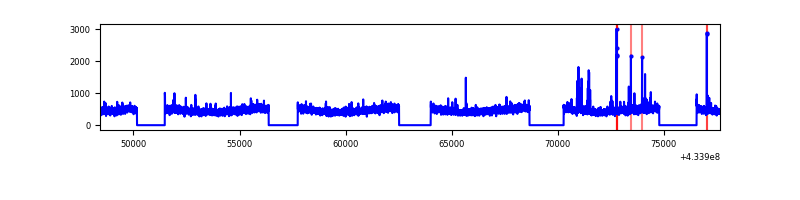 |
| D | 29240 | 21691 | 261 | 261 | 0.89% | 1.20% | 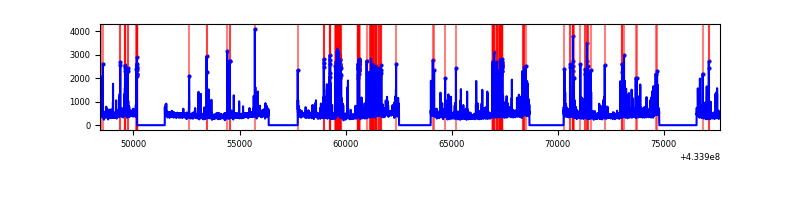 |
Top three noisy pixels from each quadrant. If the there are fewer than three noisy pixels in the level2.evt file, extra rows are filled as -1
| Pixel properties | Quadrant properties | ||||||
|---|---|---|---|---|---|---|---|
| Quadrant | DetID | PixID | Counts | Sigma | Mean | Median | Sigma |
| A | 10 | 83 | 1980396 | 4065.36 | 2382 | 2331 | 486.6 |
| A | 15 | 237 | 688997 | 1411.25 | 2382 | 2331 | 486.6 |
| A | 12 | 189 | 215347 | 437.79 | 2382 | 2331 | 486.6 |
| B | 5 | 172 | 772362 | 1664.45 | 2372 | 2303 | 462.7 |
| B | 0 | 245 | 97151 | 205.01 | 2372 | 2303 | 462.7 |
| B | 0 | 189 | 91495 | 192.78 | 2372 | 2303 | 462.7 |
| C | 15 | 214 | 889303 | 1608.5 | 2345 | 2358 | 551.4 |
| C | 15 | 159 | 127616 | 227.16 | 2345 | 2358 | 551.4 |
| C | 3 | 233 | 84891 | 149.68 | 2345 | 2358 | 551.4 |
| D | 12 | 6 | 981707 | 1706.09 | 2323 | 2254 | 574.1 |
| D | 13 | 249 | 263754 | 455.5 | 2323 | 2254 | 574.1 |
| D | 2 | 249 | 217458 | 374.86 | 2323 | 2254 | 574.1 |
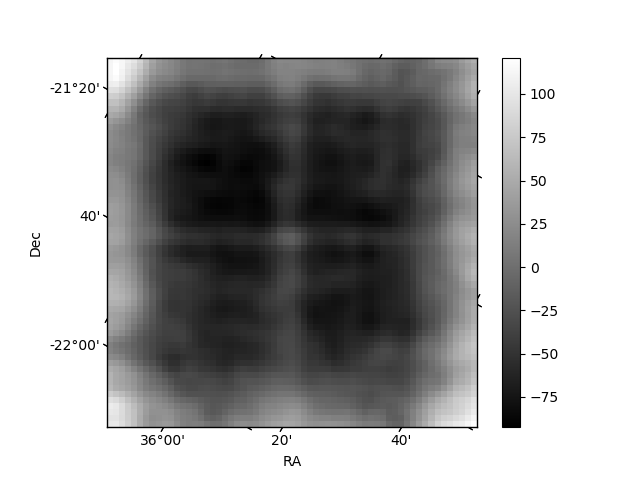
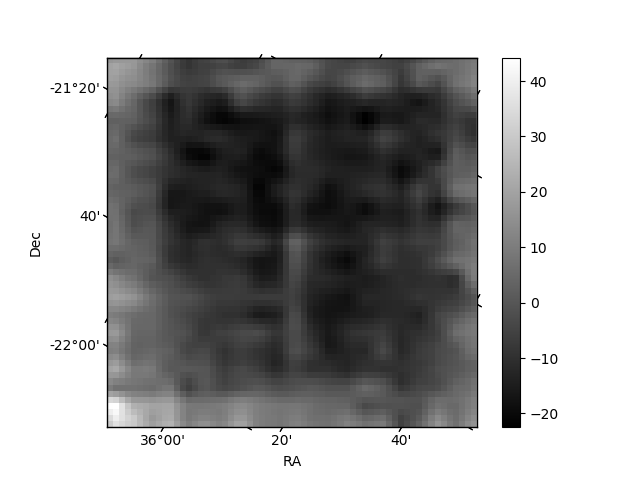
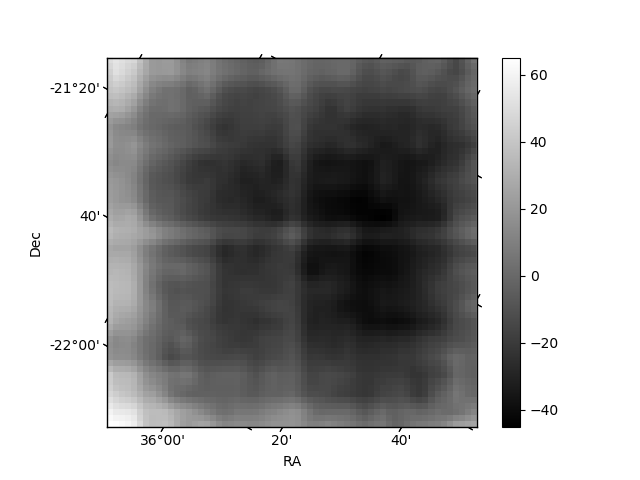
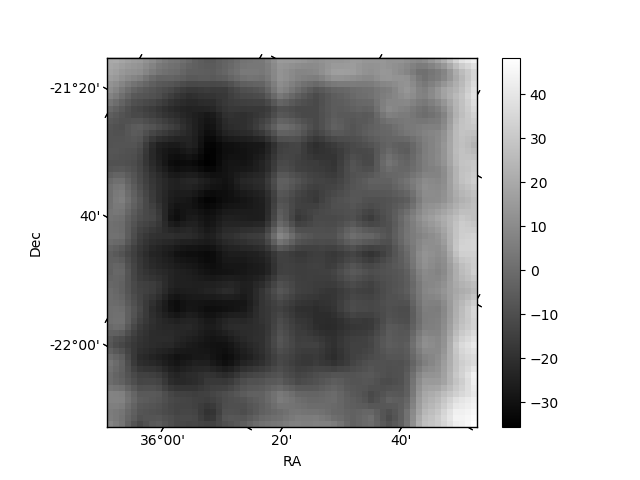
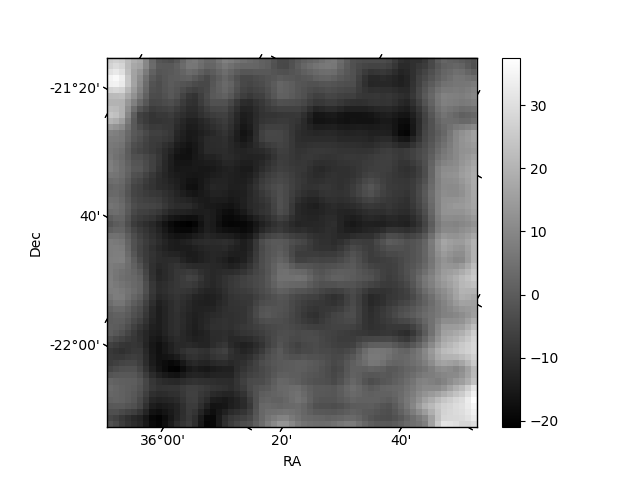
Histogram calculated using DETX and DETY for each event in the final _common_clean file
| Quadrant A | 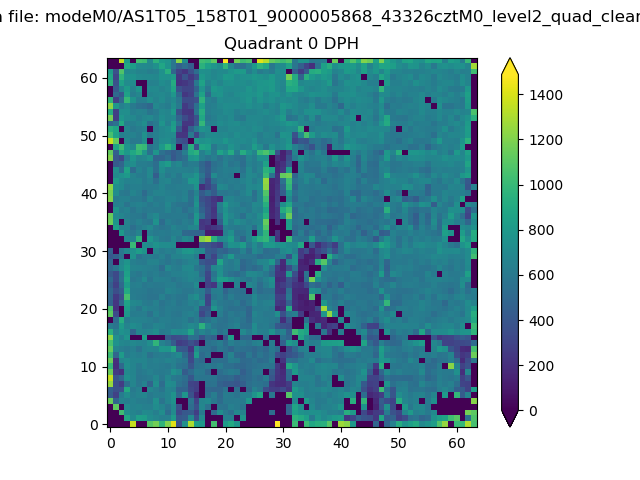 |
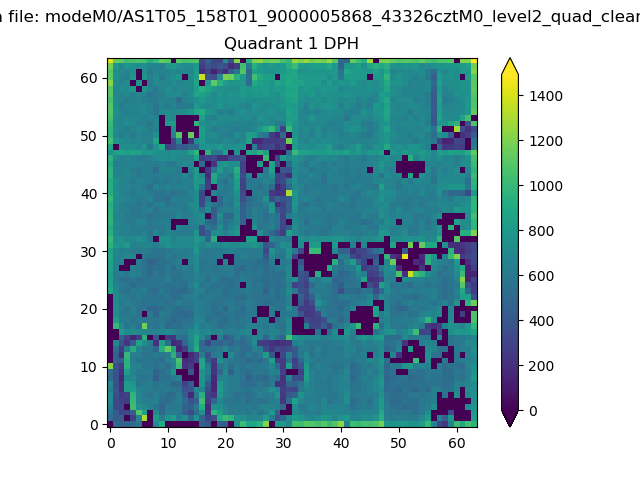 |
Quadrant B |
|---|---|---|---|
| Quadrant D | 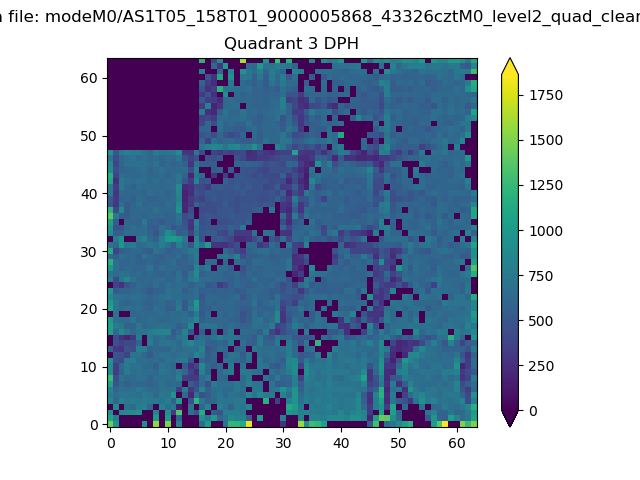 |
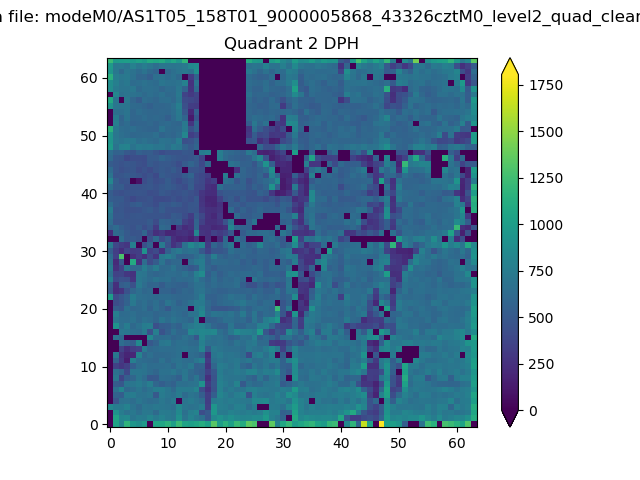 |
Quadrant C |
| Plot type | Count rate plots | Images |
|---|---|---|
| Comparison with Poisson distribution Blue bars denote a histogram of data divided into 1 sec bins. Red curve is a Poisson curve with rate = median count rate of data. |
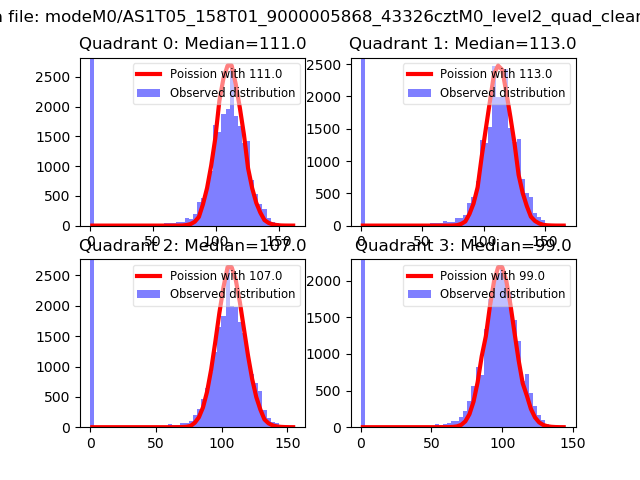 |
 |
| Quadrant-wise count rates Data is divided into 100 sec bins |
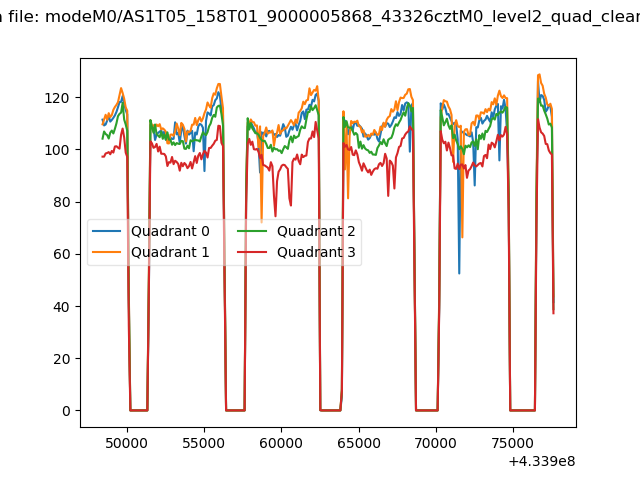 |
|
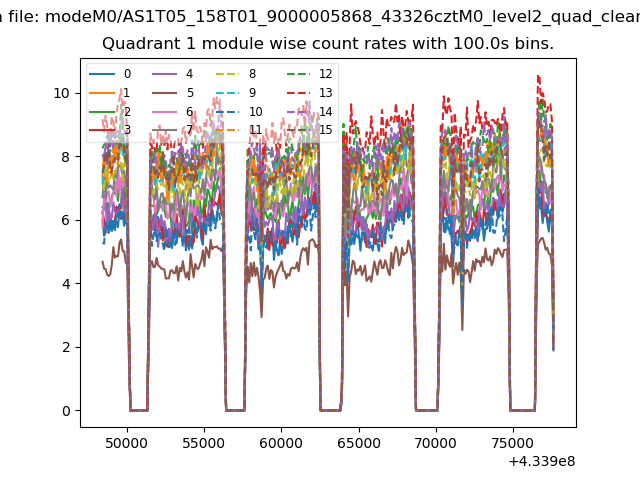
| Module-wise count rates for Quadrant A Data is divided into 100 sec bins |
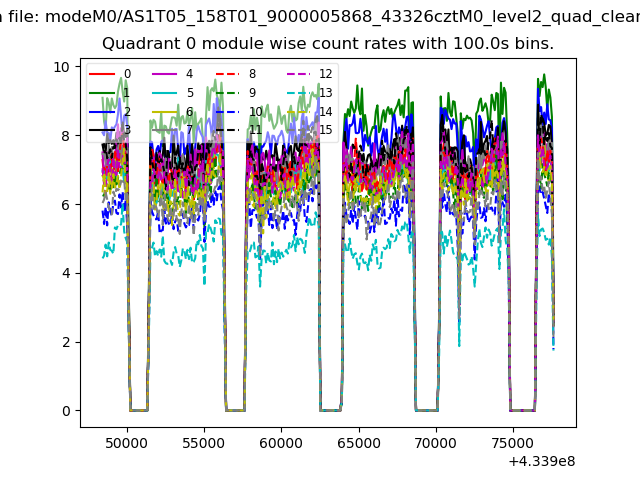 |
 |
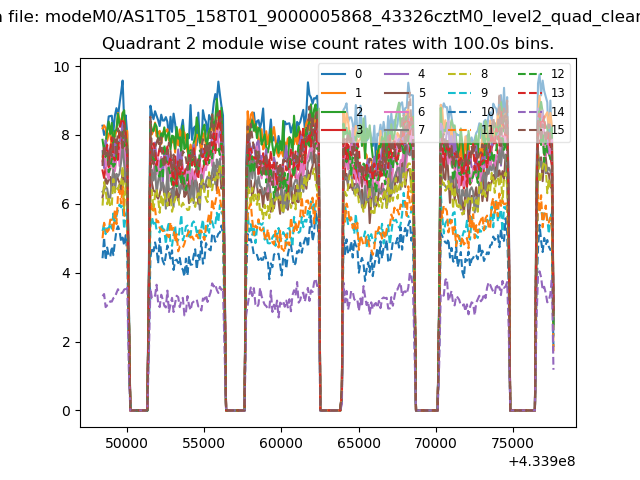
| Module-wise count rates for Quadrant B Data is divided into 100 sec bins |
 |
 |
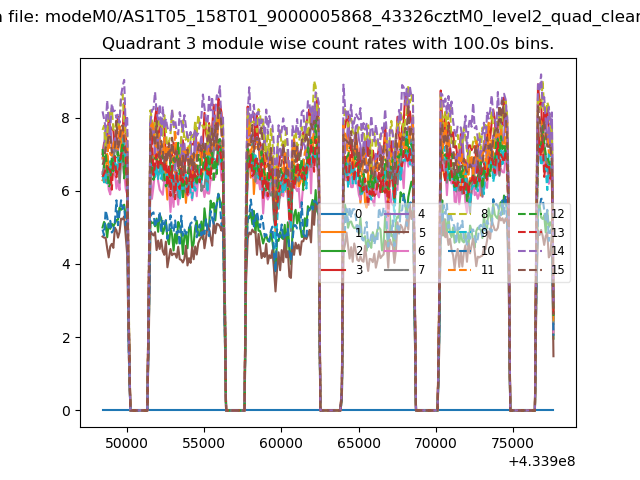
| Module-wise count rates for Quadrant C Data is divided into 100 sec bins |
 |
 |
| Module-wise count rates for Quadrant D Data is divided into 100 sec bins |
 |
 |
| Parameter | Plot |
|---|---|
| CZT HV Monitor | 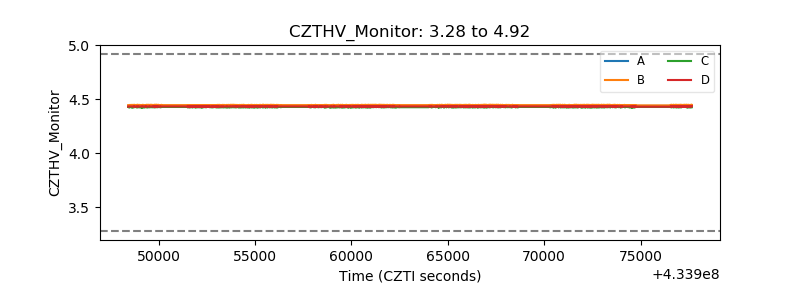 |
| D_VDD | 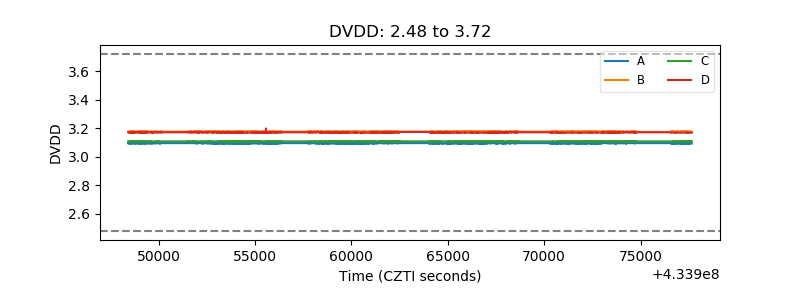 |
| Temperature 1 | 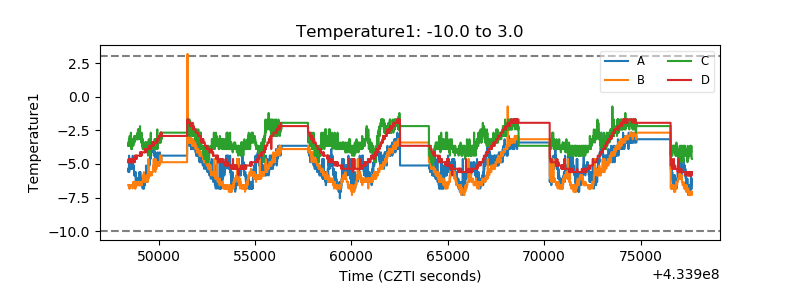 |
| Veto HV Monitor | 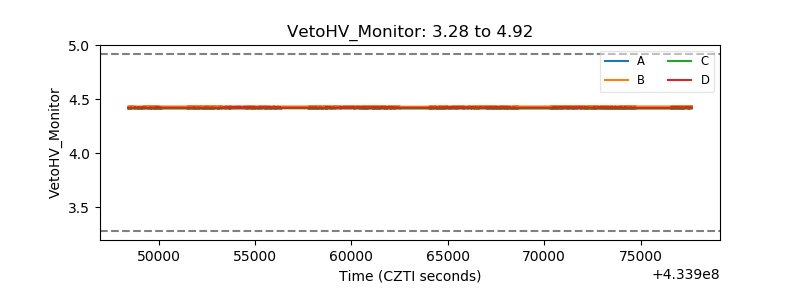 |
| Veto LLD | 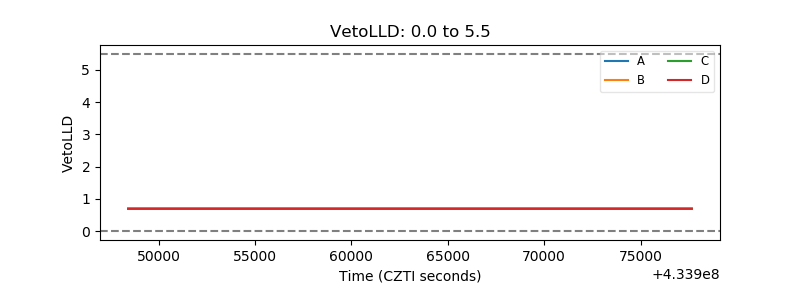 |
| Alpha Counter | 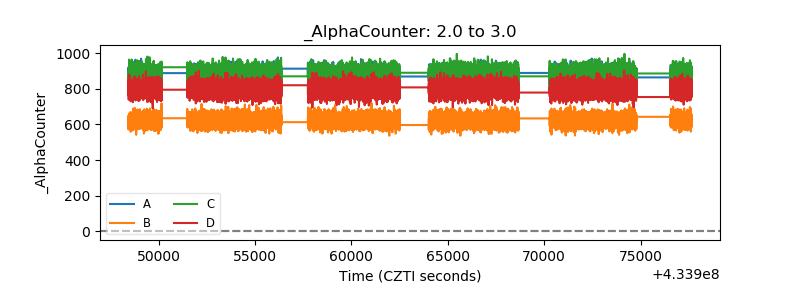 |
| _CPM_Rate | 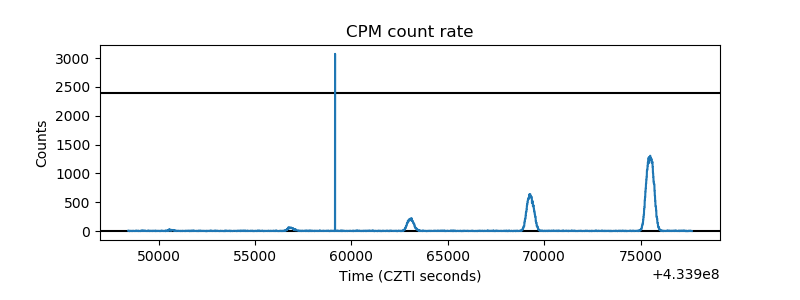 |
| CZT Counter | 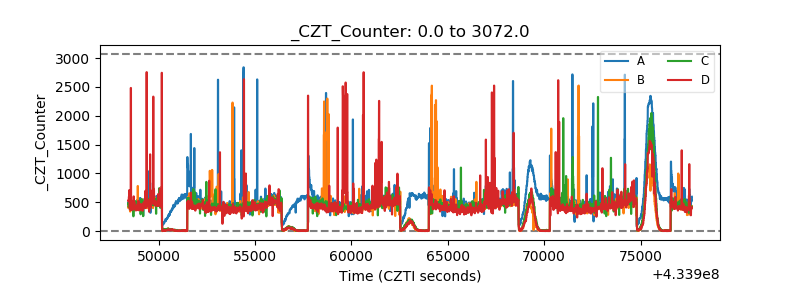 |
| +2.5 Volts monitor | 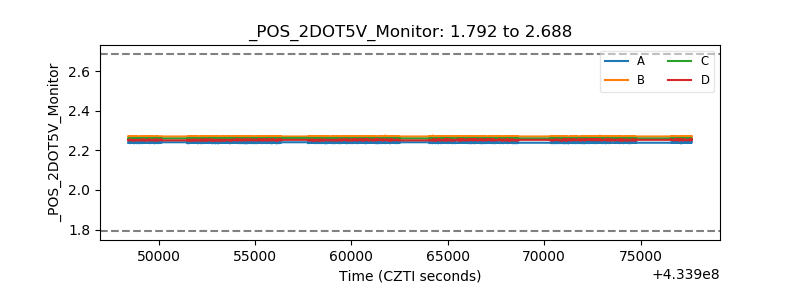 |
| +5 Volts monitor | 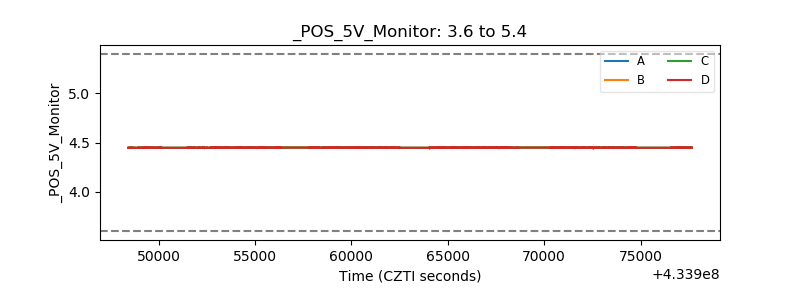 |
| _ROLL_ROT | 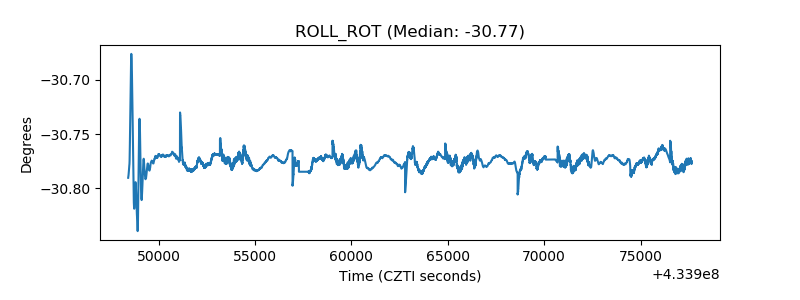 |
| _Roll_DEC | 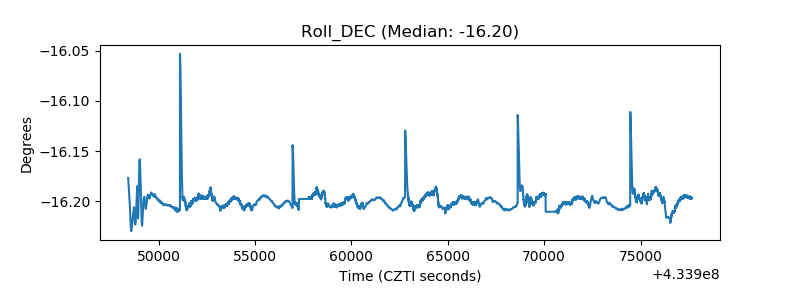 |
| _Roll_RA | 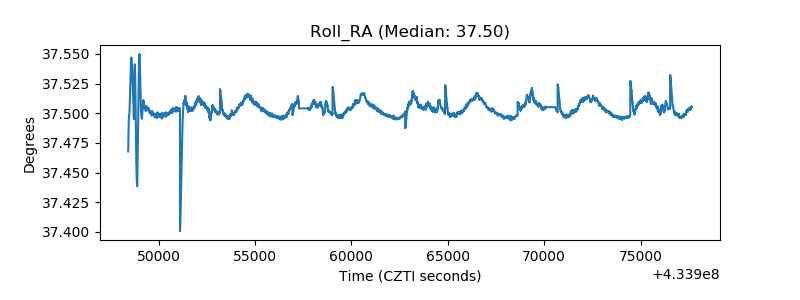 |
| Veto Counter | 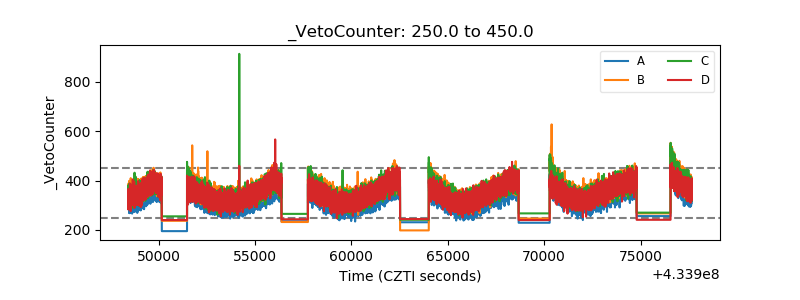 |